Disruption of redox homoeostasis may lead to oxidative stress, that is, production of reactive oxygen species (ROS), and can induce many pathological conditions, including atherosclerosis, stroke, Alzheimer’s disease, Parkinson’s disease, and cancer.[1] Non-invasive observation of intracellular redox activities and their relationship to physiological function is a challenge for molecular imaging.[2] Magnetic resonance imaging (MRI) has recently emerged as a most promising tool for molecular imaging.[3] Typically MRI is not capable of sensing biochemical activity, but current advances in activatable contrast agents, which generate a signal in response to some variable in their immediate environment, hold the promise that MR contrast agents can be designed to be reporters of biological processes (i.e. pH, temperature, oxygen pressure, redox, enzyme, and metal-ion concentration).[3,4] To date nitroxides are the most commonly used redox-sensitive paramagnetic contrast agents for MRI. However, the combination of relatively low relaxivity and short life spans limit the extensive use of MRI in observation of redox activities in living systems.[4c,5]
We have developed activatable MRI contrast agents by coupling a dye molecule, which undergoes remarkable structural change and charge shifts that are trigged by light or electrical activity,[6] to a macrocycle-based gadolinium complex, Gd(DO3A) (DO3A: 1,4,7,10-tetraazacyclododecane-1,4,7-trisacetic acid). When an isomerization-inducing stimulation is applied, the structural change of the molecule influences the accessibility of water molecules to the GdIII center, causing the two isomers to have different magnetic properties, thus producing different contrast enhancement.[7] Herein, a spironaphthoxazine molecule which is from an established family of molecular switches was coupled to Gd(DO3A) to generate complex 1 (see scheme 1).[8] It was found that reduced nicotinamide adenine dinucleotide (NADH) can trigger the isomerization of spironaphthoxazine moiety in 1. The structural change resulted in a significant and immediate increase in MRI signal intensity accompanied by quenching of the intense fluorescence of 1.
Scheme 1.
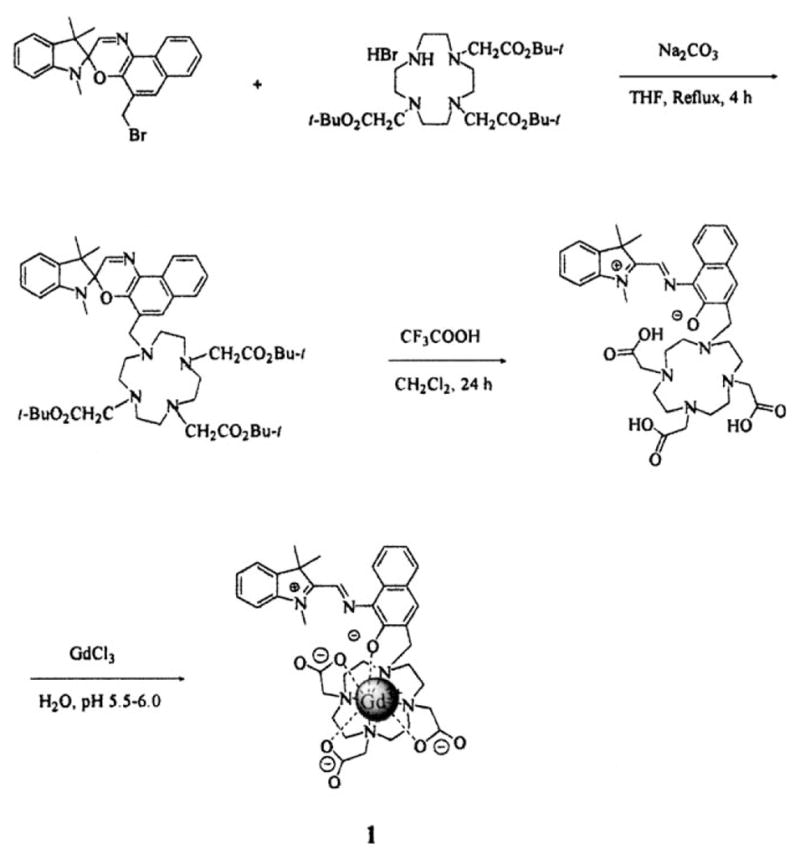
Synthesis of spironaphthoxazine-Gd(DO3A) complex 1.
NADH has been recognized as one of the key bioenergetic factors that determine ROS formation.[1,9] Increases in NADH level (NADH/NAD+ ratio) in mitochondria, as a result of reverse electron transfer in the presence of succinate or α-glycerophosphate or impaired oxidation of NADH to NAD+ during forward electron transfer, stimulates super-oxide generation, which results in pathological conditions.[9a] Therefore, there has been considerable interest over the past few decades in detecting NADH levels in living systems for detailed studies of cell metabolism and biochemistry in relation to disease processes and therapies. To date optical techniques have been the most commonly used imaging technology to investigate NADH activities in living organisms for such studies.[10] Although optical techniques are highly sensitive and can obtain detailed information at subcellular levels, they have low anatomic resolution and are prone to attenuation with increased tissue depth, which limits their utility in living systems. A gadolinium-based contrast agent sensitive to redox would open MRI to a host of new applications in functional imaging, particularly for evaluating the role of ROS in degenerative diseases as well as tissue redox status in diseases related to oxidative stress.
The synthesis of spironaphthoxazine-Gd(DO3A) (1) was initiated in dry THF by the alkylation of the tris-tert-butyl ester of DO3A with the 5′-bromomethylated spironaphthoxazine. The precursors tris-tert-butyl ester of DO3A and 5′-bromomethylated spironaphthoxazine were synthesized using reported procedures.[11] The resulting tris-tert-butyl ester of spironaphthoxazine-DO3A was hydrolyzed with trifluoro-acetic acid in dichloromethane to give the corresponding acid of spironaphthoxazine-DO3A (ligand). Finally the complexation of gadolinium with the ligand was carried out in deionized water at pH 5.5–6.0 to yield complex 1 (Scheme 1). The formation of complex 1 was verified by high-resolution mass spectroscopy (HRMS), which showed an appropriate isotope pattern.
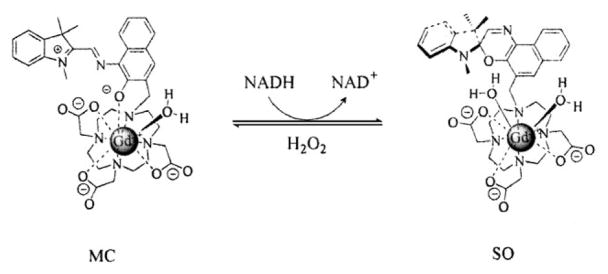
The ligand has a distinct absorption at 619 nm in methanol. After complexation with Gd3+ ion, the complex 1 has a distinct absorption at 440 nm in aqueous solution in the dark and the absorption at 619 nm disappeared, indicating that the complex 1 is in the acyclic merocyanine (MC or “open”) form shown in Scheme 1.[8] An absorption shift for spirophenanthrolineoxazine after complexation with metal ions is also seen in the process of complexation of spirophenanthrolineoxazine and Eu3+ ion, during which the intensity of the absorption of spirophenanthrolineoxazine at 600 nm decreases significantly and the new peak appears at 460 nm.[12] This result supports that spironaphthoxazine-DO3A is coordinated to the Gd3+ ion in our complex. The preference of 1 towards the MC isomer may be due to the highly polar solvent (water) and strong electrostatic interaction between the high charge density of the cyclen-complexed gadolinium ion and the phenoxide oxygen, which restricts the conversion of complex 1 from MC form into the spirocyclic isomer (SO or “closed” form; Scheme 2).[13]
Scheme 2.
The isomerization of complex 1 triggered by NADH and hydrogen peroxide.
The reduction of complex 1 was tested in water using several biological reducing agents, such as NADH, L-cysteine, and L-ascorbic acid. The reaction with NADH, in pH 7.0 deionized water in the dark, rapidly and significantly decreased the absorption of 1 at 440 nm (Figure 1). The other two reducing agents had almost no influence on the absorption of complex 1 at 440 nm. The reaction was also verified by the increase of absorption of NAD+ at 259 nm and decrease of absorption of NADH at 339 nm. After initiation, the reaction proceeded rapidly, as indicated by an immediate and significant decrease of the absorption at 440 nm after addition of NADH. After the initial rapid decrease, the absorption peak continued to decrease slowly. The observed reaction rate was dependent upon the mole ratio of NADH to gadolinium. The absorption profile of NADH did not change when mixing NADH with Gd(DOTA) (DOTA =1,4,7,10-tetraazacyclododecane-1,4,7,10-tetraacetic acid) or aqueous GdCl3 solution, thus indicating that the reduction of 1 occurs in its spironaphthoxazine unit. When there was no further change in the absorption at 440 nm after the addition of NADH, hydrogen peroxide (3:1, H2O2/NADH) was applied to the system. The absorption of complex 1 at 440 nm was quickly and partially (ca. 1/3) restored, the change in absorption then became slow, indicating the incomplete reversal to MC isomer from the reduction product.
Figure 1.
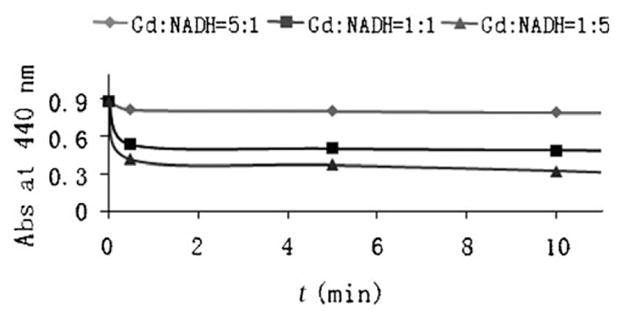
Reaction of complex 1 (2.18 × 10⁻⁴ M) with NADH in pH 7.0 deionized water.
The aqueous solution of complex 1 in the dark fluoresces strongly at 539 nm. The intensity of emission is maximal when excited at 460 nm. The quantum yield of 1 in water is 22% when compared with Rhodamine 101 whose quantum yield is reported to be 100% in ethanol when excited at 450 nm.[14] The fluorescence of complex 1 was quite stable in the dark, but it was gradually quenched after addition of NADH (molar ratio 1:1) and nearly disappears in 30 min (Figure 2). The quenching of fluorescence with time was also clearly seen in confocal microscopy (not shown). After quenching of the fluorescence, hydrogen peroxide (3:1, H2O2:NADH) was applied to the system. The emission of complex 1 at 539 nm was found to be restored partially (ca. 1/3) in 30 min, suggesting the slow recovery of the MC isomer from the reduction product. We conclude that the reduction of 1 by NADH generates a ring-closed form of 1, where the extended π system is interrupted, thus no absorption is observed in the visible region and the fluorescence is also quenched. When hydrogen peroxide is applied, the reduced ring-closed form is oxidized to the ring-open MC form of 1, thus the absorption at 440 nm increases and the fluorescence is observed again.
Figure 2.
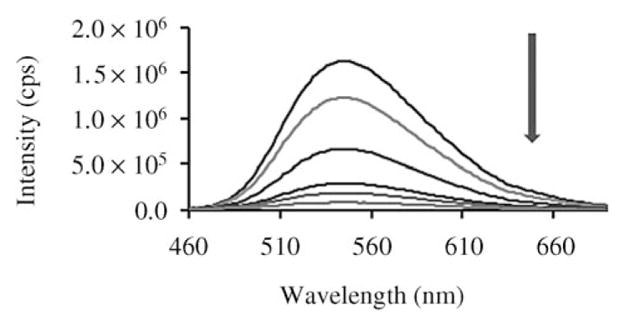
Fluorescent spectroscopic change during the reaction of complex 1 (1.82 × 10⁻⁴M) with NADH (Gd:NADH =1:1) in pH 7.0 deionized water with excitation at 460 nm. Line from top: complex 1 in the dark, mixture of compound 1 and NADH at: 0, 5, 10, 20, and 30 min.
As relaxivity as a result of inner-sphere water molecules is directly proportional to the number of water molecules (q) coordinated to the metal center, the T1 relaxation time and q of 1 were measured and the effect of NADH on the relaxivity (r1) of aqueous solutions of compound 1 was evaluated. The hydration number, q, was estimated from the gadolinium-induced 17O shift. Although there is substantial line broadening caused by gadolinium, at 80°C this decreases and reasonable estimates of q can be made with approximately 20–25% accuracy.[15] For reference purposes, the q of GdCl3 in aqueous solution at pH 3.5, and the T1 relaxation time and q of Gd(DOTA) at neutral pH value were measured under the same conditions.
A stock solution of 1 was prepared by dissolving 1 in pH 7.0 deionized water. The concentration was determined by gadolinium analysis using inductively coupled plasma (ICP)-MS. All solutions were prepared by weight. Gadolinium concentrations were calculated based on the concentration of the stock solution and appropriate dilution factors. Applying the method of Djanashvilli and Peters, we found q = 9.9 for the gadolinium aqua ion and q =1.1 for Gd(DOTA) which are within 11% of the expected values of q =9 and q = 1, respectively.[16] The r1 of Gd(DOTA) was (3.94 ± 0.21) mM−1s−1 which is in agreement with literature values.[17]
The r1 value of complex 1 in the dark is (5.58 ± 0.36) mM−1s−1, which is higher than that of Gd(DOTA). After complex 1 was mixed with NADH the r1 value and q increased to (8.60 ± 0.74) mM−1s−1 and 2.01 ± 0.05, respectively. This result suggests that the phenoxide oxygen is no longer coordinated and one more water molecule coordinates to the gadolinium. The control experiment showed that the same NADH concentration has no influence on the T1 relaxation time or on the 17O chemical shift of water. Thus, the reduction of complex 1 by NADH results in a r1 relaxivity increase of approximately 54%. The same result was obtained when using pH 7.0 NaH2PO4-Na2HPO4 (0.1M) buffer solution for these studies. After the T1 measurement of the reaction between complex 1 and NADH finished, hydrogen peroxide (3:1, H2O2:NADH) was applied to the system and the mixture was incubated at 37°C for 10 min. Then the T1 was measured under the same conditions used before. It was found that the T1 value of complex 1 was fully restored, implying the restoration of MC isomer from the reduction product. Control studies with same amounts of NADH and hydrogen peroxide in water show no effect on T1.
T1-weighted MR imaging of complex 1 was performed on a Biospec 7T system (Bruker, Billerica, MA) in aqueous solution. A series of aqueous solutions of complex 1 was prepared and stored in the dark. Images were taken before and immediately after the addition of NADH to the solutions, then 10 and 30 min later. After the addition of NADH the signal intensity of the MRI images increased significantly and immediately (Figure 3); longer incubation time with NADH did not increase the signal intensity further.
Figure 3.
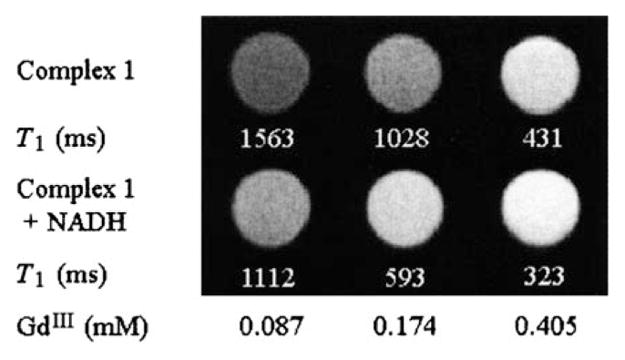
Aqueous solutions of 1 imaged by T1-weighted MRI before (top) and immediately after addition of NADH (bottom) show different brightness. The ratio of GdIII to NADH in each solution is 1:1.
The absorption and fluorescence changes suggest that the reduction product is a ring-closed form of 1. To confirm that it was isomerization and not other chemical reactions occurring, the reaction products were monitored by mass spectrometry over time. It was found that the mass peak at m/z 839 ((M + H) of complex 1) did not change over time, indicating that the reduction product of complex 1 was the SO isomer of complex 1, as shown in Scheme 2. The change in r1 relaxivity and fluorescence intensity of 1 induced by NADH and hydrogen peroxide may be explained by the physical differences between 1-MC and 1-SO isomeric forms. The ability of 1 to create contrast in MRI depends on the interaction of water molecules with the complexed gadolinium. In the MC isomer there are eight coordinated atoms, including a phenolate anion which has a weaker donating ability than the other three carboxylate anions (q =1.26 ± 0.03) in the first coordination sphere of GdIII. When NADH induces the isomerization of complex 1 to the SO form, the phenoxide oxygen anion is displaced and one more water molecule is allowed to access the first coordination sphere of GdIII (q =2.01 ± 0.05), thus increasing the r1 relaxivity and signal intensity in MRI. Interruption of the extended π system at the new formed spiral carbon atom in SO form also explains the observed fluorescence quench. When hydrogen peroxide was applied, the reduced SO form was oxidized to the ring-open MC form of 1, thus the T1 value recovered.
As a preliminary investigation of the utility of the multimodal probe for biological applications, complex 1 was applied to NIH3T3 fibroblast cells in culture and the toxicity was evaluated by through the use of C12–Resazurin viability kit (Invitrogen).[18] The result shows that the average cell viability is 90% after 24 h incubation with 1. After addition of NADH, the r1 relaxivity of 1 increases by 54%. The product of reaction between complex 1 and NADH was also applied to NIH3T3 cells in culture. The results indicate that the product is also non-toxic to cells.
The intracellular NADH level of P388D1 murine macrophages was quantified to be around 10−6M with a NAD+/NADH Quantitation Kit (Biovision) according to the procedure provided in the kit. We performed studies on P388D1 using externally applied NADH to mimic the millimolar NADH levels that can be found in some tissues[19] to get a preliminary profile on the sensitivity of 1 to varying NADH levels in a living system. P388D1 cells were incubated with complex 1 (0.103 mM) for 1 h and then an equivalent amount of NADH was added to the system. The cells were immediately imaged by confocal microscopy with 458 nm excitation, then after 5, 10, and 20 min, as shown in Figure 4. Uptake of complex 1 is visible as mostly diffuse labeling with some evidence of punctuated spots of fluorescence in the cytoplasm of the cells. This pattern of signal is consistent with diffusion into the cell with some component of uptake through endocytosis or phagocytosis.[20] The image acquired immediately after addition of NADH still had a very strong fluorescence intensity. The intensity decreased with time and almost disappeared in 20 min, which is in significant contrast to cells containing only complex 1.
Figure 4.
Fluorescent spectroscopic change during the reaction of complex 1 (1.03 × 10⁻⁴ M) with NADH (Gd:NADH =1:1) in P388D1.
T1-weighted MRI experiments were also performed in cells, (Figure 5). Cells were incubated with 1, rinsed, then exposed to exogenous NADH. Cells exposed to NADH show significant contrast enhancement, and this occurs on a similar time scale to that in solution. The signal intensity of the MRI images increased immediately after addition of NADH, longer incubation times with NADH did not further increase signal intensity. These preliminary studies in cells support that 1 is biocompatible and can be transported into cells.
Figure 5.
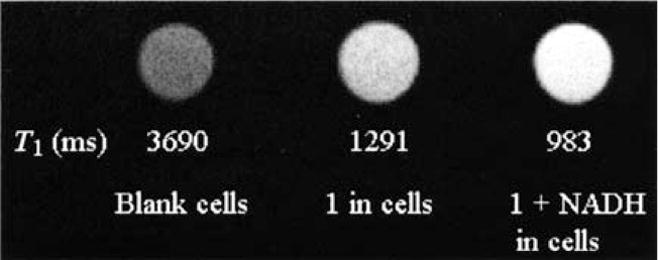
T1-weighted MRI signal-intensity change for the reaction of complex 1 (0.28 mM) and NADH (Gd:NADH =1:1) in P388D1.
In conclusion, this work describes the synthesis and characterization of a reversibly activatable T1-weighted MRI/optical contrast agent 1 which is sensitive to NADH. NADH plays a key role in the energy production of cells and is also an indicator of superoxide levels in living systems. In the dark, 1 in water favors the MC (open) isomer which has strong fluorescence at 539 nm with a quantum yield of 22%. In the presence of NADH, 1 undergoes an isomerization to its SO (closed) isomer. Removal of the phenoxide oxygen atom from the coordination sphere increases the hydration number of GdIII to 2.01 ± 0.05, which leads to an r1 relaxivity increase of 54%, while the strong fluorescence is quenched gradually and disappears in 20 min. After applying hydrogen peroxide to the system, the T1 value is fully restored but the fluorescence is only partially recovered. The complete reversibility of the T1 effect, but only partial recovery of optical properties is currently under study to better understand the reason for this apparent discrepancy. Structural modifications are being studied to “tune” the isomerization efficiencies in each direction.[21] An intensity change is clearly seen in MR and optical imaging in both aqueous solutions and cells in culture; and the agents appear to be transported into cells. Both MC and SO isomers of 1 are non-toxic to cells.
As for all diagnostic probes, one of the greatest barriers to clinical application of activatable probes is localization of the probes to target tissues. For in vivo use it would be ideal to have our agents localize to mitochondria, where the largest pool of NADH resides. The SO form of the probe is neutral and could associate with membranes, but further studies are required to assess mitochondrial transport. If the probes cannot localize to mitochondria they could be directed by targeting sequences. The efficiency of response to NADH and subcellular localization of the probes require further investigation to move towards in vivo applications. Nevertheless, this novel MRI contrast agent 1 has promising potential to respond to NADH related biochemical activities in living systems.
Supplementary Material
Footnotes
This research is supported by the National Institute of Health (RO3 EY13941-01) and NMR award of the University of California, Davis. We thank Dr. Benjamin R. Jarrett for help with cell experiments.
Supporting information for this article (details of compound syntheses and characterization, hydration number and relaxivity assays, cell uptake, and MR/optical imaging procedures) is available on the WWW under http://dx.doi.org/10.1002/anie.200900984.
References
- 1.Hoye AT, Davoren JE, Wipf P, Fink MP, Kagan VE. Acc Chem Res. 2008;41:87 – 97. doi: 10.1021/ar700135m. [DOI] [PubMed] [Google Scholar]
- 2.a) Mankoff DA. J Nucl Med. 2007;48:18N. [PubMed] [Google Scholar]; Mankoff DA. J Nucl Med. 2007;48:21N. [PubMed] [Google Scholar]; b) Cao QZ, Cai WB, Niu G, He LN, Chen XY. Clin Cancer Res. 2008;14:6137 – 6145. doi: 10.1158/1078-0432.CCR-08-0049. [DOI] [PubMed] [Google Scholar]
- 3.Westbrook C, Roth CK, Talbot J. MRI in Practice. 3. Blackwell; Malden: 2005. [Google Scholar]
- 4.a) Jacques V, Desreux JF. Top Curr Chem. 2002;221:123–164. [Google Scholar]; b) Ramos J, Sirisawad M, Miller R, Naumovski L. Mol Cancer Ther. 2006;5:1176–1182. doi: 10.1158/1535-7163.MCT-05-0280. [DOI] [PubMed] [Google Scholar]; c) Hyodo F, Chuang KH, Goloshevsky AG, Sulima A, Griffiths GL, Mitchell JB, Koretsky AP, Krishna MC. J Cereb Blood Flow Metab. 2008;28:1165 – 1174. doi: 10.1038/jcbfm.2008.5. [DOI] [PMC free article] [PubMed] [Google Scholar]
- 5.Hyodo F, Soule BP, Matsumoto KI, Matusmoto S, Cook JA, Hyodo E, Sowers AL, Krishna MC, Mitchell JB. J Pharm Pharmacol. 2008;60:1049 – 1060. doi: 10.1211/jpp.60.8.0011. [DOI] [PMC free article] [PubMed] [Google Scholar]
- 6.a) Zhi J, Baba R, Hashimoto K, Fujishima A. J Photochem Photobiol A. 1995;92:91–97. [Google Scholar]; b) Kimura K, Yamashita T, Yokoyama M. Chem Soc Perkin Trans. 1992;2:613 – 619. [Google Scholar]
- 7.Tu CQ, Louie AY. Chem Commun. 2007:1331–1333. doi: 10.1039/b616991k. [DOI] [PMC free article] [PubMed] [Google Scholar]
- 8.a) Chu NYC. Can J Chem. 1983;61:300–305. [Google Scholar]; b) Yuan W, Sun L, Tang H, Wen Y, Jiang G, Huang W, Jiang L, Song Y, Tian H, Zhu D. Adv Mater. 2005;17:156 – 160. [Google Scholar]
- 9.a) Adam-Vizi V, Chinopoulos C. Trends Pharmacol Sci. 2006;27:639–645. doi: 10.1016/j.tips.2006.10.005. [DOI] [PubMed] [Google Scholar]; b) Forsyth LM, Preuss HG, MacDowell AL, Chiazze L, Birkmayer GD, Bellanti JA. Ann Allergy Asthma Immunol. 1999;82:185–191. doi: 10.1016/S1081-1206(10)62595-1. [DOI] [PubMed] [Google Scholar]; c) Seo BB, Nakamaru-Ogiso E, Flotte TR, Yagi T, Matsuno-Yagi A. Mol Therapy. 2002;6:336–341. doi: 10.1006/mthe.2002.0674. [DOI] [PubMed] [Google Scholar]; d) Nadlinger K, Birkmayer J, Gebauer F, Kunze R. Neuroimmunomodulation. 2001;9:203 – 208. doi: 10.1159/000049027. [DOI] [PubMed] [Google Scholar]
- 10.a) Denk W, Strikler JH, Webb WW. Science. 1990;248:73–76. doi: 10.1126/science.2321027. [DOI] [PubMed] [Google Scholar]; b) Vishwasrao HD, Heikal AA, Kasischke KA, Webb WW. J Biol Chem. 2005;280:25119–25126. doi: 10.1074/jbc.M502475200. [DOI] [PubMed] [Google Scholar]; c) Patterson GH, Knobel SM, Arkhammar P, Thastrup O, Piston DW. Proc Natl Acad Sci USA. 2000;97:5203–5207. doi: 10.1073/pnas.090098797. [DOI] [PMC free article] [PubMed] [Google Scholar]; d) Freeman R, Gill R, Shweky I, Kotler M, Banin U, Willner I. Angew Chem. 2009;121:315–319. doi: 10.1002/anie.200803421. [DOI] [PubMed] [Google Scholar]; Angew Chem Int Ed. 2009;48:309–313. doi: 10.1002/anie.200803421. [DOI] [PubMed] [Google Scholar]
- 11.a) Samat A, Lokshin V, Chamontin K, Levi D, Pepe G, Guglielmetti R. Tetrahedron. 2001;57:7349–7359. [Google Scholar]; b) Dadabhoy A, Faulkner S, Sammes PG. J Chem Soc Perkin Trans. 2002;2:348 – 357. [Google Scholar]
- 12.Zhang ZB, Zhang CR, Fan MG, Yan WP. Dyes Pigm. 2008;77:469 – 473. [Google Scholar]
- 13.a) Kimura K, Yamashita T, Yokoyama M. J Chem Soc Perkin Trans. 1992;2:613–619. [Google Scholar]; b) Liu SH, Wu XY, Wu CT. Acta Chim Sin. 1999;57:1167. [Google Scholar]
- 14.Magde D, Rojas GE, Seybold P. Photochem Photobiol. 1999;70:737 – 744. [Google Scholar]
- 15.Djanashvili K, Peters JA. Contrast Media Mol Imaging. 2007;2:67 – 71. doi: 10.1002/cmmi.132. [DOI] [PubMed] [Google Scholar]
- 16.Alpoim MC, Urbano AM, Geraldes CFGC, Peters JP. J Chem Soc, Dalton Trans. 1992:403–407. [Google Scholar]
- 17.Caravan P, Ellison JJ, McMurry TJ, Lauffer RB. Chem Rev. 1999;99:2293. doi: 10.1021/cr980440x. [DOI] [PubMed] [Google Scholar]
- 18.O’Brien J, Wilson I, Orton T, Pognan F. Eur J Biochem. 2000;267:5421 – 5426. doi: 10.1046/j.1432-1327.2000.01606.x. [DOI] [PubMed] [Google Scholar]
- 19.Koval M, Preiter K, Adles C, Stahl PD, Steinberg TH. Exp Cell Res. 1998;242:265 – 273. doi: 10.1006/excr.1998.4110. [DOI] [PubMed] [Google Scholar]
- 20.a) Klaidman LK, Leung AC, Adams JD. Anal Biochem. 1995;228:312–317. doi: 10.1006/abio.1995.1356. [DOI] [PubMed] [Google Scholar]; b) Merrill DK, Guynn RW. Brain Res. 1981;221:307 – 318. doi: 10.1016/0006-8993(81)90780-0. [DOI] [PubMed] [Google Scholar]
- 21.Tu CQ, Osborne EA, Louie AY. Tetrahedron. 2009;65:1241–1246. doi: 10.1016/j.tet.2008.12.020. [DOI] [PMC free article] [PubMed] [Google Scholar]
Associated Data
This section collects any data citations, data availability statements, or supplementary materials included in this article.


