Abstract
Sepsis, a systemic inflammatory response in the presence of an infection, is characterized by overproduction of inflammatory mediators called cytokines. Removal of these cytokines using an extracorporeal hemoadsorption device is a potential therapy for sepsis. We are developing a cytokine adsorption device (CAD) filled with microporous polymer beads and have previously published a mathematical model which predicts the time course of cytokine removal by the device. The goal of this study was to show that the model can experimentally predict the rate of cytokine capture associated with key design and operational parameters of the CAD. We spiked IL-6, IL-10, and TNF into horse serum and perfused it through an appropriately scaled-down CAD and measured the change in concentration of the cytokines over time. These data were fit to the mathematical model to determine a single model parameter, Γi, which is only a function of the cytokine-polymer interaction and the cytokine effective diffusion coefficient in the porous matrix. We compared Γi values, which by definition should not change between experiments. Our results indicate that the Γi value for a specific cytokine was statistically independent of all other parameters in the model, including initial cytokine concentration, flow rate, serum reservoir volume, CAD size, and bead size. Our results also indicate that competitive adsorption of cytokines and other middle-molecular weight proteins, which is neglected in the model, does not affect the rate of removal of a given cytokine. The model of cytokine capture in the CAD developed in this study will be integrated with a systems model of sepsis to simulate the progression of sepsis in humans and to develop a therapeutic CAD design and intervention protocol that improves patient outcomes in sepsis.
Keywords: Sepsis, hemoadsorption, cytokine, mathematical model
INTRODUCTION
Severe sepsis is an acute inflammatory reaction which arises due to the host response to infection1, resulting in systemic inflammation and organ failure. Up to 750,000 patients are affected annually in the US alone, and over one-third die as a result2. Sepsis is characterized by the redundant release of multiple inflammatory mediators including cytokines into the bloodstream3, 4. Increased expression of pro-inflammatory cytokines such as tumor necrosis factor (TNF) and interleukin-6 (IL-6) and anti-inflammatory cytokines such as interleukin-10 (IL-10) in the circulation is strongly associated with death5.
Although several drug therapies have been developed for the treatment of sepsis via blockage of one or more mediators, they have been ineffective because they cannot attenuate the entire response6-8. One possible solution that would non-selectively lower the concentration of circulating cytokines is hemofiltration. Hemofiltration, the removal of plasma solutes after convective filtration from whole blood in hollow fibers, has been shown to lower cytokine concentrations in septic patients9, 10. Much of the success of using hemofiltration, however, can be attributed to solute adsorption on to the hollow fiber membranes11, and therefore new techniques focus on hemoadsorption in addition to filtration.
We are developing a hemoadsorption device consisting of polymer beads packed in a column through which whole blood is directly perfused. This device has been effective in removing TNF, IL-6, and IL-10, and other middle-molecular weight proteins in both in vitro and ex vivo studies12, 13. We have also developed a mathematical model14 which uses a simple analytic expression to predict the removal rate of cytokines by the hemoadsorption device. The rate of removal depends on one unknown parameter, , where K and are the affinity and capacity of the polymer surface for the cytokine in question, respectively, and Di is the effective diffusion coefficient of the cytokine in the pore structure.
The model we have developed, once validated, will enable us to perform simulations of various experimental scenarios. Eventually this model will be combined with a systems model of sepsis in human patients to evaluate the efficacy of the CAD for various cytokine expression profiles. This method of device design will enable us to develop the most efficient device both quickly and without using costly resources such as cytokines and assay kits. In this paper, we experimentally test the validity of our theoretical model of cytokine capture. As part of our validation, we also justify two key assumptions of the model: 1) that the single parameter gamma is independent of the concentration of the cytokine being captured, and 2) that other adsorbing species do not affect capture of a given cytokine. Our results indicate that the theoretical model predicts cytokine removal well in our hemoadsorption device.
THEORETICAL MODEL
We have previously developed a simple mathematical model14 which uses the following analytic expression to predict the concentration Ci of an individual cytokine i over time, t:
| (1) |
where Q is the volumetric flow rate, Vr is the blood or serum reservoir volume, mb is the mass of beads in the column, R is the radius of beads in the column, and ρ is the density of the polymer. The only unknown parameter in the model is Γi which is specific to cytokine i and its interaction with the bead pore and outer surfaces. By definition,
| (2) |
where Di represents the diffusion coefficient of cytokine i within the beads, is the maximum capacity of cytokine i per unit mass of each bead, and Ki is the affinity constant from the Langmuir equilibrium adsorption isotherm. In the experiments described below, we measure Γi for IL-6, IL-10, and TNF and test that its value is independent of all other experimental parameters.
MATERIALS AND METHODS
The cytokine adsorption device (CAD) consists of a cartridge filled with porous polymer beads. The beads are made up of a polystyrene divinylbenzene (PSDVB) copolymer and covered in a biocompatible polyvinylpyrrolidone (PVP) coating.
General in vitro recirculation experiments
For each recirculation experiment, an unused CAD was packed with fresh polymer and connected in line with a peristaltic pump (Figure 1). The inlet and outlet tubing ports were connected to a reservoir containing 8ml of horse serum or phosphate buffered saline (PBS) spiked with one or more adsorbable proteins. The reservoir fluid was pumped through the CAD at a set flow rate and samples were taken from the reservoir at times t=0, 15, 30, 60, 90, 120, 180, and 240min. Samples were stored at −70°C for subsequent assay using enzyme-linked immunosorbent assay (ELISA). Concentrations of IL-6, IL-10, and TNF were determined using BioSource ELISA kits (Invitrogen, USA) according to the instructions of the manufacturer. The concentration of β2-microglobulin was measured using a Quantikine IVD ELISA kit (R&D Systems, USA), also according to the instructions of the manufacturer.
Figure 1.
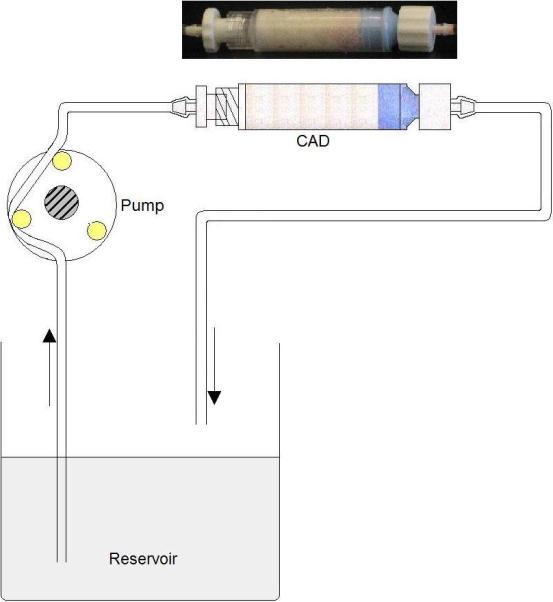
Recirculation loop used to test cytokine removal from cytokine-spiked serum flowing through the CAD.
Experimental validation of theoretical model
Three trials of each model validation experiment described below were performed, and all experimental parameters were set at the baseline values shown in Table 1 unless otherwise specified.
Table 1.
Description of baseline parameters and their values.
| Parameter name | Description | Baseline value |
|---|---|---|
| C0 | Initial concentration of cytokine, pg/ml | 1000 |
| Q | Volumetric flow rate, ml/min | 0.8 |
| R | Average bead radius, μm | 289.1 |
| mb | Mass of beads in cartridge, g | 1.5 |
| Vr | Reservoir volume, ml | 8.0 |
In the first set of experiments, we wanted to test whether the model was able to predict changes in cytokine capture rate associated with changes in the model parameters (Eq. 1), including the initial cytokine concentration in the reservoir, perfusion rate through the cartridge, bead mass in the cartridge, and bead size. To test the effect of initial cytokine concentration, we performed experiments of IL-6 removal using a serum reservoir spiked with either 1000pg/ml or 5000pg/ml, with all other parameters at their baseline values as indicated by Table 1. Typically, cytokine concentrations in septic patients do not exceed 5000 pg/ml. We tested the effect of changes in flow rate by perfusing serum spiked with IL-6 at a flow rate of 0.8ml/min or 0.08ml/min while keeping all other parameters at their baseline values. We chose to validate the model for a flow rate below the baseline value as opposed to above it because capture of IL-6 falls into an intermediate regime between perfusion and diffusion-limited capture. Capture is more dependent on flow rate at lower perfusion rates whereas at high flow rates, capture becomes entirely diffusion limited and independent of flow rate.
To test the effect of increasing bead mass in the CAD, we measured capture of IL-6 from serum using devices containing either 1.5g or 10g of beads. In the case of the 10g device, a reservoir volume of 80ml and a flow rate of 8.0ml/min were used in order to accommodate the larger device. Smaller beads were tested because of the advantage they offer due to their greatly increased surface area and the likelihood that such beads would be included in the final device design. We tested the effect of changes to bead size by performing capture of IL-6 using 289.1μm radius beads and 58.4μm radius beads in the CADs. All other parameters remained at their baseline values.
In the second series of experiments, we tested whether competitive binding effects arise due to the presence of multiple adsorbing species, including other cytokines and middle-molecular weight molecules that can diffuse into the porous beads. β2-microglobulin (β2-m) was chosen as the additional adsorbing species because it is the most abundant middle-molecular weight protein in blood that adsorbs onto the CytoSorb beads. We examined whether the presence of β2-m affected the capture rate of IL-6. We performed recirculation experiments using IL-6 alone or with an additional 1.5μg/ml β2-m spiked into a solution of PBS and 50mg/ml bovine serum albumin (BSA) with all other parameters at baseline. To directly examine interaction effects between key cytokines of interest, we performed simultaneous IL-6, IL-10, and TNF capture from serum with all parameters at their baseline values.
Model fitting and statistical analysis
The concentrations of TNF, IL-6, and IL-10 over time were normalized to the initial concentration of each cytokine. This data was fit to the model by integrating Eq. 1 using Matlab so that the change in the reservoir volume due to sampling could be incorporated. The integration was subject to the constraint that at t=0 normalized concentration is 1. The integrated value of Ci(t) was then fit to the experimental data. The value of Γi found to most closely model cytokine removal for each set of data was obtained via nonlinear regression using Matlab. 95% confidence intervals for both Γi and initial concentration were determined along with the R2 value for each fit. The average Γi value was calculated for each set (n=3) of experiments and compared using a student's t-test.
RESULTS
Varying model parameters
Figure 2 compares IL-6 capture experiments using a serum reservoir spiked with either 1000 or 5000 pg/ml. The average ΓIL–6 values obtained over three trials were 1.05e-4±2.34e-5 and 1.17e-4±3.58e-5 cm2·ml·min−1·g−1 for the low and high concentrations, respectively. There was no significant difference between the average ΓIL–6 values (p=0.63).
Figure 2.
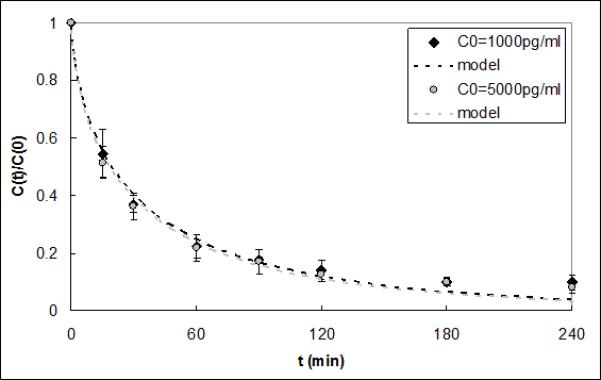
IL-6 capture data and respective model fits for initial concentrations of 1000pg/ml and 5000pg/ml. The model ΓIL-6 fits were 1.05e-4 and 1.17e-4 cm2·ml·min−1·g−1 and were not statistically different (p=0.63).
Figure 3 shows the results of IL-6 capture from serum perfused through the CAD at 0.8ml/min or 0.08ml/min. ΓIL–6 for the lower flow rate was 1.77e-4±1.62e-4 cm2·ml·min−1·g−1 and was not significantly different from that for the baseline flow rate (1.05e-4±2.34e-5 cm2·ml·min−1·g−1, p=0.49).
Figure 3.
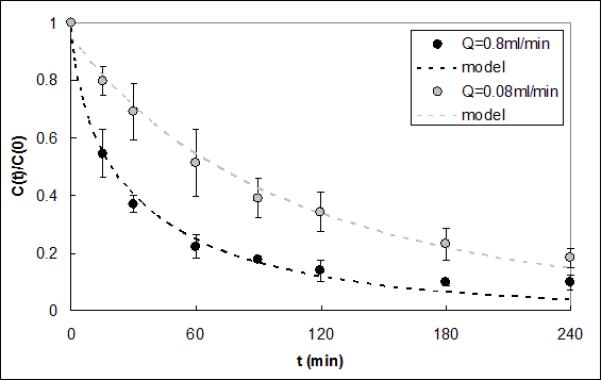
IL-6 capture data and respective model fits for serum flow rates of 0.8ml/min and 0.08ml/min. The model ΓIL-6 fits were 1.05e-4 and 1.77e-4 cm2·ml·min−1·g−1 and were not statistically different (p=0.49).
Figure 4 shows IL-6 capture data from serum obtained using a CAD containing either 1.5g or 10g of beads. Reservoir volume and flow rate were increased proportionally to the increase in bead mass, just as they would be for a full scale-up of the device for use in a clinical setting. The average ΓIL–6 for the larger device was 7.14e-5±4.28e-5 cm2·ml·min−1·g−1, which is not statistically different compared to the value for the smaller device (1.05e-4±2.34e-5 cm2·ml·min−1·g−1, p=0.39). Capture of IL-6 from serum in CADs packed with either 289.1μm or 58.4μm radius CytoSorb beads is shown in Figure 5. The average ΓIL–6 value was 8.14e-5±5.78e-5 cm2·ml·min−1·g−1 for the devices packed with the smaller beads; this value was not significantly different from that obtained with the larger beads (1.05e-4±2.34e-5 cm2·ml·min−1·g−1, p=0.56).
Figure 4.
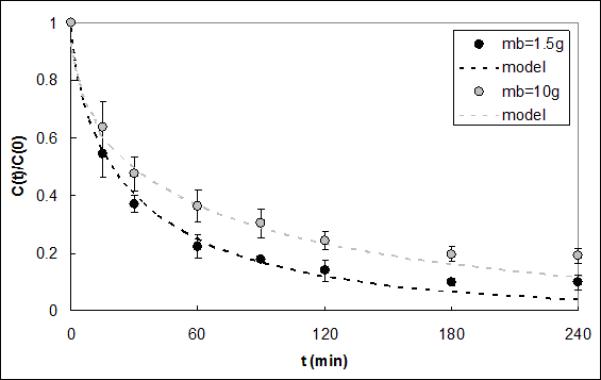
IL-6 capture data and respective model fits for CADs containing 1.5g and 10g of polymer beads. The model ΓIL-6 fits were 1.05e-4 and 7.15e-5 cm2·ml·min−1·g−1 and were not statistically different (p=0.39).
Figure 5.
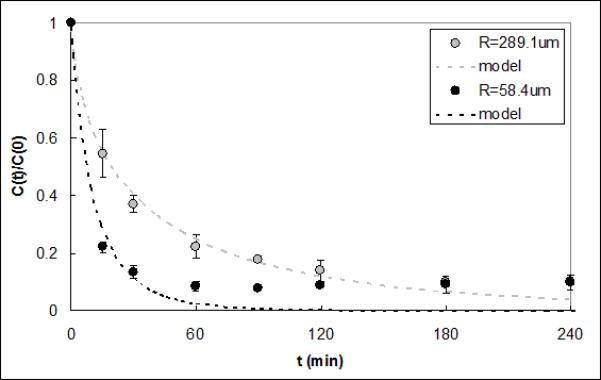
IL-6 capture data and respective model fits for CADs containing 289.1μm and 58.4μm radius polymer beads. The model ΓIL-6 fits were 1.05e-4 and 8.14e-5 cm2·ml·min−1·g−1 and were not statistically different (p=0.56).
Competitive adsorption effects
In Figure 6 capture results are shown for IL-6 in a solution of PBS (pH 7.4) and BSA alone or with 1.5μg/ml β2-m. No statistical difference was found between the average ΓIL–6 values of 9.59e-5±2.11e-5 and 8.75e-5±5.84e-6 cm2·ml·min−1·g−1 for the experiments with and without β2-m, respectively (p=0.29). Figure 6 also shows that despite its relative abundance in the reservoir, β2-m was rapidly removed by the CAD. Cytokine capture experiments were done using serum spiked with TNF, IL-10, and IL-6 alone or in combination (Figure 7). The average Γi values for each cytokine in the multicomponent solution were statistically the same as those of the corresponding cytokine alone in solution. These Γi values are shown in Table 2, along with the Γi values calculated from all of the model validation experiments in this study. P values for the comparison of Γi in single-cytokine and three-cytokine solution for IL-6, IL-10, and TNF were 0.99, 0.15, and 0.99, respectively.
Figure 6.
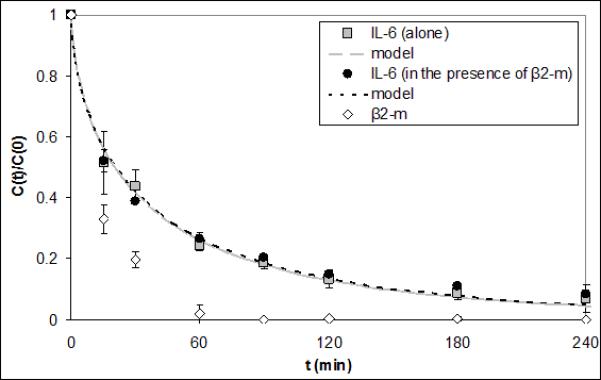
IL-6 capture data and respective model fits for PBS/BSA reservoirs with or without an additional spike of 1.5μg/ml β2-m. The model ΓIL-6 fits were 9.59e-5 and 8.75e-5 cm2·ml·min−1·g−1 and were not statistically different (p=0.29). β2-m capture data is also shown.
Figure 7.
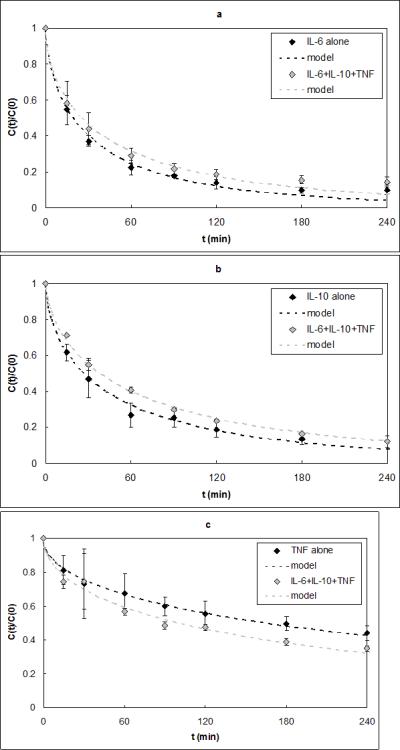
a) IL-6 capture data alone and in a three-cytokine solution. The model ΓIL-6 fits were 1.05e-4 and 6.22e-5 cm2·ml·min−1·g−1 and were not statistically different (p=0.99). b) IL-10 capture data alone and in a three-cytokine solution. The model ΓIL-10 fits were 6.66e-5 and 3.69e-5 cm2·ml·min−1·g−1 and were not statistically different (p=0.15). c) TNF capture data alone and in a three-cytokine solution. The model ΓTNF fits were 5.85e-6 and 9.05e-6 cm2·ml·min−1·g−1 and were not statistically different (p=0.99).
Table 2.
Γi values for baseline and validation experiments.
| Baseline, 1 cytokine | Baseline, 3 cytokines | C0=5000 pg/ml | Q=0.08 ml/min | mb=10g | R=58.4 μm | IL-6 in PBS/BSA | IL-6+β2-m in PBS/BSA | |
|---|---|---|---|---|---|---|---|---|
| ΓIL-6 | 1.05E-4±2.34E-5 | 6.22E-5±1.92E-5 | 1.17E-4±3.58E-5 | 1.77E-4±1.62E-4 | 7.14E-5±4.28E-5 | 8.14E-5±5.78E-5 | 9.59E-5±2.11E-5 | 8.75E-5±5.84E-6 |
| ΓIL-10 | 6.66E-5±2.27E-5 | 3.69E-5±2.04E-6 | ---- | ---- | ---- | ---- | ---- | ---- |
| ΓTNF | 5.85E-6±1.22E-6 | 9.05E-6±4.71E-7 | ---- | ---- | ---- | ---- | ---- | ---- |
DISCUSSION
Sepsis is a complex disease characterized by overproduction of cytokines. Cytokine removal using hemoadsorption has demonstrated in animal models some potential as a treatment for sepsis13, 15. We are developing a cytokine adsorption device (CAD) based on direct blood perfusion through a cartridge containing novel biocompatible, highly adsorbent polymer beads. We previously developed a theoretical model that can be used to predict the time course of removal of cytokines from extracorporeal circulation through the CAD. The primary goal of this study was to demonstrate experimentally that the model can predict the rate of cytokine capture associated with key design variables of the CAD. These include initial cytokine concentration, perfusion rate through the CAD, and the size of the CAD and of its adsorbing beads. Our experiments indicate that over a clinically relevant range of these parameters the single unknown model parameter (Γi), which accounts for the specific interaction of a particular cytokine i with the adsorbent beads, is statistically unaffected by changes in these parameters. The second goal of this study was to demonstrate experimentally that competitive adsorption of solutes, which is neglected in the model, does not affect the rate of removal of a given cytokine. The results indeed indicate that the presence of either multiple cytokines or relatively high concentrations of β2-m had no effect on the capture rate of cytokines.
The development of our simple model of cytokine capture in the CAD was based on a perturbation analysis in which the effects of competitive adsorption of other solutes on cytokine adsorption were predicted to be secondary. We addressed this experimentally in several different ways. First, we compared the removal rates of IL-6, IL-10, and TNF spiked individually into serum to their respective removal rates when spiked collectively into serum. Γi values for each of the three cytokines alone in solution were determined to be statistically the same as Γi values for each cytokine in the multiple cytokine solution. Cytokine levels, however, are relatively small (~1000pg/ml) compared to other middle-molecular weight proteins that can be adsorbed within the beads of the CAD. Accordingly, we also investigated whether the removal rate of cytokines could be affected by the presence of β2-microglobulin (β2-m), which is among the most abundant middle-molecular weight proteins (~1.5μg/ml)16. We compared removal rate of IL-6 spiked individually into a solution of PBS and BSA to its removal rate spiked together with 1.5μg/ml β2-m into the same solution. The ΓIL-6 values in the two solutions were statistically the same. Finally, we can also compare the ΓIL-6 value for IL-6 spiked in PBS/BSA solution with that for IL-6 spiked in serum, which would specifically account for possible effects of all other serum proteins. ΓIL-6 for capture of IL-6 from PBS and BSA was, which was not significantly different from that in serum (9.59e-5 cm2·ml·min−1·g−1 vs. 1.05e-4 cm2·ml·min−1·g−1, respectively, see Table 1).
We chose to validate our mathematical model by fitting values of the cytokine-specific parameter Γi to removal rate data and comparing those fit values for changes to other parameters in the model, as discussed above. A more fundamental way to validate the model would be to measure independently the parameters comprising Γi, which include Di, the effective cytokine diffusion coefficient within the beads, and Ki and , the Langmuir adsorption isotherm parameters. Measurement of these parameters, however, is neither feasible nor practical. Effective diffusion coefficients in polymer matrices are typically measured in a diffusion chamber apparatus in which a cast polymer film separates a solute-containing chamber from an initially solute-free chamber. Our hemoadsorption polymer cannot be cast into films while maintaining the same pore morphology as in bead form. Advanced microscopy techniques based on visualizing diffusion of labeled proteins directly within individual beads17, 18 do not provide Di independent of the Langmuir adsorption parameters. Obtaining the Langmuir adsorption isotherm in order to determine Ki and is not feasible because the amount of cytokine required to reach equilibrium within a measurable amount of bead material is prohibitive.
The model and the experiments did deviate at later time points for the 58.4μm radius beads but not for the 289.1μm radius beads. The deviation occurred only after 90% of IL-6 was removed, and the ΓIL-6 values were statistically the same for both the large and small beads. This discrepancy may be due to diffusion hindrance caused by partial blocking of the bead pores by cytokines which have already adsorbed. If so, the model could use a variable diffusion coefficient that decreases in proportion to the mass of adsorbed cytokine. Several models for a diffusion coefficient decreasing as a function of adsorbed species already exist19, 20. While unlikely to be critical for future applications of the model, studies could be done to incorporate and validate a variable diffusivity.
Our cytokine adsorption device contains a biocompatible polymer and is designed for direct whole blood perfusion. We validated our model using human cytokines spiked into horse serum instead of blood. Our model was developed only to predict the removal rate of cytokines from the plasma phase of blood. Other complexities associated with cytokine release and other interactions with cellular components of blood are incorporated in a systems model of cytokine dynamics in sepsis being developed by our colleagues21. Once validated, our model does apply to blood flow through the CAD provided the flow rate and volume parameters in the model (Eq. 1) are those associated with plasma flow and plasma volume. We are currently evaluating this by performing cytokine capture experiments using red blood cells suspended in a PBS/BSA solution spiked with cytokines. Horse serum was used rather than human serum to avoid the interactions between cytokines and their soluble receptors, which are also accounted for in the systems model of sepsis. The model of cytokine capture in the CAD developed here will be integrated with the systems model of sepsis to simulate the progression of sepsis in humans and to develop a therapeutic CAD intervention protocol that improves patient outcomes in sepsis.
ACKNOWLEDGEMENTS
The work presented in this publication was made possible by Grant Number HL080926-02 from the National Institutes of Health (NIH): National Heart, Lung, and Blood Institute and its contents are solely the responsibility of the authors and do not necessarily represent the official views of the National Heart, Lung, and Blood Institute or NIH. We would also like to recognize the University of Pittsburgh's McGowan Institute for Regenerative Medicine for support on this study.
REFERENCES
- 1.Bone RC, et al. Definitions for sepsis and organ failure and guidelines for the use of innovative therapies in sepsis. The ACCP/SCCM Consensus Conference Committee. American College of Chest Physicians/Society of Critical Care Medicine. Chest. 1992;101(6):1644–1655. doi: 10.1378/chest.101.6.1644. [DOI] [PubMed] [Google Scholar]
- 2.Angus DC, et al. Epidemiology of severe sepsis in the United States: analysis of incidence, outcome, and associated costs of care. Crit Care Med. 2001;29(7):1303–1310. doi: 10.1097/00003246-200107000-00002. [DOI] [PubMed] [Google Scholar]
- 3.Hotchkiss RS, Karl IE. Cytokine blockade in sepsis--Are two better than one? Crit Care Med. 2001;29(3):671–672. doi: 10.1097/00003246-200103000-00040. [DOI] [PubMed] [Google Scholar]
- 4.Cross AS, Opal SM. A new paradigm for the treatment of sepsis: is it time to consider combination therapy? Ann Intern Med. 2003;138(6):502–505. doi: 10.7326/0003-4819-138-6-200303180-00016. [DOI] [PubMed] [Google Scholar]
- 5.Kellum JA, et al. Understanding the Inflammatory Cytokine Response in pneumonia and sepsis. Arch Intern Med. 2007;167(15):1655–1663. doi: 10.1001/archinte.167.15.1655. [DOI] [PMC free article] [PubMed] [Google Scholar]
- 6.Zeni F, et al. Anti-inflammatory therapies to treat sepsis and septic shock: a reassessment. Crit Care Med. 1997;25(7):1095–1100. doi: 10.1097/00003246-199707000-00001. [DOI] [PubMed] [Google Scholar]
- 7.Baue AE. Multiple organ failure, multiple organ dysfunction syndrome, and systemic inflammatory response syndrome. Why no magic bullets? Arch Surg. 1997;132(7):703–707. doi: 10.1001/archsurg.1997.01430310017002. [DOI] [PubMed] [Google Scholar]
- 8.Grau GE, Maennel DN. TNF inhibition and sepsis -- sounding a cautionary note. Nat Med. 1997;3(11):1193–1195. doi: 10.1038/nm1197-1193. [DOI] [PubMed] [Google Scholar]
- 9.Bellomo R, et al. Continuous veno-venous hemofiltration with dialysis removes cytokines from the circulation of septic patients. Crit Care Med. 1993;21(4):522–526. doi: 10.1097/00003246-199304000-00011. [DOI] [PubMed] [Google Scholar]
- 10.Kellum J. Immunomodulation in sepsis: the role of hemofiltration. Minerva Anestesiol. 1999;65(6):410–8. [PubMed] [Google Scholar]
- 11.Kellum JA, Dishart MK. Effect of hemofiltration filter adsorption on circulating IL-6 levels in septic rats. Crit Care. 2002;6:429–433. doi: 10.1186/cc1528. [DOI] [PMC free article] [PubMed] [Google Scholar]
- 12.Song M, et al. Cytokine removal with a novel adsorbent polymer. Blood Purif. 2004;22(5):428–434. doi: 10.1159/000080235. [DOI] [PubMed] [Google Scholar]
- 13.Peng Z, et al. Effects of hemoadsorption on cytokine removal and short-term survival in septic rats. Crit Care Med. 2008;36(5):1573–7. doi: 10.1097/CCM.0b013e318170b9a7. [DOI] [PMC free article] [PubMed] [Google Scholar]
- 14.DiLeo MV, et al. A simple mathematical model of cytokine capture using a hemoadsorption device. Annals of Biomedical Engineering. 2008;37(1):222–229. doi: 10.1007/s10439-008-9587-8. [DOI] [PMC free article] [PubMed] [Google Scholar]
- 15.Kellum JA, et al. Hemoadsorption removes tumor necrosis factor, interleukin-6, and interleukin-10, reduces nuclear factor-kappaB DNA binding, and improves short-term survival in lethal endotoxemia. Crit Care Med. 2004;32(3):801–805. doi: 10.1097/01.ccm.0000114997.39857.69. [DOI] [PubMed] [Google Scholar]
- 16.Berggard I, Bearn AG. Isolation and properties of a low molecular weight beta2-globulin occurring in human biological fluids. J Biol Chem. 1968;243(15):4095–4103. [PubMed] [Google Scholar]
- 17.Lewus RK, Carta G. Protein diffusion in charged polyacrylamide gels. Visualization and analysis. J Chrom A. 1999;865(12):155–68. doi: 10.1016/s0021-9673(99)00862-6. [DOI] [PubMed] [Google Scholar]
- 18.Schroder M, et al. Direct quantification of intraparticle protein diffusion in chromatographic media. J Phys Chem B. 2006;110(3):1429–36. doi: 10.1021/jp0542726. [DOI] [PubMed] [Google Scholar]
- 19.Gutenwik J, et al. Effect of hindered diffusion on the adsorption of proteins in agarose gel using a pore model. J Chrom A. 2004;1048(2):161–72. [PubMed] [Google Scholar]
- 20.Bassingthwaighte JB. A practical extension of hydrodynamic theory of porous transport for hydrophilic solutes. Microcirculation. 2006;13:111–118. doi: 10.1080/10739680500466384. [DOI] [PMC free article] [PubMed] [Google Scholar]
- 21.Daun S, et al. An ensemble of models of the acute inflammatory response to bacterial lipopolysaccharide in rats: results from parameter space reduction. J Theor Biol. 2008;253(4):843–53. doi: 10.1016/j.jtbi.2008.04.033. [DOI] [PubMed] [Google Scholar]


