

Abstract
The biocompatibility of implanted materials and devices is governed by the conformation, orientation, and composition of the layer of proteins that adsorb to the surface of the material immediately upon implantation, so an understanding of this adsorbed protein layer is essential to the rigorous and methodical design of implant materials. In this study, novel molecular dynamics techniques were employed in order to determine the change in free energy for the adsorption of a solvated nine-residue peptide (GGGG-K-GGGG) to a crystalline polylactide surface in an effort to elucidate the fundamental mechanisms that govern protein adsorption. This system, like many others, involves two distinct types of sampling problems: a spatial sampling problem, which arises due to entropic effects creating barriers in the free energy profile, and a conformational sampling problem, which occurs due to barriers in the potential energy landscape. In a two-step process that addresses each sampling problem in turn, the technique of biased replica exchange molecular dynamics was refined and applied in order to overcome these sampling problems and, using the information available at the atomic level of detail afforded by molecular simulation, both quantify and characterize the interactions between the peptide and a relevant biomaterial surface. The results from these simulations predict a fairly strong adsorption response with an adsorption free energy of -2.5 ± 0.6 kcal/mol (mean ±95% confidence interval), with adsorption primarily due to hydrophobic interactions between the nonpolar groups of the peptide and the PLA surface. As part of a larger and ongoing effort involving both simulation and experimental investigations, this work contributes to the goal of transforming the engineering of biomaterials from one dominated by trial-and-error to one which is guided by an atomic-level understanding of the interactions that occur at the tissue-biomaterial interface.
1. Introduction
The biocompatibility of an implanted material is of critical importance in the biomaterials field and determines the appropriateness of the material in a specific device for a specific application with respect to biological response.1-5 The fact that the body responds to even chemically inert, nonbiologically derived implanted materials reveals that there must be some mediator between the biomaterials making up an implanted device and the cells contained in the surrounding tissues and/or body fluids with which they come into contact. However, cells (such as those that trigger an inflammatory response or mediate blood coagulation) do not have receptors that would allow them to sense or react to most synthetic materials; thus, there must be some other component of the system that mediates cellular response. This mediator is, of course, the layer of proteins that rapidly adsorb to an implanted material's surface, and it is the bioactive state of this adsorbed protein layer that governs the subsequent cellular response.6,7
Therefore, if the bioactive state of the adsorbed layer of proteins can be controlled, then cellular response should be able to be controlled and directed to obtain a desired biological response. However, in order to control these interactions, one must first identify and understand them at the molecular level. Without this level of understanding, implant design and cellular response can only be approached by trial-and-error methods. Although much has been learned over the past several decades of protein-adsorption research1,8-11, the diversity of possible biomolecular interactions has hamstrung efforts to develop comprehensive material design models that would enable researchers to predict the required conformation, orientation, and organization of biomaterial surface moieties necessary to achieve a desired bioactivity. New approaches to understand and predict protein adsorption behavior at the molecular level are thus needed.
Over the past few decades, molecular simulation techniques have been developed and used to investigate systems of biological interest, although most of these efforts have been concentrated in areas outside of the biomaterials field, such as protein folding and drug design, rather than protein-surface interactions. Because molecular simulation techniques provide detail at the atomic level, they have the potential to provide insight into the mechanisms of protein-surface interactions in a quantitative and predictive manner. As with their applications to address problems in protein folding and drug design, before they can be used, molecular simulation methods must be specifically developed and validated for application to the problem of understanding and predicting protein adsorption behavior for the biomaterials field.
As part of our research group's efforts to develop molecular simulation methods for application to the problem of protein adsorption, we have previously conducted both experimental12,13 and simulation studies14,15 to address the adsorption behavior of small non-structured peptides on functionalized alkanethiol self-assembled monolayer surfaces (SAMs). While not representing actual biomaterial surfaces that would be used in an implanted device, the functional groups presented by the SAM surfaces (e.g., methyl, hydroxyl, carboxylic acid, amine) are intended to serve as surrogates for the types of functional groups that are presented by implant materials. In this present study, we have extended these methods for the first time to simulate the adsorption behavior of a small peptide (G4-K-G4, using the standard single letter amino acid code16) on a polymer surface that is directly relevant to biomaterials applications, namely poly(L-lactide) or PLA, using molecular dynamics (MD) simulations with the CHARMM molecular simulation package17 and force field18,19. Advanced sampling methods have been developed and applied in these simulations to calculate the adsorption free energy of the peptide on the PLA surface and to generate a Boltzmann-weighted ensemble of states that represent the predicted preferred orientations of this peptide on this type of surface. The results from these simulations predict a fairly strong adsorption response with an adsorption free energy of -2.49 ± 0.52 kcal/mol (mean, ± 95% confidence interval (CI)), with adsorption primarily due to hydrophobic interactions between the nonpolar groups of the peptide and the PLA surface.
2. Model System
2.1. Computational Details
All systems were constructed and simulated using version c31b1 of the academic CHARMM (Chemistry at HARvard Macromolecular Mechanics) program using the CHARMM force field with CMAP correction19. Replica exchange molecular dynamics (REMD) simulations were coordinated using the MMTSB (Multiscale Modeling Tools for Structural Biology) tool set.20 Both the CHARMM and MMTSB source codes were modified in order to add features required to simulate our system.
2.2. Peptide Models
For all simulations, a zwitterionic nine-residue peptide with a primary sequence of GGGG-K-GGGG (G4-K-G4) was used, as shown in Figure 1. The side-chain amino group of lysine (K) was represented in its protonated state (i.e., NH3+) to reflect its primary state in aqueous solution at pH 7.4. In accordance with other simulation14,15 and experimental12,13 work within our group, the peptide represents a host-guest peptide model. In this model, the guest peptide (K) possesses characteristics of specific interest in the simulation. The flanking glycine (G) residues serve to prevent the development of secondary structure due to the nonchiral nature of glycine and to separate the central lysine residue from the zwitterionic end groups of the peptide, thus presenting lysine in a similar manner as it might be presented by an adsorbing protein.
Figure 1.
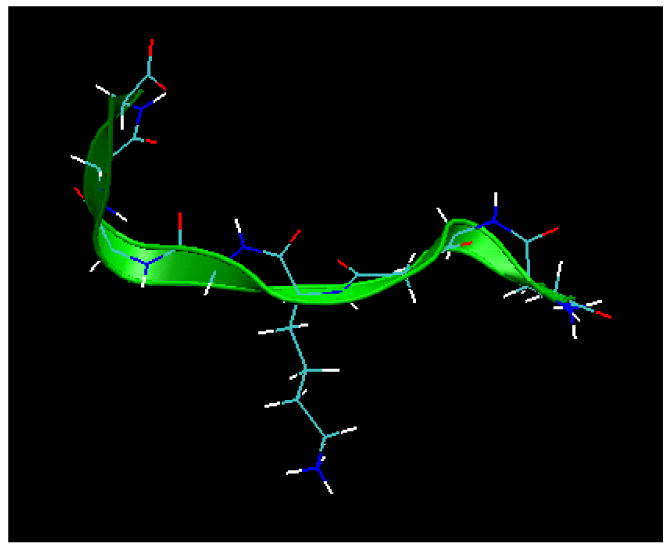
Molecular model21 of the host-guest G4-K-G4 peptide used in all simulations in this study. The green ribbon represents the backbone, and the side chain pointing downward is from the guest residue, lysine.
2.3. PLA Surfaces
As shown in Figure 2, the PLA surface for this adsorption study consists of 18 chains of PLA arranged in three layers of 6 chains each. Periodic boundary conditions, with bonding between real chains and image chains, means that the chains are effectively of infinite length. The crystallographic structure of the PLA surface was taken from the WAXD data presented by Sasaki et al.22 Crystalline PLA consists of an alternating pattern of parallel and anti-parallel chains. The PLA surface was prepared by generating chains along the (012) plane, in which the Miller indices represent chain counts rather than physical dimensions in order to adhere to the integer convention (spacing between the centers of mass of adjacent chains in the same layer is 6.156 Å in the x-dimension and adjacent layers are separated by 5.332 Å in the y-dimension). The (012) plane was chosen because it presents a crystalline polymer surface with the highest surface packing density (i.e., lowest surface free energy) to the solvated peptide, consistent with the expected thermodynamically equilibrated structure.
Figure 2.
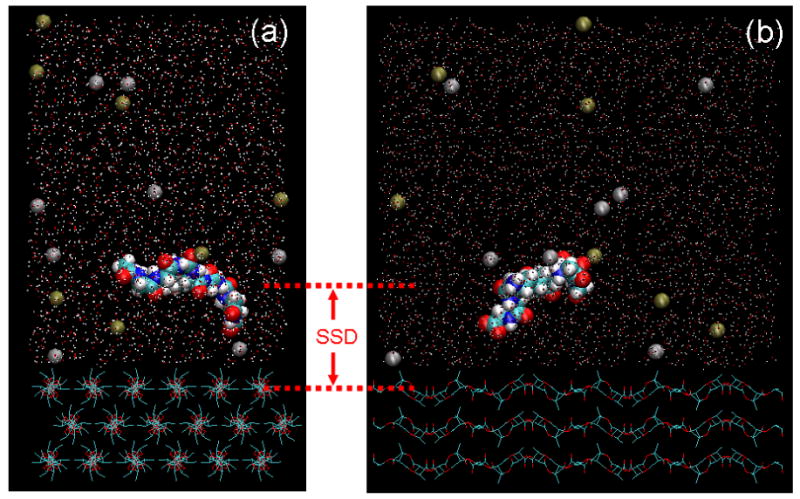
Molecular model21 of the G4-K-G4 peptide over a crystalline PLA surface in 140-mM TIP3P saline prior to simulation. The PLA surface is shown as a wireframe model with hydrogen atoms omitted for clarity; the peptide, Na+, and Cl− ions (silver and gold, respectively) are shown as space-filled atoms with their van der Waals radii; and water molecules are shown as dots. (a) An axial view of the surface polymer chains (view along the z axis). (b) View following 270° rotation about the vertical axis (view along the x axis). Peptide is shown with an SSD value of 15 Å.
PLA parameters23,24 and residue topology descriptions that had been developed for the GROMACS25,26 implementation of the OPLS force field27 were ported into the CHARMM parameter and topology files. The OPLS and CHARMM force fields are both Class I force fields28 with similar functional forms for bonded and non-bonded energy terms, so this conversion consisted primarily of unit conversions and converting the Ryckaert-Bellemans dihedral terms of the OPLS force field to an equivalent sum of periodic cosine terms in CHARMM. In addition to their application in this work, these parameters have also been shown to adequately represent the molecular weight dependency of the glass transition temperature of PLA by Zhang et al.29
2.4. Assembly of Peptide-Surface System
The combined simulation system was constructed stepwise, in the following manner. First, the PLA surface was produced. Then, the water box was created by replicating and translating copies of a box containing 216 TIP3P water molecules (3-site water model)18,30 into a three-dimensional array of the approximate size and then trimming this conglomerate water box to the appropriate size by deleting water molecules whose oxygen atom extended beyond the desired nominal box size. The G4-K-G4 peptide was built with random ϕ and ψ angles (i.e., dihedral angles about the Cα carbon of the amino acid main-chain)16 and translated within the water box, positioning it at a designated height above the polymer layer. This height, or surface separation distance (SSD), is a characteristic feature of all subsequent simulations, and is rigorously defined as the distance between the center of mass of the peptide and the center of mass of the top layer of polymer chains. Next, water molecules that overlapped or were in close contact with the peptide or PLA surface were removed. Specifically, water molecules whose oxygen atom was within 2.2 Å of a heavy (non-hydrogen) atom were deleted. Finally, sodium (Na+) and chloride (Cl-) ions were added to the system by randomly replacing water molecules in order to approximate a 140-mM physiological saline solution while maintaining the specific gravity of the aqueous phase at a value of approximately 1.0. The finished system had dimensions of 36.94 Å × 66.00 Å × 57.76 Å. A model of the system immediately following assembly is presented in Figure 2. Upon completion, the system energy was minimized using the steepest descent algorithm with an initial step size of 0.02 Å for 350 steps.
3. Methods
3.1. Simulation Strategy
The free energy of adsorption (ΔGads) was selected as the best measure with which to characterize and quantify the adsorption of the G4-K-G4 peptide to the PLA surface. Mathematically, equation 1 relates the adsorption free energy to the probability of observing the peptide at a particular distance from the surface (SSD) based on the principles of statistical mechanics and the probability ratio method.31,32
| (1) |
where kB is Boltzmann's constant, T is the absolute temperature, and Pi and P∞ are the probability densities for the peptide being located at SSDi and SSD∞, respectively. SSD∞ is a reference value chosen to represent the probability density for the peptide at a distance sufficiently separated from the PLA surface such that it does not feel any effect from the surface (i.e., representing bulk solution conditions); as shown in the results section, this situation occurs when the SSD is greater than about 20 Å from the surface.
Theoretically, Eqn. 1 provides a straightforward and easily implemented method by which to calculate the change in free energy of adsorption for this system. One can “simply” perform a molecular dynamics (MD) simulation over a suitable length of simulated time, partition the SSD-coordinate space into defined increments (bins), analyze the trajectory to determine the value of the SSD at some appropriate time interval and calculate the relative probabilities of observing the peptide in each of the bins (i.e., at SSDi). In order to use the probability ratio method, a finite (non-zero) estimate of Pi must be obtained for each bin spanning the entire SSD range of interest (approximately 3.5 – 30 Å for this system), so the simulation duration must be sufficient to sample each increment of SSD space a statistically valid number of times.
As shown by Raut et al.14, however, this becomes problematic for strongly adsorbing systems, in which case a conventional MD simulation will tend to result in the peptide quickly adsorbing tightly to the adsorbent surface and remaining in that position for the entire length of the simulation. This creates a severe sampling problem for the system, which prevents values of Pi from being determined over the necessary range of SSD, thus making it impossible to calculate relative adsorption free energy values using Eqn. 1. This sampling problem is illustrated for this present system in Figure 3, which is a plot of SSD versus simulation time for the G4-K-G4 peptide over the PLA surface from a conventional MD run. As clearly shown in this figure, the peptide adsorbs in close proximity to the surface within the first 0.5 ns of the simulation and never escapes the surface to sample SSD space beyond 10 Å for the duration of the simulated time, 10 ns, which is a relatively lengthy simulation. The peptide is basically “stuck” in a low-energy well close to the surface and does not adequately sample any of the relatively high-energy (low-probability) region of space near SSD∞ within this 10 ns of simulation. Figure S.1 and Table S.1 in the Supplemental Information quantify the severity of the SSD sampling problem using a simple Lennard-Jones 12-6 model to describe the interaction between the adsorbed peptide and the surface.
Figure 3.
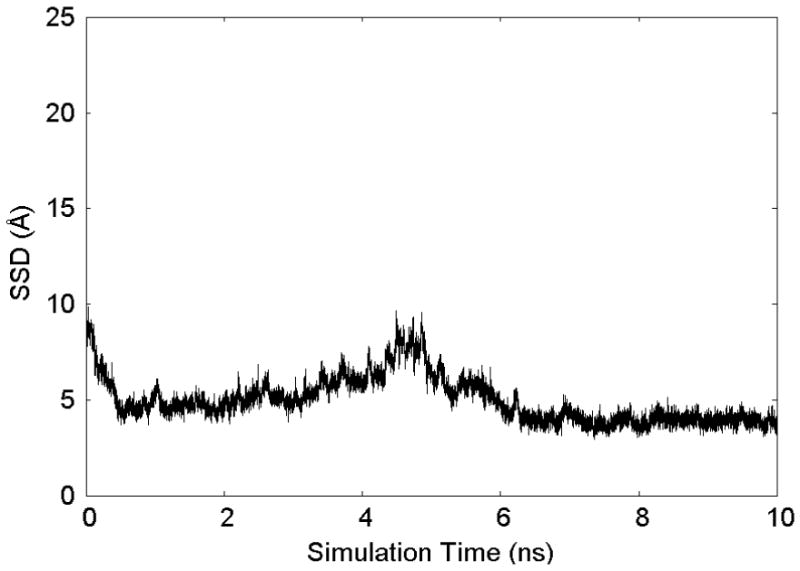
The trajectory of SSD states visited during a conventional MD simulation of the G4-K-G4 peptide over a crystalline PLA surface. The trajectory shows that the peptide is held tightly to the surface, thus providing a serious sampling problem that prevents the use of Eqn. 1 for the calculation of adsorption free energy.
In order to overcome this type of sampling problem, a more sophisticated, advanced sampling algorithm must be applied that will artificially force the system to sample over the entire SSD-coordinate space and then allow the resulting “biased” probability distribution to be corrected back to an unbiased distribution that can then be used to calculate ΔGi at each value of SSDi. In fact, to properly calculate ΔGi for this system, not only must adequate sampling be achieved over the entire SSD-coordinate space, but the simulation must also adequately sample the conformational space of the peptide itself (e.g., sample over the ϕ - ψ dihedral rotations of each amino acid residue of the peptide) at each value of SSDi. In order to achieve this level of sampling, a two-step algorithm called “biased REMD”, which was previously developed by our group15, was further developed and applied to this peptide-PLA adsorption system.
In the first step of this advanced sampling method, a biasing potential in the form of the potential of mean force (PMF)33,34 versus SSD is developed that is subsequently used in an REMD simulation.15 This biasing potential is determined using a windowed umbrella sampling technique35 with SSD as the reaction coordinate. By this method, a restraining potential is added to the force field equation during an otherwise conventional MD simulation to force the peptide to sample the molecular system around designated overlapping regions (i.e., “windows”) of SSD, which are incrementally set to span the full range of desired SSD-coordinate space. For our case, this was accomplished by creating an assembly of 44 independent models of the peptide-PLA system with the peptide positioned at SSD values ranging from 3.5 to 25.0 Å in 0.5-Å increments over the PLA surface. MD simulations were then performed for each system with the position of the peptide restrained by an umbrella potential of the form of
| (2) |
in which Vumb is the biasing energy that is added to the force field equation to penalize the peptide for moving away from the designated reference position (SSDref) during the simulation, kumb is the force (or spring) constant, and SSD(t) is the surface separation distance of the peptide at time t during the MD simulation. Judicious choice of kumb enables adjacent windows to have overlapping distributions of SSD sampling, which is important for reconstructing the unbiased probability distribution over the full range of SSD-coordinate space from the combined results of the simulations. For completeness, these distributions are presented in Figure S.2 of the Supplemental Information. Accordingly, after the umbrella-biased MD simulations are completed, the sampling obtained in each window is corrected to remove the effects of the applied umbrella potential to get a relative probability distribution for the sampled region of SSD space. These relative probability distributions are then combined to develop a complete probability distribution profile over the full range of SSD by iterating the free energy shift for each bin and the current best estimate of the unbiased probability until self-consistency is obtained. An initial estimate of the PMF profile, which is equivalent to ΔGi, is then calculated over the full range of SSD space using the Weighted Histogram Analysis Method (WHAM)36,37.
As noted above, an accurate calculation of ΔGi requires that adequate sampling be achieved over both the SSD-coordinate space as well as the conformational space of the peptide itself. The WHAM analysis from the windowed umbrella sampling method, however, only ensures adequate sampling of SSD space, but not necessarily the conformational space of the peptide. In fact, for a strongly interacting peptide-surface system (ΔGi less than about -2.5 kcal/mol), the estimate of the PMF obtained from umbrella sampling simulations will underestimate the true PMF (i.e., be less negative) because of inadequate sampling of the peptide itself during these simulations. This can be expected to occur if sufficient sampling of some of the favorable (i.e., lower free energy) conformations of the peptide over the surface was kinetically unfavorable during the umbrella simulations. In order to sample these important conformations, the replica exchange molecular dynamics (REMD) advanced sampling method was applied38, which uses temperature to facilitate the crossing of activation energy barriers within a molecular system to enable the conformational space of a system to be more thoroughly sampled within a given simulated time.
In REMD simulations, multiple systems are simulated, not with a coordinated series of sequentially increasing SSD values, but, rather, with a coordinated series of sequentially increasing temperatures. During the simulation, these different systems (called replicas) are allowed to swap temperature levels with adjacent replicas (those directly above or below it in the temperature “ladder”) if their respective potential energies satisfy a Metropolis criterion that is chosen such that canonical, Boltzmann sampling is maintained at each temperature level.38 Accordingly, low-energy conformational states that are explored by the enhanced sampling at elevated temperatures (where activation energy barriers are more rapidly crossed) are exchanged down the temperature ladder to populate the baseline temperature level of interest, while conformations trapped in relatively high energy states are exchanged up the temperature ladder to the higher temperature levels where they can escape. Although conformational sampling is significantly improved by this method, previous work by our group15 has indicated that the replica exchange technique alone is insufficient to overcome the SSD-sampling problem for peptide-surface interactions. This is because REMD is useful for sampling states with similar free energy values that are separated by relatively high activation energy barriers, as in the case of peptide conformational sampling, but not for sampling states with relatively large differences in free energy, as is the case for the SSD sampling problem.
To address this combined sampling problem, we performed a biased REMD simulation15. The bias is an additional potential energy term added to the force field of the MD simulation (similar to the concept used for umbrella sampling), which is chosen to improve sampling of SSD space by counteracting the free energy driving force that would otherwise tend to trap the peptide near the PLA surface. Mathematically, the biased probability densities are related to the unbiased probability densities as
| (3) |
where ΔBi is the bias potential and P̅i and P̅∞ represent the resulting biased probability densities at SSDi and SSD∞, respectively. As is clearly shown in Eqn. 3, if ΔBi was selected in a manner to exactly counter the free energy profile (i.e., ΔBi = −ΔGi), the biased probability ratio would be equal to 1.0, thus representing a situation where the peptide is equally probable at every position SSDi; thereby, eliminating the SSD sampling problem. It is not actually necessary to exactly match the free energy profile, but only to approximate it to a sufficient degree to enable the entire range of SSD-coordinate space to be sampled within a practical time frame. That is, the bias potential should be within about 2 kBT (or about 1 kcal/mol for our simulations) of the free energy profile, so that no barriers remain which cannot be crossed in a biased MD simulation of reasonable duration. As shown in the right-most expression in Eqn. 3, the unbiased probability density distribution can then be readily retrieved from the biased probability density distribution that is obtained during a simulation simply by multiplying it by the exponential of the ratio of the applied biased energy function to kBT. Although not known a priori, a good initial estimate of the biased energy profile is provided by the PMF profile that is generated from the umbrella sampling simulations that are discussed above, and, as addressed in the results section, this profile can be adapted to correct for further sampling problems that might arise during the biased REMD simulations.
For computational reasons, it is desirable to find a continuous and differentiable analytical representation for the bias potential so that it can be directly included in the force field equation that is used in an REMD simulation. Given the physical nature of the interactions that control adsorption processes (i.e., Coulombic and van der Waals interactions, which can be represented by a Lennard-Jones (LJ) 12-6 potential39), and the general shape of the PMF versus SSD profile obtained from the umbrella sampling simulations for this and other systems, a functional form inspired by DLVO (Derjaguin, Landau, Verwey, and Overbeek) theory15,40,41 was chosen to be fit to the PMF profile data. Specifically, the following functional form for the bias energy was applied:
| (4) |
where VDLVO represents an estimate of the free energy versus SSD profile, VB is the biasing energy function that will be added to the potential for the biased REMD simulation (e.g., VB = Bi in Eqn. 3), and the Ci's are parameters. The first term on the right-hand side of Eqn. 4 is recognizable as the Coulombic interaction, and the second and third terms represent, respectively, the attractive and repulsive contribution of an LJ 12-6 potential. The constants C4 and C5 enable the function to be shifted along the free energy SSD axes, respectively, which allows for greater flexibility in adjusting the fit, particularly near the minimum-energy (most probable) region of the curve. Accordingly, the adjustable parameters in Eqn. 4 were determined from the PMF profile obtained from the umbrella-sampling simulation by least-squares regression, and the negative of this potential was then used as the initial guess for the bias potential for subsequent biased REMD simulations. This combined sampling method provides the capability to adequately sample over both the SSD-coordinate space and the conformational space of the peptide during the same simulation to obtain an accurate determination of the free energy versus SSD profile for the specified peptide-surface system.
As a final step to control sampling, it must be realized that the use of periodic boundary conditions creates a situation where the bottom of the PLA surface interacts with atoms at the top of the simulation cell. Thus, if not restrained, the peptide is just as likely to become trapped at the top of the water box (i.e., adsorbed to the bottom of an image of the PLA surface) as it is to adsorb to the upper surface of the primary PLA representation at the bottom of the simulation cell. To prevent this from occurring, an additional term was included in the bias potential, a one-sided harmonic (half-umbrella) potential, Vhalf, in the form of
| (5) |
where SSD′ represents the SSD position where the bias potential begins to influence the simulation and khalf is the spring constant. By setting SSD′ to 30 Å and khalf to a large value (1000 kcal mol-1 Å-2), this function effectively acts as a barrier to keep the peptide from sampling the region of SSD space more distant than 30 Å above the surface, preventing it from adsorbing to the bottom surface of the PLA at an SSD value of approximately 50 Å.
3.2. Simulation Details
Both umbrella sampling and REMD simulations employed the RATTLE (velocity SHAKE) algorithm42,43 to constrain bonds involving a hydrogen atom, allowing a 2-fs time step to be used. Long-range non-bonded interactions were handled identically in all simulations; particle mesh Ewald (PME) was used for electrostatics and van der Waals interactions were modeled using an LJ 12-6 potential with a group-based switching method (switching begins at 10 and ends at 12 Å). The SSD value and all energy terms were saved every 100 steps for later analysis.
Each of the 44 systems prepared for the umbrella sampling simulations was equilibrated in the isothermal-isobaric (NPT) ensemble using the VV2 integrator (an implementation of the velocity Verlet algorithm)44,45 and Anderson-Hoover equations for temperature and pressure control, with target temperature of 300 K and a thermostat time constant 0.1 ps, and a target pressure of 1 atm and barostat time constant of 0.2 ps. Equilibration was carried out for 1 ns of simulation time, during which the umbrella force constant was 2000 kcal mol−1 Å−2 in order to strictly control the position of the peptide prior to beginning the production phase of umbrella sampling simulations. The production phase was performed for 1 ns in the canonical (NVT) ensemble with the VV2 integrator and the Nosé-Hoover equations46,47 for temperature control at a target temperature of 300 K and time constant of 0.1 ps. The umbrella force constant was 20 kcal mol−1 Å−2 during the production simulations.
The REMD simulations were performed with 24 replicas spanning a temperature range from 300 – 400 K. The temperature levels were selected according to a modified geometric distribution, determined in a method similar to that suggested by the works of de Pablo48. For 24 replicas spanning a 100-K range, this adjustment did not change any temperature by more than 1.25 K as compared to a standard geometric temperature distribution. The actual temperature levels and resulting acceptance ratios are provided Table S.2 in the Supplemental Information for this paper.
The REMD simulations were also performed in the canonical ensemble with a Nosé-Hoover thermostat. However, in order to better maintain the crystalline structure of the PLA surface at all temperatures, the surface was coupled independently to a 300-K temperature bath for all replicas. The replicas were created with different nominal SSD values, evenly distributed between 6 and 25 Å in order to seed the simulated system and hasten the convergence of the simulation. All replicas were generated by using steepest descent minimization to reposition the peptide within the system that was used during the 15-Å umbrella sampling window simulation. These replicas were then arbitrarily assigned to different temperatures according to the methods of the MMTSB tool kit. Equilibration (molecular dynamics with no attempted exchanges) was performed for 100 exchange cycles prior to beginning the production run. During both equilibration and production, replica exchanges were attempted every 500 time steps (1-ps exchange cycles).
3.3. Analysis of Simulation Results
The biased REMD simulation provides a set of configurational states of the peptide over the PLA surface, each with an associated SSD value. In order to translate this into a biased probability density distribution (i.e., P̅i/P̅∞), the SSD range was divided into 0.5-Å bins and each sampled configurational state was assigned to the appropriate bin. The biased occupation probability (Ai) for each bin was then calculated as
| (6) |
where fi is the observed frequency of each bin (i.e., the quantity of SSD values that were recorded in that 0.5-Å range), and the sums are performed over all N + M bins, of which M of them (in the range of 23 ≤ SSDi ≤ 30 Å) are used in the evaluation of P∞, with the remaining N bins composing the remainder of the SSD range that was examined. The normalized biased probability density (P̅i) was then calculated by dividing each occupation probability by its respective bin width (wi), as
| (7) |
The probability density far from the surface, P̅∞, was defined from the average value of P̅i over the range of 23 Å ≤ SSDi ≤ 30 Å. Once the biased probability density distribution was determined, the unbiased probability distribution and the resulting distribution of ΔGi versus SSDi were determined by Eqns. 3 and 1, respectively.
While the ΔGi versus SSDi relationship provides a very interesting theoretical profile of how the peptide is attracted to the surface as a function of its distance over the surface, experimental studies to measure peptide adsorption behavior generally only provide a single scalar parameter to characterize the adsorption behavior, namely the standard state adsorption free energy (ΔGoads), with13
| (8) |
where R is the ideal gas constant (used in place of kB here to provide units of energy/mole as opposed to energy per molecule), and Cb, Cs, and Co represent concentrations of the peptide in the bulk solution, adsorbed to the surface, and under ideal standard state conditions, respectively. The standard state concentration cancels out of this equation, making ΔGoads independent of the standard state of the system.
The concentration of a peptide in bulk solution (Cb) and at a surface (Cs) can be expressed as
| (9a) |
| (9b) |
Calculating the required ratio in Eqn. 8 yields
| (10) |
Thus,
| (11) |
The choice of N in Eqns. 9 – 11 is not arbitrary, but instead is integral to the definition of Cs. Experimentally, the surface concentration (Cs) is related to the mass of the layer of adsorbed peptide.13 To represent this in the simulations, we determine from the simulation results the region of SSD over which the probability density of the peptide (Pi) exceeds the value of the probability density of the peptide in the bulk solution (P∞). Then by summing up the probability density over this range of SSD (i.e., ΔSSD) and dividing by N (with N = ΔSSD/wi), we calculate the average probability density of the peptide in the adsorbed layer, which we use to represent the surface concentration, Cs, in Eqn. 9b. Using these relationships, the biased probability density distribution obtained from the simulations was translated into the unbiased probability distribution using Eqn. 3. The unbiased probability density distribution was then used to calculate an overall standard state adsorption free energy value from the simulation results using Eqn. 11, which should be directly comparable to experimentally determined values of adsorption free energy for this peptide-surface system.
4. Results and Discussion
4.1. Umbrella Sampling Simulations
An estimate of the PMF obtained from subjecting the umbrella sampling simulation results to WHAM analysis is presented in Figure 4. Also shown is the best-fit DLVO equation (Eqn. 4) from least-squares regression analysis. Qualitatively, the results from the umbrella sampling simulations were in accordance with expectations based upon similar experimental and simulation work examining the G4-K-G4 peptide over hydrophobic SAM surfaces12. Also, as Figure 4 indicates, the peptide has favorable interactions (high sampling probabilities) in the SSD range from approximately 4 – 7 Å.
Figure 4.
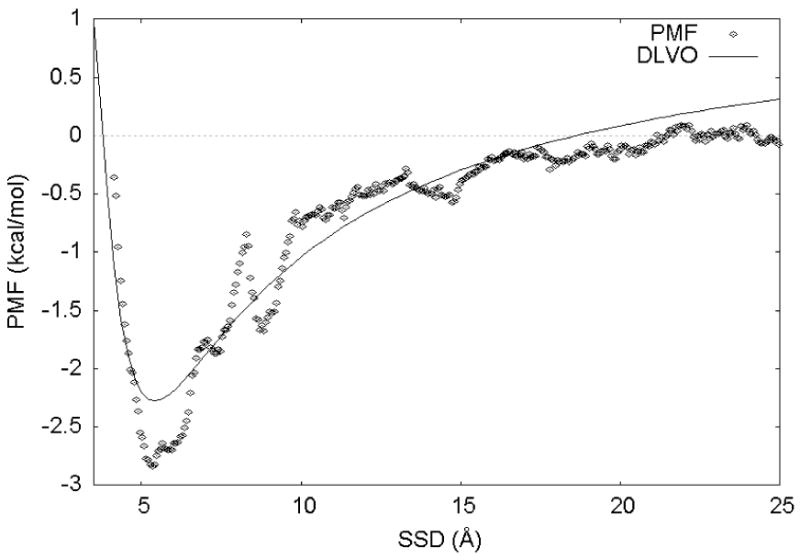
Potential of mean force (PMF; individual points) and best-fit DLVO function (solid line) for the data obtained from WHAM analysis of the umbrella sampling simulations of the G4-K-G4 peptide over a crystalline PLA surface.
4.2. Biased REMD Simulations
As indicated by Eqn. 3, if the applied bias potential perfectly countered the underlying adsorption free energy profile (i.e., ΔBi = −ΔGi), uniform sampling over the entire SSD range should be obtained. As clearly shown by Run 1 in Figure 5, the initial bias potential estimated from the umbrella sampling simulations did not totally offset the underlying free energy profile, allowing the peptide to continue its preferential sampling of the low-energy SSD range (SSD values of 4 – 10 Å), although the full range of SSD-coordinate space was still sampled during the simulation. This behavior should be expected because of the relatively limited conformational sampling of the peptide that is obtained by the umbrella sampling process at 300 K from which the bias potential was obtained. In an attempt to correct this problem, the initial biased REMD simulation was discontinued after 7.4 ns, and a new biasing energy function was obtained by least-squares regression analysis of the PMF versus SSD profile obtained from this REMD simulation. With this new bias potential, which should better counter the underlying free energy profile, a second biased REMD simulation was begun and allowed to run for another 8.5 ns. As shown by Run 2 in Figure 5, this time the bias potential overcompensated for the free energy of adsorption near the surface, which resulted in a situation where the opposite sampling problem occurred; i.e., the low SSD region was now less densely sampled than the high SSD region. Fortunately, the probability density distributions of these two independent biased REMD runs covered the SSD space to a sufficient degree that the biased probability density distributions from both of these simulations could be translated into unbiased probability distributions using Eqn. 3, as shown in Fig. 6.
Figure 5.
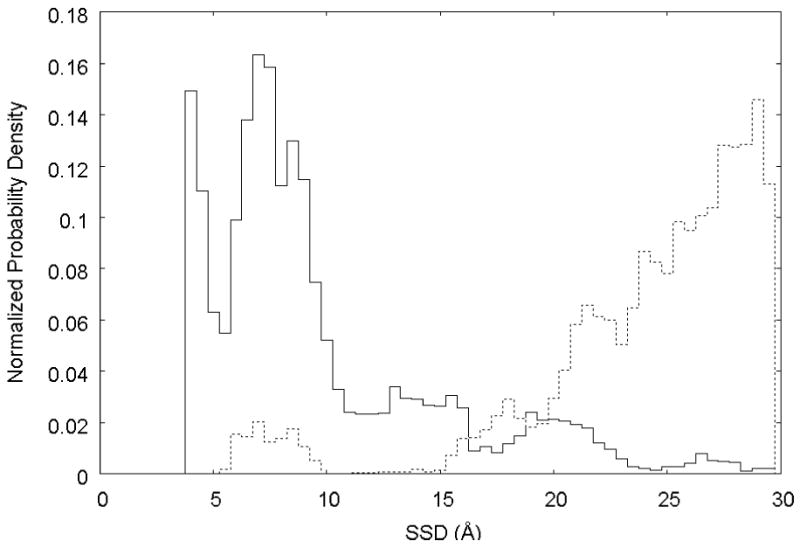
Normalized probability density distributions from the two independent estimates obtained from biased REMD simulations. Run 1 (—): bias potential based upon umbrella simulations; Run 2 (…): bias potential based upon results from Run 1.
Figure 6.
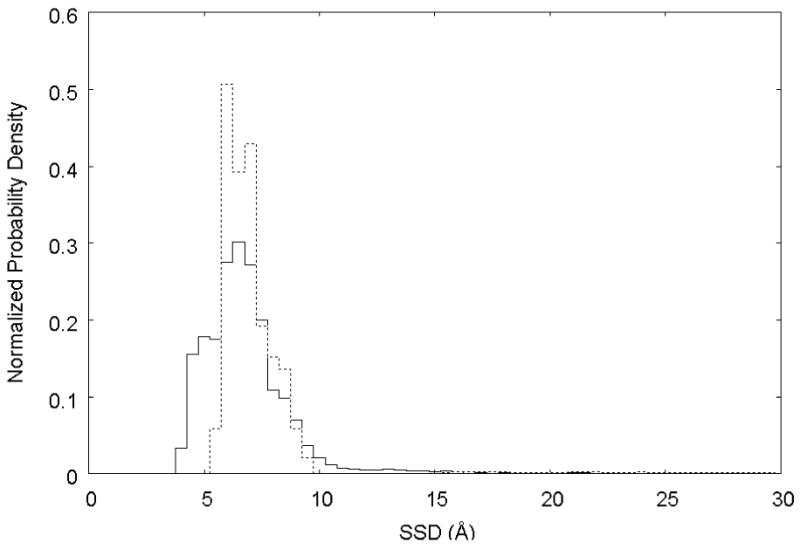
Normalized unbiased probability density distributions from the two independent biased REMD simulations. Run 1 (—): bias potential based on umbrella simulations; Run 2 (…): bias potential based on results from Run 1.
The unbiased probability density distributions from the two biased REMD simulations were combined and Eqn. 1 was then used to calculate the relative free energy versus SSD profile over the full range of SSD as shown in Fig. 7. As shown in this figure, the depth of the potential energy well predicted for this system is about 3.7 kcal/mol, which is about 6 kBT for our 300 K simulations. Given this condition, it is not surprising that a conventional MD simulation of this system results in a serious sampling problem with the peptide being trapped at the surface (see Fig. 3), thus requiring advanced sampling methods to be applied to enable the adsorption free energy to be determined.
Figure 7.
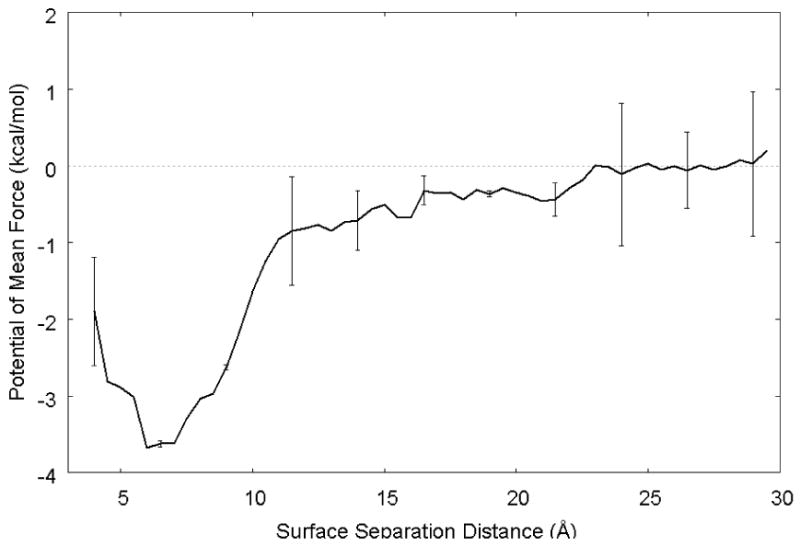
Potential of mean force for the adsorption of the G4-K-G4 peptide over a crystalline PLA surface calculated as the average of the independent biased-REMD simulations. Error bars for selected regions of the curve represent 95% confidence intervals, which were obtained by block averaging the first 7.4 ns biased energy simulation run into two separate samples sets, with the final 8.5 ns biased REMD simulation run providing a third sample set.
Referring back to Eqns. 9 – 11, in order to calculate ΔGoads for our system, we need to first identify the SSD locations that define the beginning and the end of adsorbed layer of peptide. Referring to the unbiased probability distributions shown in Fig. 6, the adsorbed layer is clearly seen to begin at a value of SSD in the range of about 4 to 5 Å. The end of the adsorbed layer, on the other hand, is not so easily recognized from this figure. However, the free energy plot shown in Fig. 7 indicates that the adsorbed layer can be considered to stop at an SSD value of about 23 Å. Based on these values and the data plotted in Fig. 6, Eqn. 11 was used to calculate an overall standard state adsorption free energy of ΔGoads = −2.5 ± 0.6 kcal/mol (mean ± 95% CI). While the selection of the parameter “N” can only be made by inspection of the simulation results (within the constraints of the physical dimensions of the system), it should be noted that the value of ΔGoads is actually fairly insensitive to this parameter because of the natural log functional form of Eqn. 11 and, as clearly shown in Fig. 6, the probability density is highly concentrated between the SSD region from 4 – 15 Å with relatively little contribution over the range of SSD from 15 Å and greater. Analysis of the influence of this parameter shows that the value of ΔGoads changes less than 0.2 kcal/mol for values of N corresponding to ±5 Å about the selected location of the SSD value that corresponds to P∞ (23 Å), thus providing confidence in the robustness of this method for calculating an adsorption free energy.
Although experimental data are not available for direct comparison with this calculated value, ΔGoads has been experimentally measured for the adsorption of similarly sized host-guest peptides with a sequence of TGTG-X-GTGT on CH3- and OH-functionalized alkanethiol self-assembled monolayer (SAM) surfaces, with the guest (X) amino acid represented by nonpolar valine (X=V), negatively charged aspartic acid (X=D), and threonine (X=T), with mixed nonpolar and polar functional groups.13 Based on water contact angle (CA) measurements (CA = 110° and 16° for CH3- and OH-SAMs, respectively)13, these two surfaces should generally be expected to be more strongly adsorbing and more weakly adsorbing, respectively, compared to PLA (CA = 77°)49,50. The experimental results for ΔGoads from these studies ranged from -4.4 to -2.8 kcal/mol for the CH3-SAM surface and approximately 0.0 kcal/mol for the OH-SAM surface. Based on these results, our calculated value for the adsorption of a G4-K-G4 peptide on a PLA surface appears to be quite reasonable.
4.3. Peptide Conformational Behavior
In addition to providing a method to generate a profile of ΔGi versus SSD and to calculate an overall value of ΔGoads for comparison with experimental values, the simulation results are extremely useful in providing a theoretical assessment of the conformational behavior of the peptide as it interacts with the surface when adsorbing.
The conformational behavior of the peptide itself is best characterized by looking at Ramachandran plots16,51 of the ϕ, ψ dihedral angles of the backbone chain of the amino acid residues making up the peptide. Figure 8 presents Ramachandran plots for the lysine residue obtained from the biased REMD simulations (Fig. 8b) in comparison to the Ramachandran plot for the 4,153 lysine residues from the 500-structure, high-resolution database of Lovell et al. (Fig. 8a),52 which serves to characterize the typical conformational behavior of this amino acid when part of a protein. In Figure 8a, the cluster of points in the lower left quadrant represents the conformation adopted by residues in a right-handed α-helix, those points in the upper right a left-handed α-helix, and those points in the upper left represent a β-strand conformation.16 In comparison, the biased REMD simulations show that all three of these regions were conformationally sampled during the simulations, with an obvious weighting of the right-handed α-helix and β-strand conformations. To assess whether or not the use of REMD was really necessary to address the presumed peptide conformational sampling in addition to using the initial biased energy function to address the SSD sampling problem, two separate simulations were also conducted using the biased energy function within a conventional MD simulation (i.e., not REMD). Plots of SSD versus simulation time confirm that the SSD sampling problem has been overcome by the application of the bias potential, and appear in Figure S.3 in the Supplemental Information. One of these simulations was started with the peptide in a β-strand conformation and the other was started in a right-handed α-helix conformation. The conformational sampling results of these two simulations are presented in the Ramachandran plots shown in Figs. 8c and 8d, respectively. As clearly shown from these simulations, in each case the peptide was trapped in its local conformational basin, thus, representing a conformational sampling problem that would translate into an error in the calculation of ΔGi versus SSD and ΔGoads. Similar behavior was found for the glycine residues. This conformational trapping was also observed for the umbrella simulations in all windows and is the reason why the final free energy profile from the biased REMD simulations resulted in a deeper energy well (Fig. 7) than was provided by the umbrella sampling simulation results (Fig.4).
Figure 8.

Ramachandran plots for (a) the 4153 lysine residues from the 500-structure, high-resolution database of Lovell et al52, for comparison with (b) biased REMD simulations, (c) and (d) two independent biased MD simulations.
Previously, the adsorption of the G4-K-G4 peptide to the PLA surface has been discussed in the context of hydrophobic interactions. In addition to quantifying the strength of these interactions, it is instructive to use the information available from biased REMD simulation to analyze the nature of these interactions at the atomic level. When the peptide is interacting with the surface most strongly (i.e., it is adsorbed), the residues that provide the greatest contribution to adsorption are the N-terminal glycine residue and the 3 glycine residues between the N-terminus and the lysine residue. This can be observed by examining the trajectory directly, and may also be seen in Figure 9, which plots the average SSD of each individual residue (defined analogously to the overall SSD previously used) obtained from structures having an SSD value that lies within 0.5 Å of the approximate minimum energy SSD value of 6.5 Å for each of the independent REMD simulations. Also presented in Figure 9 is the SSD value calculated for the heavy (non-hydrogen) atom that is closest to the surface. When examined in this manner, the peptide appears to adopt a type of “ω” shape, with the interior glycine residues interacting the most closely with the PLA surface, while the charged residues tend to interact less strongly, or at a greater distance.
Figure 9.
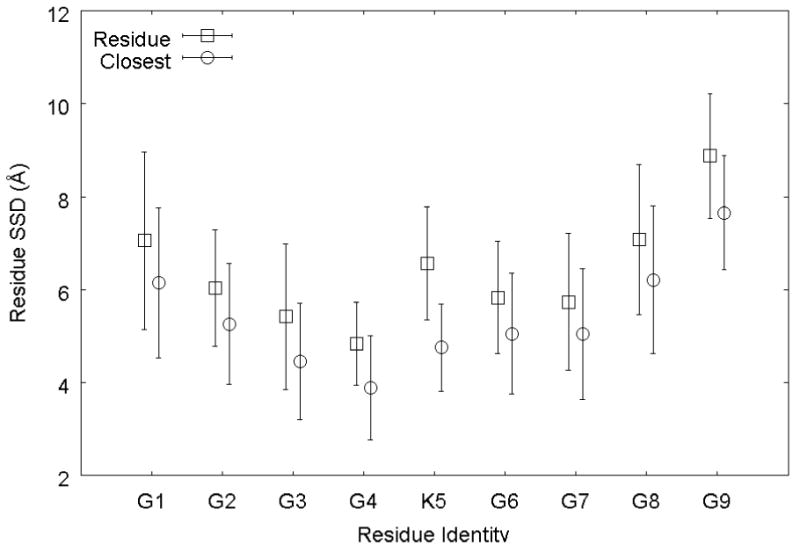
Average residue SSD (squares) and SSD of the heavy atom closest to the surface (circles) from structures with an overall SSD value of 6 – 7 Å, calculated from the biased REMD simulations. Residue G1 is the N-terminus and G9 is the C-terminus. Error bars represent 95% confidence intervals
Figure 10 provides a “snapshot” from the ensemble of states generated during biased REMD simulation in order to better visualize the interactions between functional groups that are responsible for the adsorption behavior of the G4-K-G4 peptide over the PLA surface. This snapshot was selected because it is the one most like the average structure presented in Fig. 9, as determined by least-squares error analysis. Figure 10a is entirely analogous to Fig. 2, but after approximately 0.5 ns of REMD simulation time. Figures 10b and 10c contain close up views of the entire peptide and the guest residue (K), respectively, for easier examination.
Figure 10.

Molecular model21 of the G4-K-G4 peptide over a crystalline PLA surface in 140-mM TIP3P saline solution following approximately 0.5 ns of REMD simulation, at a conformation that is consistent with the depiction in Fig. 2. (a) Overview of the full system; (b) A close up view rotated about the y axis demonstrating the adsorbed conformation; (c) A close up view of the lysine residue (space-filling representation), with the peptide backbone presented as a ribbon so as to not obscure the view of the guest residue.
The N-terminal glycine residue (G1) tends to behave, not merely as a generically hydrophobic residue (like residues G2, G3, G4, G6, G7, and G8), but rather in one of two distinct modes. In the first mode, the positively charged amine group remains solvated, which prevents it from closely associating with the surface. In the second, the same amine group manages to (usually briefly) penetrate the hydrophobic methyl groups of the PLA and form hydrogen bonds with the oxygen atoms in the interior of each polymer chain; thus, interacting directly with the surface.
It can be seen that the negatively charged C-terminus tends to remain solvated, with an average residue SSD approximately 2.4 Å greater than that of the peptide as a whole (this distance is significantly greater than zero, with p < 0.05). This effect is strong enough that it is able to pull the glycine residues on its end (residues G6, G7, and G8) away from the surface, when compared to the corresponding residues on the opposite end of the peptide (residues G2, G3, and G4) as evidenced by a difference of 2.3 Å in the average SSD value for each group (the difference between the average of residues 2, 3, and 4 and the average of residues 6, 7, and 8 is significantly different from zero, with p < 0.05). The behavior of the lysine residue (K5 in Fig. 9) also contributes to this asymmetry. On average, the lysine residue is at a slightly larger SSD value than its flanking non-charged glycine residues, as might be expected due to its slightly greater hydrophilicity. The lysine residue is both long and flexible enough, however, that it can sometimes be observed to act like two distinct residues, one containing the hydrophobic methylene units and the other the hydrophilic amine group. Figure 9 reveals that the lysine residue exhibits nearly twice the separation distance between the residue SSD and the closest-atom SSD when compared to the other residues. Of course, some fraction of this difference can be explained simply by the residue's larger size.
In order to better assess the behavior of the lysine residue when the peptide is in its adsorbed state, the orientation of its side group was examined. By defining a vector beginning at the lysine residue's alpha carbon and terminating at the nitrogen atom, the orientation could be characterized by the polar angle (or zenith), θ, between the lysine vector and the vector normal to the xz-plane (i.e., normal to the PLA surface). This angle has a value of 0° when the side group is pointing upward and a value of 90° when the side group is laying flat on the surface. Figure 11 presents the normalized probability density (NPD) distribution for the lysine side chain as the average of the three REMD simulations. As part of the normalization procedure, the NPD was divided by sin(θ) in order to account for the different areas swept by the azimuthal angle at each orientation. It is observed that the side chain adopts an orientation pointing toward the vertical (θ < 45°) in approximately one third of all conformations, and adopts a more horizontal orientation the remaining two thirds of the conformations when the peptide is strongly adsorbed. Orientations with θ values greater than or equal to 90° represent only 10% of the sampled conformations, with values greater than 120° not being observed at all; they are essentially forbidden by steric effects, since close interaction by the lysine residue prohibits close contact by the other residues, excluding them from consideration in this set of tightly bound conformations.
Figure 11.
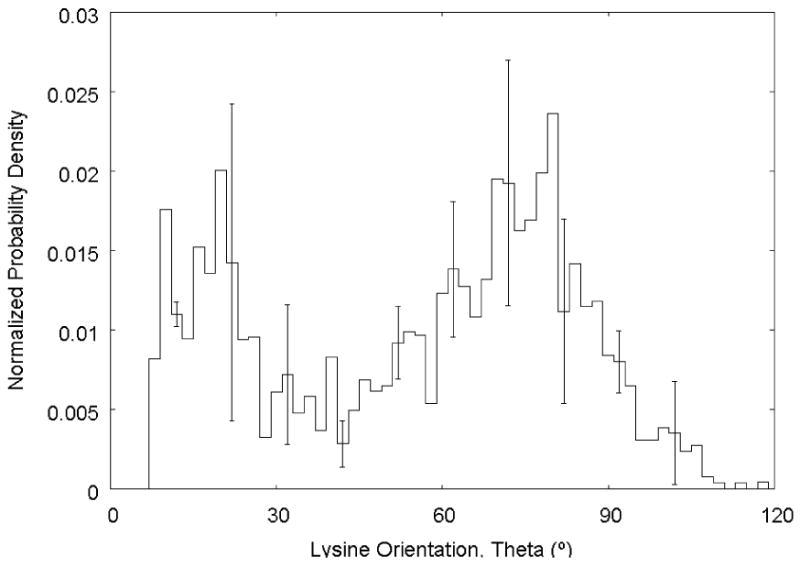
Normalized probability density distribution for the lysine residue polar angle from structures with an SSD value of 6 – 7 Å, calculated from the independent biased REMD simulations. Error bars represent the standard deviation (N = 3).
6. Conclusions
The stated objectives of this research were to develop and apply advanced sampling techniques in order to examine the adsorption behavior of the G4-K-G4 peptide over a crystalline polylactide surface using molecular dynamics techniques. This system, and others like it, involves two distinct types of sampling problems: the SSD sampling problem, which arises due to entropic effects creating barriers in the free energy profile, and the conformational sampling problem, which occurs due to barriers in the potential energy landscape. Because analysis of systems of this type via conventional MD simulation (e.g., Boltzmann-weighted sampling) is inefficient and computationally prohibitive, the use of advanced sampling techniques such as umbrella sampling and biased REMD must be applied. These advanced techniques allow complex and computationally demanding systems to be examined within practical time scales. However, the investigation of increasingly large and intricate systems will be necessary in order to fully understand the manner in which the body responds to an implanted biomaterial because of the high level of complexity of these systems.
The introduction of a more realistic polymer surface in this study represents a significant step forward in the use of MD techniques to examine such systems. The results from the simulations presented in this study are part of a larger effort, involving much additional simulation and experimental work. As more data are generated, new techniques are developed, and computational power continues to increase, these efforts have substantial potential to realize the goal of being able to proactively design implant surfaces to direct and control biological response.
Supplementary Material
This information is available free of charge via the Internet at http://pubs.acs.org.
Figure S.1. Normalized probability density distributions for the Lennard-Jones 12-6-type potential as a function of SSD at 300 K for various values of the well depth. Red diamonds, ε = 3; blue plus signs, ε = 5; black diamonds, ε = 7 kcal/mol. Note that the y-axis of the inset uses a logarithmic scale.
Table S.1. Sampling probability for a system described by a Lennard-Jones 12-6 potential is a strong function of the depth of the energy well, resulting in increasing simulation times to ensure adequate sampling of SSD space.
Figure S.2. Normalized probability density functions for each of the 44 windows from umbrella sampling MD simulations of the G4-K-G4 peptide over a crystalline PLA surface.
Figure S.3. G4-K-G4 peptide trajectory in SSD space for biased MD Run 1 (—) and 2 (×).
Table S.2 Temperature ladder and acceptance ratios for the exchange attempts between adjacent replicas during biased REMD simulations.
Acknowledgments
This work was supported by the ERC program of the National Science Foundation under Award Number EEC-9731680 as part of the Center for Advanced Engineering Fibers and Films (CAEFF). Partial support was also provided by NIH R01 EB006163, R01 GM074511, and the NJ Center for Biomaterials RESBIO (NIH, P41 EB001046). We would like to thank the Department of Mathematical Sciences at Clemson University for the use of their computational cluster environment. The authors would also like to acknowledge the support of the staff from the Cyberinfrastructure Technology Integration group, and the use of the advanced computational resources deployed and maintained by Clemson Computing and Information Technology.
Contributor Information
C. P. O'Brien, Department of Bioengineering, Clemson University
S. J. Stuart, Department of Chemistry, Clemson University
D. A. Bruce, Department of Chemical and Biomolecular Engineering, Clemson University
R. A. Latour, Department of Bioengineering, Clemson University
References
- 1.Latour RA. Biomaterials: Protein-Surface Interactions. In: Wnek G, Bowlin G, editors. The Encyclopedia of Biomaterials and Bioengineering. Taylor & Francis; New York: Online update chapter for 2005 edition. [Google Scholar]
- 2.Kasemo B, Gold J. Adv Dental Res. 1999;13:8–20. doi: 10.1177/08959374990130011901. [DOI] [PubMed] [Google Scholar]
- 3.Puleo DA, Nanci A. Biomaterials. 1999;20:2311–2321. doi: 10.1016/s0142-9612(99)00160-x. [DOI] [PubMed] [Google Scholar]
- 4.Roach P, Farrar D, Perry CC. J Am Chem Soc. 2005;127:8168–8173. doi: 10.1021/ja042898o. [DOI] [PubMed] [Google Scholar]
- 5.Agnihotri A, Siedlecki CA. Langmuir. 2004;20:8846–8852. doi: 10.1021/la049239+. [DOI] [PubMed] [Google Scholar]
- 6.Anderson JM, Bonfield TL, Ziats N. Int J Artif Organs. 1990;13:375–382. [PubMed] [Google Scholar]
- 7.Ratner BD, Hoffman AS, Schoen FJ, Lemons JE. Biomaterials Science: An Introduction to Materials in Medicine. Academic Press; San Diego: 1996. [Google Scholar]
- 8.Hlady V, Buijs J. Curr Opin Biotechnol. 1996;7:72–77. doi: 10.1016/s0958-1669(96)80098-x. [DOI] [PMC free article] [PubMed] [Google Scholar]
- 9.Brash JL, Horbett TA. Proteins at Interfaces II: Fundamentals and Applications. American Chemical Society; Washington, DC: 1995. pp. 1–23. [Google Scholar]
- 10.Sadana A. Chem Rev. 1992;92:1799–1818. [Google Scholar]
- 11.Claesson PM, Blomberg E, Froberg JC, Nylander T, Arnebrant T. Adv Colloid Interfac. 1995;57:161–227. [Google Scholar]
- 12.Vernekar VN, Latour RA. Mater Res Innov. 2005;9:337–353. [Google Scholar]
- 13.Wei Y, Latour RA. Langmuir. 2008;24:6721–6729. doi: 10.1021/la8005772. [DOI] [PMC free article] [PubMed] [Google Scholar]
- 14.Raut VP, Agashe MA, Stuart SJ, Latour RA. Langmuir. 2005;21:1629–1639. doi: 10.1021/la047807f. [DOI] [PubMed] [Google Scholar]
- 15.Wang F, Stuart SJ, Latour RA. Biointerphases. 2008;3(1):9–18. doi: 10.1116/1.2840054. [DOI] [PMC free article] [PubMed] [Google Scholar]
- 16.Branden C, Tooze J. Introduction to Protein Structure. Second. Garland Publishing, Inc.; New York, NY: 1998. [Google Scholar]
- 17.Brooks BR, Bruccoleri RE, Olafson BD, States DJ, Swaminathan S, Karplus M. J Comp Chem. 1983;4:187–217. [Google Scholar]
- 18.MacKerell AD, J, Bashford D, Bellott M, Dunbrack RL, Jr, Evanseck J, Field MJ, Fischer S, Gao J, Guo H, Ha S, Joseph D, Kuchnir L, Kuczera K, Lau FTK, Mattos C, Michnick S, Ngo T, Nguyen DT, Prodhom B, Reiher WE, I, Roux B, Schlenkrich M, Smith J, Stote R, Straub J, Watanabe M, Wiorkiewicz-Kuczera J, Yin D, Karplus M. J Phys Chem B. 1998;102:3586–3616. doi: 10.1021/jp973084f. [DOI] [PubMed] [Google Scholar]
- 19.MacKerell AD, Jr, Feig M, Brooks CL., III J Comput Chem. 2004;25:1400–1415. doi: 10.1002/jcc.20065. [DOI] [PubMed] [Google Scholar]
- 20.Feig M, Karanicolas J, Brooks CL., III J Mol Graph Model. 2004;22:377–395. doi: 10.1016/j.jmgm.2003.12.005. [DOI] [PubMed] [Google Scholar]
- 21.Humphrey W, Dalke A, Schulten K. J Mol Graphics. 1996;14:33–38. doi: 10.1016/0263-7855(96)00018-5. [DOI] [PubMed] [Google Scholar]
- 22.Sasaki S, Asakura T. Macromolecules. 2003;36:8385–8390. [Google Scholar]
- 23.O'Brien CP. PhD dissertation. Clemson University; 2005. Quantum and molecular modeling of polylactide. [Google Scholar]
- 24.McAliley J, O'Brien CP, Bruce DA. J Phys Chem A. 2008 doi: 10.1021/jp712114q. ASAP Web Release Date: 16-Jul-2008; (Article) [DOI] [PubMed] [Google Scholar]
- 25.Berendsen HJC, van der Spoel D, van Drunen R. Comp Phys Comm. 1995;91:43–56. [Google Scholar]
- 26.Lindahl E, Hess B, van der Spoel D. J Mol Mod. 2001;7:306–317. [Google Scholar]
- 27.Jorgensen WL, Maxwell DS, Tirado-Rives J. J Am Chem Soc. 1996;118:11225–11236. [Google Scholar]
- 28.Leach AR. Molecular Modelling: Principles and Applications. Pearson Education Limited; England: 2001. p. 179. [Google Scholar]
- 29.Zhang J, Liang Y, Yan J, Lou J. Polymer. 2007;48:4900–4905. [Google Scholar]
- 30.Jorgensen WL, Chandrasekhar J, Madura J, Impey RW, Klein ML. J Chem Phys. 1983;79:926–935. [Google Scholar]
- 31.Mezei M. Mol Simul. 1989;3:301–313. [Google Scholar]
- 32.Gunsteren WFV, Weiner PK. Computer Simulation of Biomolecular Systems: Theoretical and Experimental Applications (Volume 1) ESCOM Science; Leiden, The Netherlands: 1989. [Google Scholar]
- 33.Kirkwood JG. J Chem Phys. 1935;3:300–313. [Google Scholar]
- 34.Roux B. Comp Phys Comm. 1995;91:275–282. [Google Scholar]
- 35.Torrie GM, Valleau JP. J Comp Phys. 1977;23(2) [Google Scholar]
- 36.Kumar S, Rosenberg JM, Bouzida D, Swendsen RH, Kollman PA. J Comp Chem. 1995;16(11):1339–1350. [Google Scholar]
- 37.Grossfield A. An Implementation of WHAM: the Weighted Histogram Analysis Method. 2006 http://membrane.urmc.rochester.edu/
- 38.Sugita Y, Okamoto Y. Chem Phys Lett. 1999;314:141. [Google Scholar]
- 39.Lennard-Jones JE. Cohesion. P Phys Soc Lond. 1931;43:461–482. [Google Scholar]
- 40.Overbeek JTG. J Colloid Interface Sci. 1977;58:408. [Google Scholar]
- 41.Israelachvili J. Intermolecular & Surface Forces. Academic; New York: 1992. p. 246. [Google Scholar]
- 42.Ryckaert JP, Ciccotti G, Berendsen HJC. J Comput Phys. 1977;23:327–341. [Google Scholar]
- 43.Andersen Hans C. J Comput Phys. 1983;52:24–34. [Google Scholar]
- 44.Martyna GJ, Tuckerman ME, Tobias DJ, Klein ML. Mol Phys. 1996;87:1117. [Google Scholar]
- 45.Lamoureux G, Roux B. J Chem Phys. 2003;119 [Google Scholar]
- 46.Nosé S. Mol Phys. 1984;52:255–268. [Google Scholar]
- 47.Hoover WG. Phys Rev A. 1985;31:1695–1697. doi: 10.1103/physreva.31.1695. [DOI] [PubMed] [Google Scholar]
- 48.Rathore N, Chopra M, de Pablo JJ. J Chem Phys. 2005;122:024111. doi: 10.1063/1.1831273. [DOI] [PubMed] [Google Scholar]
- 49.Thanki Paragkumar N, Dellacherie Edith, Jean-Luc Six. Appl Surf Sci. 2006;253(5):2758–2764. [Google Scholar]
- 50.Ishaug-Riley SL, Okun LE, Prado G, Applegate MA, Ratcliffe A. Biomaterials. 1999;20:2245–2256. doi: 10.1016/s0142-9612(99)00155-6. [DOI] [PubMed] [Google Scholar]
- 51.Ramachandran GN, Ramakrishnan C, Sasisekharan V. J Mol Biol. 1963;7:95–99. doi: 10.1016/s0022-2836(63)80023-6. [DOI] [PubMed] [Google Scholar]
- 52.Lovell SC, Davis IW, Arendall WB, III, de Bakker PIW, Word JM, Prisant MG, Richardson JS, Richardson DC. Proteins. 2003;50:437–450. doi: 10.1002/prot.10286. [DOI] [PubMed] [Google Scholar]
Associated Data
This section collects any data citations, data availability statements, or supplementary materials included in this article.
Supplementary Materials
This information is available free of charge via the Internet at http://pubs.acs.org.
Figure S.1. Normalized probability density distributions for the Lennard-Jones 12-6-type potential as a function of SSD at 300 K for various values of the well depth. Red diamonds, ε = 3; blue plus signs, ε = 5; black diamonds, ε = 7 kcal/mol. Note that the y-axis of the inset uses a logarithmic scale.
Table S.1. Sampling probability for a system described by a Lennard-Jones 12-6 potential is a strong function of the depth of the energy well, resulting in increasing simulation times to ensure adequate sampling of SSD space.
Figure S.2. Normalized probability density functions for each of the 44 windows from umbrella sampling MD simulations of the G4-K-G4 peptide over a crystalline PLA surface.
Figure S.3. G4-K-G4 peptide trajectory in SSD space for biased MD Run 1 (—) and 2 (×).
Table S.2 Temperature ladder and acceptance ratios for the exchange attempts between adjacent replicas during biased REMD simulations.