Abstract
A quantitative method has been developed and validated for the simultaneous determination of anandamide (AEA), docosatetraenylethanolamide (DEA) and N-arachidonyldopamine (NADA) in dorsal vagal complex (DVC) of rat brainstem by liquid chromatographic-electrospray ionization mass spectrometry. The analytes were extracted from the tissue samples of rat brainstem by a single step liquid extraction technique using acetonitrile. The chromatographic separation was conducted on a C18 column using a gradient mobile phase consisting of methanol and water at a flow rate of 0.3 mL min-1. The analytes were quantified by positive electrospray ionization mass spectrometry with selected ion monitoring (SIM) mode. The limits of detection (LOD) for AEA, DEA and NADA were 0.5, 1 and 0.5 ng mL-1, respectively. This method required only simple processing of the samples and could be applied to monitor the change in the level of these compounds in DVC of the rat brain tissue. Time dependent (10-70 min) accumulation of the endocannabinoids (AEA, DEA, and NADA) in brain tissue was also studied, which included a novel examination of the accumulation of DEA as a function of time in rat brain tissue after decapitation.
Keywords: Column liquid chromatography-mass spectrometry, Dorsal vagal complex, Anandamide, 2-Arachidonylglycerol and N-arachidonyldopamine, Endocannabinoids
Introduction
Since the successful cloning of the G-protein-coupled cannabinoid type 1 (CB1) receptor from the central nervous system (CNS) in 1990 [1], intensive efforts have been focused on studies of the receptors and ligands of the endogenous cannabinoid system to understand the mechanisms underlying its function [2-6]. Subsequently, a second cannabinoid receptor (CB2), which mainly distributes outside the CNS [7], and many endogenous cannabinoid receptor ligands or endocannabinoids (eCBs), such as anandamide (AEA) [8], 2-AG [9, 10], docosatetraenylethanolamide (DEA) [11], N-arachidonyldopamine (NADA) [12], etc., have been discovered. In addition, functional activation of transient receptor potential vanilloid type 1 receptors (TRPV1) by one class of eCBs, has been described [13-15], and these agonists may also regulate the production of 2-AG [5]. In the CNS, eCBs are thought to be produced in neuronal membranes and released locally to act as retrograde signaling molecules at neuronal synapses [16]. The eCB system in the CNS participates in regulation of several physiological processes, including food intake [17], emesis [18, 19], pain regulation [20], and various aspects of cognition and motivation [21]. Most studies have been focused on AEA and 2-AG to understand the physiological functions and mechanism of these eCBs [22]. There are very few reports in the literature describing DEA and NADA activity. However, like AEA, both NADA and DEA are found in brain tissue, and both may act via CB1 and TRPV1 [12, 19, 23]. The mechanisms and functions of these eCB systems in brain are still not clear, but determining the presence of N-acylethanolamine eCBs in brain areas that express CB1/CB2, and TRPV1 will allow meaningful predictions of eCB actions in these regions.
In studies of eCBs, a reliable method for identification and quantification in rat brain tissue is vital. Chromatographic-mass spectrometry methods, including GC-MS [10], LC-MS [17, 24], LC-MS-MS [22, 25, 26], have been used for lipid analysis. In most cases, the samples were prepared by liquid-liquid extraction and further purified by solid phase extraction (SPE) before analysis. These methods were complicated and expensive SPE columns were needed. Disadvantages of GC-MS also include extra steps for derivatization of analytes due to the non-volatile properties of these eCBs. A few citations describe validated methods with chromatographic-mass spectrometry for simultaneous analysis of eCBs in specific brain areas [22, 24, 25]. However, these quantification methods were not calibrated and validated with the same matrices used for quantification, which can affect the accuracy of the results. Additionally, reported values of AEA levels in references are inconsistent, e.g., very different AEA levels in rat hypothalamus have been reported from 6.4 ng g-1 to 2.4 μg g-1 [22, 27, 28]. Simultaneous detection of multiple N-acylethanolamines (i.e., AEA, DEA and NADA) has not been reported.
Regional variation in eCB levels have been shown in the CNS [22, 24, 25]. In the dorsal vagal complex (DVC), the presence of AEA was suggested by high concentrations of the AEA hydrolyzing enzyme fatty acid amide hydrolase (FAAH) [18], but eCB levels have never been reported. Direct application of CB agonists in the DVC has profound effects on gastrointestinal function [18, 19, 29]. In the DVC, TRPV1 and CB1 are activated by AEA to effect opposite changes in synaptic input to vagal motor neurons [14, 30] and in gastric function [19]; modulation of eCB content in the region might be expected to have important physiological effects. Time dependent accumulation of AEA and 2-AG levels in brain tissue after decapitation has also been observed [10, 31-34]. It is essential to be able to simultaneously monitor levels of eCBs in specific regions under different physiological conditions to study the mechanism of eCB regulation. A reliable quantification method in a small amount of brain tissue is necessary to quantify these agonists in DVC.
In this study, we report a quantitative, validated LC-MS method for simultaneous analysis of three identified N-acylethanloamine eCBs, AEA, DEA, and NADA. The advantages of this method include the small amount of brain tissue (5 mg) used, the simple sample preparation, and the good sensitivity and selectivity. Additionally, for the first time the kinetics of the accumulation of DEA is reported in rat brain tissue after decapitation.
Experimental
Materials and Chemicals
AEA, DEA and NADA were obtained from Tocris Cookson Inc. (Ellisville, MO, USA). Ammonium acetate, methanol, acetonitrile (ACN), and acetic acid (all LC grade) were obtained from Fisher Scientific (Fairlawn, NJ, USA). Water was purified by a Barnstead nanopure Diamond Ultrapure water system (Barnstead International, Dubuque, IA, USA). All mobile phase was filtered with HNWP 0.45 μm membrane filters (Millipore, Billerica, MA, USA).
Brainstem Slice Preparation
All procedures were performed on male Sprague-Dawley rats (Harlan, Indianapolis, IN, USA) and were approved by the University of Kentucky Animal Care and Use Committee. Transverse brainstem slices were prepared from male Sprague-Dawley rats (Harlan), 4-6 weeks of age as previously described [30]. Rats were deeply anesthetized by halothane inhalation and sacrificed by rapid decapitation while anesthetized. Brains were rapidly removed and immersed in ice-cold (0-4 °C), oxygenated (95% O2-5% CO2) artificial cerebrospinal fluid (ACSF) containing (in mM): 124 NaCl, 3 KCl, 26 NaHCO3, 1.4 NaH2PO4, 11 glucose, 1.3 CaCl2, and 1.3 MgCl2, pH = 7.3-7.4, with an osmolality of 290-310 mOsm kg-1. Transverse brainstem slices (350-400 μm) containing the DVC was made using a vibrating microtome (Vibratome Series 1000; Technical Products Intl., St. Louis, MO, USA). Time used to prepare the slices was strictly controlled at 10 min. Brainstem slices were frozen immediately at -80 °C until further processing. Time dependent accumulation of eCBs in brain tissue was studied by using slices incubated at 33-35 °C in oxygenated ACSF for 10-60 min.
Calibration Standards and Quality Control Samples
AEA, DEA, and NADA stock solutions were prepared in methanol (5 mg mL-1) and stored at -20 °C. Standards and quality control samples (QCs) were made from stock solutions and diluted with ACN. Working calibration standards at concentrations of 0.5-50 ng mL-1 for AEA and NADA and 1-100 ng mL-1 for DEA in DVC brain tissue were prepared fresh daily. Three levels of QC samples, 1, 25, and 50 ng mL-1 for AEA and NADA and 2, 50, and 100 ng mL-1 for DEA were prepared with DVC brain tissue for the determination of inter-day, intra-day accuracy and precision.
Extraction Procedure
The eCB ligands were obtained from tissue samples by a solvent extraction procedure. The brain tissue was weighed and homogenized in a Kontes tissue grinder in 10 volume of ice-cold saline. Fifty microliter of the described homogenized tissue solution was transferred to a 1.5 mL siliconized microcentrifuge tube and 10 volume of acetonitrile was added to extract the eCBs. The mixture was vortexed for 30 s and centrifuged at 12,000×g for 20 min. The clear supernatant was transferred into a clean 3 mL silanized test tube and evaporated under nitrogen at 37 °C. The residue was reconstituted in 100 μL of acetonitrile, vortexed for 30 s and sonicated in 4 °C water for 15 min. A 20 μL aliquot of the clear solution was used for LC-MS analysis. All samples were injected in duplicates.
LC-MS Conditions
The liquid chromatography was performed on a Waters Alliance 2690 LC pump (Waters, Milford, MA, USA) with a Waters Alliance 2690 autosampler and a thermostatic column compartment. The analytical column used was a Waters Symmetry C18 (2.1 × 150 mm, 5 μm) and the guard column, a Waters symmetry C18 (2.1 × 10 mm, 3.5 μm). The gradient elution mobile phase initially consisted of 30% A: 70% B. A was 1 mM ammonium acetate with 0.1% (v/v) acetic acid and 5% methanol in water and B was 1 mM ammonium acetate with 0.1% (v/v) acetic acid in methanol. The initial 70% mobile phase B was increased linearly to 85% over 25 min, maintained for 5 min and then increased linearly to 100% in 1 min and maintained for 13 min. Finally, the mobile phase B was decreased to 70% in 1 min and reequilibrated at 70% for a further 5 min. Sample temperature was maintained at 10 °C in the autosampler prior to analysis. The flow-rate was 0.3 mL min-1. The detector was a Micromass ZQ detector (Waters, Milford, MA, USA) equipped with an electrospray ionization (ESI) probe. Nitrogen was used as a nebulization and drying gas. The detector was set to the following conditions: capillary voltage 3.5 kV, cone voltage 25 kV, extractor voltage 5.0 V and RF lens voltage 0.5 V; source and desolvation temperatures were 120 and 250 °C, respectively. Selected ion monitoring (SIM) was performed in positive mode for AEA, m/z 348 [M + H]+, (dwell time 0.30 s), DEA, m/z 376 [M + H]+ (dwell time 0.30 s), and NADA, m/z 440 [M + H]+ (dwell time 0.30 s). The retention times for AEA, DEA and NADA were 22.78 ± 0.14, 29.06 ± 0.30, and 23.35 ± 0.18 min, respectively. Calibration graphs were constructed using a linear regression of the drug peak-area versus nominal drug concentrations.
Method Validation
Study results showed tissue region variation in eCB levels [22, 24, 25]. To minimize possible interference in sample background due to different portions of the brain tissue being used for calibration and sample analysis, standardized brainstem minislices containing the DVC were used to prepare the calibration curves [30]. To ensure homogeneity of eCB contents in blank tissue samples, three to five slices were combined and homogenized before equal aliquots of homogenate solution samples were transferred to microcentrifuge tubes. The background levels of eCBs were corrected for each calibration plot. Duplicate five-point calibration plots were prepared using standards containing the three analytes of interest, with the final concentrations over a range of 0.5-50 ng mL-1 (AEA and NADA) and 1-100 ng mL-1 (DEA) by spiking the DVC tissue samples with stock solutions. The method was validated for intra-day (n = 3) and inter-day (n =3) accuracy, precision, recovery, and reproducibility using three spiked QC samples with final concentrations of 1, 25, and 50 ng mL-1 AEA and NADA and 2, 50, and 100 ng mL-1 DEA.
The accuracy was determined by the percent difference between the mean concentration of the QC sample, calculated from the calibration plots, and the nominal concentrations; the precision was calculated from the intra- and inter-day coefficient of variation (CV) of these samples. A 20% value of CV was considered to be acceptable for accuracy and precision at the lower limit of quantification (LLOQ). The limit of detection (LOD) was set at the concentration when the signal/noise ratio was equal or greater than 3:1 [22]. The extraction recoveries of AEA, DEA, and NADA were calculated by comparing the peak areas of extracted QC samples from DVC to the peak areas of analytes in ACN.
Results and Discussion
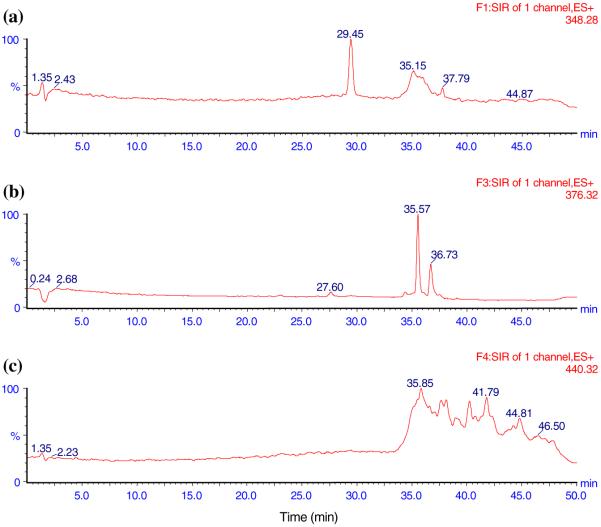
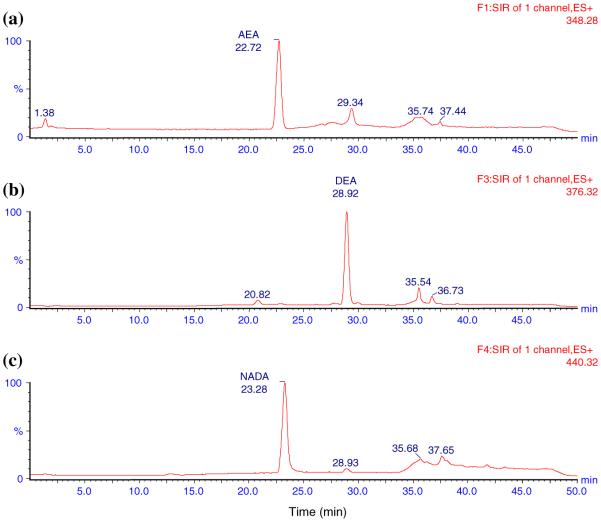
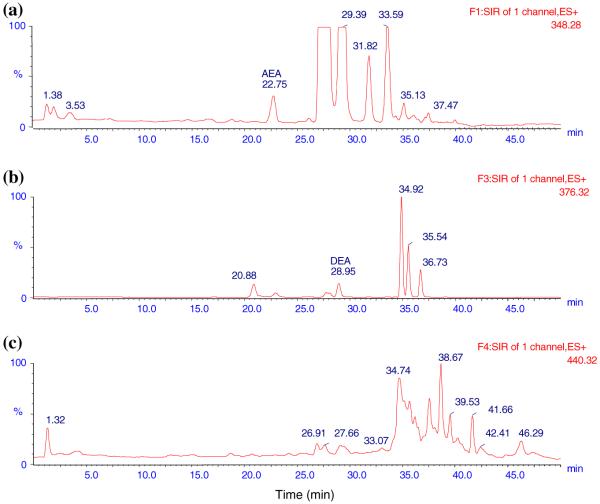
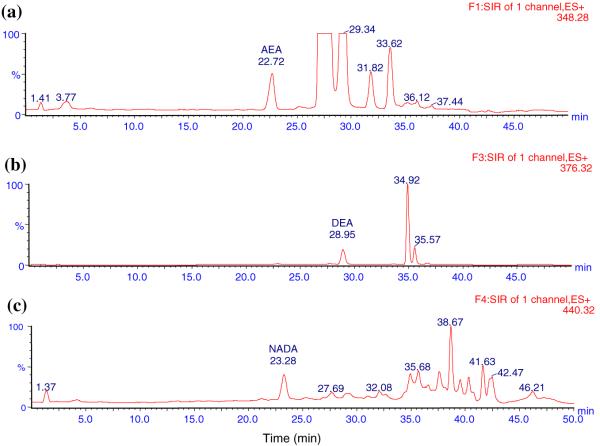
The LC method was developed to ensure that all analytes were clearly separated without interference. Initially, the LC method used by Patel et al. to detect AEA and 2-AG in rat brain tissue was tried [35]. It consisted of an isocratic mobile phase of 1 mM ammonium acetate in H2O: methanol (15:85) at a flow rate of 0.3 mL min-1. However, a large peak was found interfering with the DEA peak. A number of gradient methods were tried and the one with the best separation results was used. The total run time for each sample was 50 min. The representative ion chromatograms obtained with blank ACN, analytes in ACN, blank DVC, and blank DVC spiked with analytes are shown in Figs. 1,2, 3, and 4, respectively. Figures clearly show that AEA, DEA, and NADA peaks were well resolved and separated from background peaks of ACN and brain. Standard curves for AEA and NADA in DVC were linear over a range of 0.5-50 ng mL-1. For DEA, it was linear over 1-100 ng mL-1. The mean (n = 3) calibration plots (with standard deviation for slope and intercept values) for AEA, DEA, and NADA were y = (1,018 ± 87) x - (4.32 ± 33.8), R2 = 0.998, y = (749.0 ± 70.8) x - (604.2 ± 394.2), R2 = 1.000, and y = (937.2 ± 58.6) x - (124.6 ± 35.3), R2 = 0.998, respectively, where y and x are the peak area and concentration (ng mL-1) of analyte, respectively.
Fig. 1.
The representative LC-MS ion chromatograms of pure ACN showing no interference. a AEA, b DEA, c NADA
Fig. 2.
The representative LC-MS ion chromatograms of analytes in ACN. a 21 mg mL-1 AEA in ACN (22.72 min), b 150 mg mL-1 DEA in ACN (28.92 min), c 21 mg mL-1 NADA in ACN (23.28 min)
Fig. 3.
Typical LC-MS ion chromatograms of blank DVC. a AEA (22.75 min), b DEA (28.95 min). Note that NADA was not detected in blank DVC
Fig. 4.
Typical LC-MS ion chromatograms of blank DVC spiked with 7 ng mL-1 of AEA, NADA and 50 ng mL-1 of DEA. a AEA (22.72 min), b DEA (28.95 min), c NADA (23.28 min)
The values for recoveries of AEA, DEA, and NADA were all greater than 87.5%. The mean recoveries of these analytes (n = 3) in the concentration range of 0.5-50 ng mL-1 for AEA and NADA and 1-100 ng mL-1 for DEA were 102.8% (%CV 6.7), 92.6% (%CV 4.8), and 100.8% (%CV 5.3), respectively. The recovery values for QC samples were from 95.0 to 105.5%, 87.5 to 96.5%, and 94.5 to 99.5% for AEA, DEA, and NADA, respectively. The recoveries of AEA, DEA, and NADA in the QC samples are listed in Table 1. These high percent recovery data indicated that the sample preparation and LC-MS methods provided efficient extraction of all analytes from DVC tissue samples with no significant matrix effect.
Table 1.
Recovery data for QC samples of AEA, DEA, and NADA
| Concentration (ng mL-1)a | Recovery (%) | %CVb |
|---|---|---|
| AEA | ||
| 1 | 105.5 | 12.2 |
| 25 | 95.0 | 15.2 |
| 50 | 99.0 | 14.7 |
| DEA | ||
| 2 | 87.5 | 19.4 |
| 50 | 96.5 | 20.3 |
| 100 | 94.2 | 16.7 |
| NADA | ||
| 1 | 94.7 | 3.5 |
| 25 | 99.5 | 12.5 |
| 50 | 97.3 | 10.6 |
n = 3
%CV (coefficient of variation) = 100*(standard deviation/mean concentration)
Results of the intra-day and inter-day validation data of AEA, DEA, and NADA for the method are shown in Table 2. For all analytes, the inter-day precision was found within a CV% of 3.0-20.0% and that of the intra-day was of 1.4-14.8%, all were within acceptable ranges. The LLOQ’s were found to be 0.5, 1, and 0.5 ng mL-1 for AEA, DEA and NADA, respectively. The LOD’s for AEA, DEA, and NADA were 0.25, 0.5, and 0.25 ng mL-1, respectively. The above data demonstrated that the method provided good linearity and high recoveries of all analytes and had sufficient sensitivity, precision, and accuracy for simultaneous measurement of AEA, DEA, and NADA in small amounts (5 mg) of DVC rat brain tissue.
Table 2.
Inter-day and intra-day assay precision, accuracy of the LC-MS method for the measurement of AEA in rat brain DVC tissue
| Inter-day variation |
Intra-day variation |
||||||||
|---|---|---|---|---|---|---|---|---|---|
| Nominal concentration (ng mL-1) |
Mean concentration found (ng mL-1) |
Precision CV% |
Mean accuracy (%) |
%bias | Nominal concentration (ng mL-1) |
Mean concentration found (ng mL-1) |
Precision CV% |
Mean accuracy (%) |
%bias |
| AEA | |||||||||
| 1 | 1.1 | 12.2 | 106.3 | 6.3 | 1 | 1.0 | 14.8 | 102.8 | 2.8 |
| 25 | 24.5 | 15.2 | 97.9 | -2.1 | 25 | 25.4 | 1.7 | 101.6 | 1.6 |
| 50 | 50.3 | 14.7 | 100.5 | 0.5 | 50 | 52.3 | 5.6 | 104.6 | 4.6 |
| DEA | |||||||||
| 2 | 1.7 | 10.2 | 84.7 | -15.3 | 2 | 1.8 | 9.4 | 91.8 | -8.4 |
| 50 | 49.7 | 20.0 | 99.4 | -0.6 | 50 | 54.1 | 2.5 | 108.1 | 8.1 |
| 100 | 100.1 | 16.6 | 100.1 | 0.1 | 100 | 106.3 | 6.0 | 106.3 | 6.3 |
| NADA | |||||||||
| 1 | 1.0 | 3.0 | 103.9 | 3.9 | 1 | 1.0 | 13.6 | 100.4 | 0.4 |
| 25 | 24.5 | 12.5 | 98.1 | -1.9 | 25 | 24.9 | 1.4 | 99.4 | -0.6 |
| 50 | 50.2 | 10.6 | 100.4 | 0.4 | 50 | 50.6 | 2.2 | 101.1 | 1.1 |
Mean accuracy(%) = 100*(mean concentration/nominal concentration). % bias = 100*(mean concentration - nominal concentration)/nominal concentration. %CV = 100*(standard deviation/mean concentration)
The described LC-MS method was used to study the time dependent accumulation of AEA, DEA, and NADA in DVC rat brain tissue after decapitation. The accumulation of AEA levels in pig and rat brain tissue after decapitation has been studied [31, 32]. However, the time scales of these studies were on hours. In a physiology study, the time used to prepare the tissue slices of a specific region is often much shorter (minutes), but incubation times typically used in electro-physiological recording experiments can extend for several hours. A study of eCB accumulation on a minutes-to-hours time scale would be useful. The content of these eCBs in DVC tissue at 10, 20, 30, and 70 min after decapitation (n =2) were studied and the quantification data are shown in Fig. 5. Results showed that DEA accumulated much faster than AEA under the same conditions. In DVC, the AEA level increased from 18 ng g-1 after 10 min to 118 ng g-1 by 70 min, while DEA increased from 52 ng g-1 at 10 min to 1,053 ng g-1 at 70 min after decapitation. The slow accumulation of AEA levels as a function of time corroborated with that reported earlier [31, 32, 34], and the content of AEA at 70 min (118 ng g-1) was within the previously reported range (180 ng g-1 at 3 h) [32]. DEA accumulated relatively slowly from 10 to 20 min and increased ~50%. The different accumulation rates for the two agonists may reflect different activities of reuptake and metabolism mechanisms in statically-incubated slices, as was observed for AEA and 2-AG in incubated tissue resected surgically in humans [34]. Due to differential accumulation of eCBs in rat brain tissue after decapitation, it is important to record exact times spent in preparing the tissue samples (slices) before freezing or analysis. Also, sample slices should be used as soon as they are thawed; since accumulation of eCBs in thawed brain tissues has been reported [31]. NADA was not detected in the DVC even 70 min after decapitation. One reason for this might be that NADA is not produced in the DVC or is at too low a concentration to be detected. The NADA content of various rat brain regions have been studied. The highest concentration was ~2.4 ng g-1 (in striatum) [12], which was similar to the concentration reported by Bradshaw et al. [26]. This is below the detection limit of the method described here.
Fig. 5.
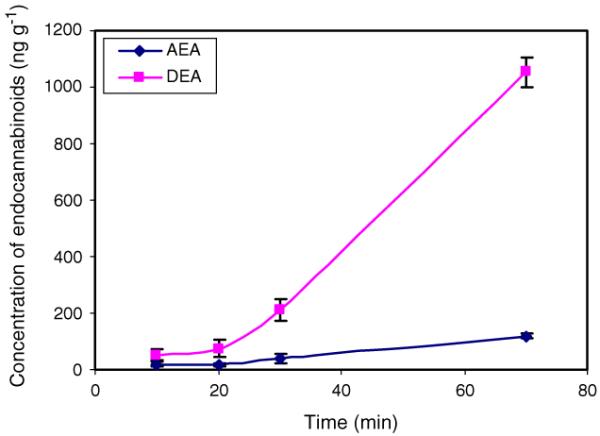
Time dependent accumulation of AEA and DEA in DVC brain tissue after decapitation of rats. Note NADA was not detected
In conclusion, a new LC-MS method for simultaneous quantification of AEA, DEA, and NADA in DVC of rat brain tissue was validated and reported. The advantages of this method include the small amount of brain tissue (5 mg) needed, the simple sample preparation procedure, the lack of need for a more expensive LC-MS-MS, and good sensitivity and selectivity. Additionally, a time dependent (10-70 min) accumulation of three eCBs in brain tissue was studied, and for the first time the accumulation kinetics of DEA in rat brain tissue after decapitation was reported. The DEA level in DVC increased much faster than that of AEA after decapitation. However, in DVC, NADA could not be detected even after 70 min post-decapitation.
Acknowledgments
Financial support to ALS was provided by the American Cancer Society (RSG-00-027-04-CDD) and to BNS by the National Institutes of Health (DK056132).
References
- 1.Matsuda LA, Lolait SJ, Brownstein MJ, Young AC, Bonner TI. Nature. 1990;346:561–564. doi: 10.1038/346561a0. [DOI] [PubMed] [Google Scholar]
- 2.Schmid HH. Chem Phys Lipids. 2000;108:71–87. doi: 10.1016/s0009-3084(00)00188-2. [DOI] [PubMed] [Google Scholar]
- 3.Piomelli D. Nat Rev Neurosci. 2003;4:873–884. doi: 10.1038/nrn1247. [DOI] [PubMed] [Google Scholar]
- 4.Starowicz K, Nigam S, Di Marzo V. Pharmacol Ther. 2007;114:13–33. doi: 10.1016/j.pharmthera.2007.01.005. [DOI] [PubMed] [Google Scholar]
- 5.Maccarrone M, Rossi S, Bari M, De Chiara V, Fezza F, Musella A, et al. Nat Neurosci. 2008;11:152–159. doi: 10.1038/nn2042. [DOI] [PubMed] [Google Scholar]
- 6.Di Marzo V, Cristino L. Nat Neurosci. 2008;11:124–126. doi: 10.1038/nn0208-124. [DOI] [PubMed] [Google Scholar]
- 7.Munro S, Thomas KL, Abu-Shaar M. Nature. 1993;365:61–65. doi: 10.1038/365061a0. [DOI] [PubMed] [Google Scholar]
- 8.Devane WA, Hanus L, Breuer A, Pertwee RG, Stevenson LA, Griffin G, et al. Science. 1992;258:1946–1949. doi: 10.1126/science.1470919. [DOI] [PubMed] [Google Scholar]
- 9.Sugiura T, Kondo S, Sukagawa A, Nakane S, Shinoda A, Itoh K, et al. Biochem Biophys Res Commun. 1995;215:89–97. doi: 10.1006/bbrc.1995.2437. [DOI] [PubMed] [Google Scholar]
- 10.Stella N, Schweitzer P, Piomelli D. Nature. 1997;388:773–778. doi: 10.1038/42015. [DOI] [PubMed] [Google Scholar]
- 11.Hanus L, Gopher A, Almog S, Mechoulam R. J Med Chem. 1993;36:3032–3034. doi: 10.1021/jm00072a026. [DOI] [PubMed] [Google Scholar]
- 12.Huang SM, Bisogno T, Trevisani M, Al-Hayani A, De Petrocellis L, Fezza F, et al. Proc Natl Acad Sci USA. 2002;99:8400–8405. doi: 10.1073/pnas.122196999. [DOI] [PMC free article] [PubMed] [Google Scholar]
- 13.De Petrocellis L, Bisogno T, Maccarrone M, Davis JB, Finazzi-Agro A, Di Marzo V. J Biol Chem. 2001;276:12856–12863. doi: 10.1074/jbc.M008555200. [DOI] [PubMed] [Google Scholar]
- 14.Derbenev AV, Monroe MJ, Glatzer NR, Smith BN. J Neurosci. 2006;26:9666–9672. doi: 10.1523/JNEUROSCI.1591-06.2006. [DOI] [PMC free article] [PubMed] [Google Scholar]
- 15.Marinelli S, Di Marzo V, Florenzano F, Fezza F, Viscomi MT, van der Stelt M, et al. Neuropsychopharmacology. 2007;32:298–308. doi: 10.1038/sj.npp.1301118. [DOI] [PubMed] [Google Scholar]
- 16.Wilson RI, Nicoll RA. Nature. 2001;410:588–592. doi: 10.1038/35069076. [DOI] [PubMed] [Google Scholar]
- 17.Di Marzo V, Goparaju SK, Wang L, Liu J, Batkai S, Jarai Z, et al. Nature. 2001;410:822–825. doi: 10.1038/35071088. [DOI] [PubMed] [Google Scholar]
- 18.Van Sickle MD, Oland LD, Ho W, Hillard CJ, Mackie K, Davison JS, et al. Gastroenterology. 2001;121:767–774. doi: 10.1053/gast.2001.28466. [DOI] [PubMed] [Google Scholar]
- 19.Sharkey KA, Cristino L, Oland LD, Van Sickle MD, Starowicz K, Pittman QJ, et al. Eur J NeuroSci. 2007;25:2773–2782. doi: 10.1111/j.1460-9568.2007.05521.x. [DOI] [PubMed] [Google Scholar]
- 20.Mackie K. Annu Rev Pharmacol Toxicol. 2006;46:101–122. doi: 10.1146/annurev.pharmtox.46.120604.141254. [DOI] [PubMed] [Google Scholar]
- 21.Freund TF, Katona I, Piomelli D. Physiol Rev. 2003;83:1017–1066. doi: 10.1152/physrev.00004.2003. [DOI] [PubMed] [Google Scholar]
- 22.Richardson D, Ortori CA, Chapman V, Kendall DA, Barrett DA. Anal Biochem. 2007;360:216–226. doi: 10.1016/j.ab.2006.10.039. [DOI] [PubMed] [Google Scholar]
- 23.Movahed P, Jonsson BA, Birnir B, Wingstrand JA, Jorgensen TD, Ermund A, et al. J Biol Chem. 2005;280:38496–38504. doi: 10.1074/jbc.M507429200. [DOI] [PubMed] [Google Scholar]
- 24.Koga D, Santa T, Fukushima T, Homma H, Imai K. J Chromatogr B Biomed Sci Appl. 1997;690:7–13. doi: 10.1016/s0378-4347(96)00391-x. [DOI] [PubMed] [Google Scholar]
- 25.Williams J, Wood J, Pandarinathan L, Karanian DA, Bahr BA, Vouros P, et al. Anal Chem. 2007;79:5582–5593. doi: 10.1021/ac0624086. [DOI] [PubMed] [Google Scholar]
- 26.Bradshaw HB, Rimmerman N, Krey JF, Walker JM. Am J Physiol Regul Integr Comp Physiol. 2006;291:R349–R358. doi: 10.1152/ajpregu.00933.2005. [DOI] [PubMed] [Google Scholar]
- 27.Di Marzo V, Breivogel CS, Tao Q, Bridgen DT, Razdan RK, Zimmer AM, et al. J Neurochem. 2000;75:2434–2444. doi: 10.1046/j.1471-4159.2000.0752434.x. [DOI] [PubMed] [Google Scholar]
- 28.Di S, Boudaba C, Popescu IR, Weng FJ, Harris C, Marcheselli VL, et al. J Physiol. 2005;569:751–760. doi: 10.1113/jphysiol.2005.097477. [DOI] [PMC free article] [PubMed] [Google Scholar]
- 29.Partosoedarso ER, Abrahams TP, Scullion RT, Moerschbaecher JM, Hornby PJ. J Physiol. 2003;550:149–158. doi: 10.1113/jphysiol.2003.042242. [DOI] [PMC free article] [PubMed] [Google Scholar]
- 30.Derbenev AV, Stuart TC, Smith BN. J Physiol. 2004;559:923–938. doi: 10.1113/jphysiol.2004.067470. [DOI] [PMC free article] [PubMed] [Google Scholar]
- 31.Schmid PC, Krebsbach RJ, Perry SR, Dettmer TM, Maasson JL, Schmid HH. FEBS Lett. 1995;375:117–120. doi: 10.1016/0014-5793(95)01194-j. [DOI] [PubMed] [Google Scholar]
- 32.Kempe K, Hsu FF, Bohrer A, Turk J. J Biol Chem. 1996;271:17287–17295. doi: 10.1074/jbc.271.29.17287. [DOI] [PubMed] [Google Scholar]
- 33.Kingsley PJ, Marnett LJ. Anal Biochem. 2003;314:8–15. doi: 10.1016/s0003-2697(02)00643-7. [DOI] [PubMed] [Google Scholar]
- 34.Palkovits M, Harvey-White J, Liu J, Kovacs ZS, Bobest M, Lovas G, et al. Neuroscience. 2008;152:1032–1039. doi: 10.1016/j.neuroscience.2008.01.034. [DOI] [PMC free article] [PubMed] [Google Scholar]
- 35.Patel S, Wohlfeil ER, Rademacher DJ, Carrier EJ, Perry LJ, Kundu A, et al. Br J Pharmacol. 2003;139:1005–1013. doi: 10.1038/sj.bjp.0705334. [DOI] [PMC free article] [PubMed] [Google Scholar]


