

Abstract
Olfactory sensory neurons synapse with mitral cells to form stereotyped connections in the olfactory bulb. Mitral cell apical dendrites receive input from olfactory sensory neurons expressing the same odorant receptor. During development, this restricted dendritic targeting of mitral cells is achieved through eliminating elaborated dendritic trees to a single apical dendrite. Through a genome-wide microarray screen, we identified TARSH as a transiently expressed molecule in mitral cells during the dendritic refinement period. TARSH expression is restricted to pyramidal neurons along the main olfactory pathway, including the anterior olfactory nucleus and piriform cortex. The dynamic TARSH expression is not altered when odor-evoked activity is blocked by naris closure or in AC3 knock-out mice. We also demonstrate that TARSH is a secreted protein. In dissociated olfactory bulb cultures, secreted TARSH promotes the reduction of mitral cell dendritic complexity and restricts dendritic branching and outgrowth of interneurons. Dendritic morphological changes were also observed in mitral cells overexpressing TARSH themselves. We propose that TARSH is part of the genetic program that regulates mitral cell dendritic refinement.
Keywords: Olfactory bulb, anterior olfactory nucleus, piriform cortex, dendritic pruning, autocrine
Introduction
The formation of precise neuronal connections is highly regulated during development (Luo & Flanagan, 2007). Postnatal refinement of immature connections is critical in establishing functional circuits (Luo & O'Leary, 2005). The stereotyped pruning process is directed by genetic programs to refine axonal projections in the brain (Weimann et al., 1999; Zhang et al., 2002). Although molecular mechanisms that trigger axonal pruning are being uncovered (Cheng et al., 2001; Bagri et al., 2003), the genetic program that regulates dendritic pruning in the brain is still elusive.
Olfactory discrimination is achieved with stereotyped olfactory connections (Haberly & Price, 1977; Ojima et al., 1984; Marin et al., 2002; Willhite et al., 2006). Olfactory sensory neurons expressing the same odorant receptors converge their axons onto the same glomeruli and relay olfactory signals to mitral/tufted cells (second-order neurons) in the olfactory bulb (OB) (Ressler et al., 1994; Vassar et al., 1994; Mombaerts et al., 1996; Treloar et al., 1999). A mature mitral cell typically retains a single apical dendrite targeting one glomerulus to synapse with olfactory sensory neuron axons expressing the same type of odorant receptor (Vassar et al., 1994; Lin et al., 2000; Blanchart et al., 2006). Olfactory information is subsequently relayed via mitral cell axons to different regions of the olfactory cortices, including the anterior olfactory nucleus (AON) and piriform cortex (PC).
Developing mitral cells initially extend dendrites that cover multiple glomerular areas during embryonic stages. The elaborated mitral cell dendritic trees undergo dendritic pruning at early postnatal stages to acquire their mature morphology (Malun & Brunjes, 1996; Lin et al., 2000; Blanchart et al., 2006). Neuronal activity affects the organization and maintenance of the olfactory sensory neuron axons (Zhao & Reed, 2001; Yu et al., 2004; Zou et al., 2004). However, dendritic development of mitral cells is slowed, but not disrupted, in the absence of odor-induced activity (Lin et al., 2000; Matsutani & Yamamoto, 2000). Programmed dendritic pruning was observed in the second-order neuron of the Drosophila olfactory system (Marin et al., 2005). Stereotyped targeting of the second-order neurons in the fly is specified by cell lineage and birth order (Jefferis et al., 2001; Marin et al., 2002). Transcription factors and graded membrane molecule expression specify the targeting pattern of the second-order neuron (Komiyama et al., 2003; Komiyama et al., 2007). However, the lineage-dependent targeting pattern is not observed in vertebrate mitral/tufted cells (Reid et al., 1999). The molecular mechanism which regulates mitral/tufted cell dendritic targeting in vertebrate is still not clear, but it is possible that it is also regulated by an innate genetic program.
Here we report that TARSH (Target of NESH SH3) is expressed in the main olfactory system. TARSH is specifically expressed in mitral and tufted cells in the OB and pyramidal neurons in the AON and PC. The temporal and spatial expression pattern of TARSH in mitral cells correlates with the time course of mitral cell dendritic refinement. We demonstrate that TARSH is a secreted molecule and functions to induce the reduction of mitral cell dendritic complexity in vitro. We propose that TARSH is secreted by mitral cells to regulate their dendritic refinement during development.
Materials and Methods
Animals
C57BL/6J mice were used for all the experiments. All mice were housed in filter-top shoebox-type polypropylene cages in the animal facility approved by the University of California, Davis Animal Care and Use Committee. All procedures were in accordance with the NIH animal use guidelines and institution-approved animal use protocols. For timed pregnant or postnatal mice, the date when the copulation plugs were found was defined as E0, and the date when the mice were born was defined as P0.
Microarray hybridization and data analysis
OBs were dissected from E16 and P6 mice. Total RNA of OBs was extracted with TRIZOL Reagent (Invitrogen). The concentration and integrity of RNA samples were evaluated by spectrophotometry absorbance method and formaldehyde gel electrophoresis. We used 8-10 μg total RNA per reaction to synthesize biotin-labeled cRNA probes. Three independent replicas were prepared for each age group. The procedure was conducted according to the manufacturer's standard amplification protocol (Affymetrix). The fragmented probes were hybridized to Affymetrix Mouse Genome GeneChip 430 2.0 arrays according to the manufacturer's protocol. Gene expression profiles of each developmental time point were obtained from three microarray replicates. Cell intensity files from Affymetrix Microarray Suite 5.0 were analyzed with the dChip software package (Li & Wong, 2001). All arrays were normalized to the array with median intensity using the invariant-set method and perfect match model. The resulting differentially expressed gene list was filtered such that only genes whose expression levels satisfied the following comparison criteria were included: Emean / Bmean > 2.0 or Bmean / Emean > 2.0 (Bmean: baseline expression values of E16 chips; Emean: expression values of P6 chips); lower 90% confidence bound applied and P-value ≤ 0.05.
Quantitative RT-PCR
The total RNA of OB at different developmental stages (E14, E16, E18, P0, P3, P6, P10, and P35) was extracted as three independent replicates. Two-step RT-PCR was performed. RT reactions were carried out using Superscript II (Invitrogen) with oligo-dT14VN primers. Two-serial dilutions of each cDNA sample were used for PCR amplification. PCR reactions were prepared with FastStart DNA Master SYBR GreenI mix (Roche). The fluorescence intensity and threshold cycles were detected with a LightCycler (Roche). Mouse β-actin (S: 5′-TCCTTCGTTGCCGGTCCACA-3′; A: 5′-CGTCTCCGGAGTCCATCACA-3′) was used as the invariant baseline. Primer sequences for TARSH are S: 5′-GTGGATTCACATGCCACAAG-3′; A: 5′- CTCCGTGGCTTCCTCTGTAG-3′. The threshold cycle difference between TARSH and β-actin at each developmental time points were plotted.
In situ hybridization
Mice were perfusion fixed and subsequently immersion post-fixed overnight with 4% paraformaldehyde in phosphate buffered saline. Tissues were cryo-protected with 30% sucrose in phosphate buffer. Sagittal frozen sections at 20 μm thickness were obtained. In situ hybridization was performed as described (Chen et al., 2005). Digoxigenin-labeled RNA probes were synthesized and hybridized to slides overnight at 65°C. For fluorescent in situ hybridization, fluorescein-labeled RNA probes were detected with anti-fluorescein-POD (Roche) and TSA (PerkinElmer). For unilateral odor deprivation experiments, P0 mice were anesthetized by hypothermia and the external opening of one of their nostrils was cauterized. Animals were sacrificed at P6, P12, P15, P18, and P20 to obtain coronal frozen sections for in situ hybridization.
Constructs and protein purification
TARSH full length cDNA was amplified from P6 OB. 5′-RACE experiment was performed to confirm the transcription initiation site. Fusion constructs, TARSH-GFP and TARSH-Myc, contained full length cDNA of isoforms 4 with a tag at the 3′ end of the gene. For the lentiviral construct, TARSH-GFP was subcloned into pFUW and viral production was performed as described (Lois et al., 2002). For culture experiments, RFP (MCherry) (Shaner et al., 2004) and TARSH cDNA were cloned into pIRES (BD Bioscience) to produce MCherry-IRES-TARSH. To purified TARSH protein, TARSH-GFP plasmid was transfected into 293T cells and the medium was collected for immunoprecipitation with anti-GFP antibody (Rockland) and protein G agarose (Roche). Purified TARSH-GFP proteins were evaluated and quantified by SDS-PAGE.
Cell cultures
COS-7 cells were cultured with DMEM plus 10% FBS. Neuro-2a cells were cultured in Eagle's Minimum Essential Medium (ATCC) plus 10% FBS for propagation. Reduced serum medium (2% FBS) was used to promote the differentiation of Neuro-2a cells. For OB dissociated cultures, embryonic OBs (E14 to E17) were dissociated with 0.08% trypsin at 37°C for 15 minutes and triturated for 10 times afterward. Cells were seeded on poly-D-lysine and Laminin-coated cover glass at a density of 1×10⁵/cm2. After cells were settled on the cover glass, each cover glass was placed on top of a cortical astrocyte feeder layer and maintained through the culture period. For the interneuron experiment, dissociated OB cells were directly seeded on an astrocyte feeder layer. Culture medium contained Neurobasal medium (Invitrogen) plus L-glutamate, B27, N2 supplement, and gentamicin. For KCl treatment, 25 mM KCl was added in the culture medium for the duration described in the Results section. Dissociated olfactory sensory neuron cultures were performed as previously described (Chen et al, 2008). In brief, E16-E18 OE was dissected from the nasal cavity. After 40 min incubation in 2 mg/ml dispase at room temperature, olfactory neuroepithelia were separated from the underlining stroma and treated with 0.05% trypsin for dissociation. Dissociated cells were plated at the density of 5×10⁴ cells/cm2 on confluent cortical astrocyte feeder layers and maintained in Waymouth's MB 752/1 medium with N2 supplement. Cells were transfected with Lipofectamine2000 Reagent (Invitrogen) and fixed with 4% paraformaldehyde for 15 minutes for subsequent immunostaining.
Immunostaining and image analysis
A polyclonal rabbit antibody was generated (Washinton Biotechnology) against a mouse TARSH fragment (antigen: 269-462 aa, His tagged at the N-terminus). TARSH antibody specificity was tested and described in Supplementary Fig. 1. Mice were perfusion fixed and subsequently immersion post-fixed overnight with 4% paraformaldehyde plus 2mM MgCl2 and 5mM EGTA in phosphate buffered saline. Tissues were cryo-protected with 30% sucrose in phosphate buffer. Sagittal frozen sections at 20 μm thickness were obtained. Dilution factors for the primary antibodies: anti- TARSH 1:500, anti-Tbx21 1:10K (courtesy of Dr. Yoshihiro Yoshihara), anti-GFP (Rockland) 1:1K, anti-PDI (Affinity BioReagents) 1:100, anti-RFP (MBL) 1:1000, and anti-β-Tubulin (Sigma) 1:200. Images were taken with fluorescence microscope (Nikon Eclipse TE200) or confocal microscope (Zeiss LSM510). For Sholl analysis, the number of intersections across the circumference at a 10 μm-interval distance from the cell body was counted. Mitral cells were selected when the nucleus diameters were bigger than 12 μm. Neurite length and dendritic field size were measured with ImageJ software.
Western blotting
For TARSH secretion experiments, COS-7 and Neuro-2a cells were infected with lentivirus carrying the TARSH-Myc expression construct. Culture medium was collected 3 days after adding the lentivirus and replaced with fresh culture medium. Cells were scraped with lysis buffer and sonicated for 5sec. Lysis buffer contained 50mM Tris-HCl, 0.5M NaCl, 0.2mM EDTA, and 1.5% Triton-X100. For deglycosylation experiment, culture medium was treated with PNGase F (NEB) according to manufacturer's protocol. For BFA experiment, 293T cells were transfected with TARSH-GFP plasmids and cells were first treated with BFA (Sigma) for 2 hours. After washed with PBS, cells were incubated with BFA overnight at 37°C culture incubator. Control cells were treated with vehicle ethanol in parallel. For all experiments, membranes were blocked with 3% bovine serum albumin for 1 hour and subsequently hybridized with primary antibody for 1 hour. Horseradish peroxidase-conjugated secondary antibodies were incubated with the membranes for 1 hour. Signals were detected with ECL system (Amersham Life Science). Primary antibody dilution: anti-c-Myc (Molecular Probes) 1:2K, anti-GFP (Rockland) 1:1K.
Results
Differential expressed gene are identified in developing mouse OB
Genetic programs regulate the development of the olfactory system (Luo & Flanagan, 2007). To gain insight into transcriptional differences in the developing OB, we conducted a genome-wide screen to compare transcription profiles of embryonic and early postnatal OBs. Probes prepared from embryonic day 16 (E16) and postnatal day 6 (P6) OB were hybridized to mouse genome microarrays (Affymetrix), including both known- and predicted-genes. Differentially expressed genes were identified with dChip software (Li & Wong, 2001) using E16 chips as the expression baseline. 531 genes were differentially expressed more than 2-fold (P ≤ 0.05) (Supplementary Table 1). Among these differentially expressed genes, 295 genes were up-regulated while 236 genes were down-regulated in P6 OB. We selected 20 up-regulated genes to validate their transcriptional changes by quantitative RT-PCR. Up-regulation of all selected genes was confirmed (data not shown).
Many cell differentiation events occur in developing OB between E16 and P6, including mitral cell dendritic elaboration and refinement, interneuron migration and differentiation, and granule cell dendritic outgrowth and synapse formation. To examine whether OB developmental events are concurrent with transcriptional regulations, we examined and plotted transcription trends of selected genes in developing OB from E14 through P10. Several genes were shown continuous up- or down-transcription trends. As an example, PRG-1, Pcdh20, and Slitrk4, which were detected as up-regulated genes in microarray experiments, showed continuous increase of transcription level in OBs (Fig. 1A). Ngn2 expression, however, was continuously down-regulated, which is consistent with the result from the microarray screen (Fig. 1A).
Figure 1. Dynamic and cell type specific gene expression in the developing OB.

(A) Transcription dynamics of candidate genes in developing OB. Differentially expressed genes were identified by microarray experiments comparing E16 and P6 OBs transcription profiles. Transcription levels of selected genes were examined by quantitative RT-PCR and normalized to β-actin levels at different developmental time points (E14-P10). Continuously increased transcription trend was observed with upregulated candidate genes, such as PRG-1, Pcdh20, and Slitrk4. Downregulated candidate genes, Ngn2, showed continuously decrease of transcription level. (B) Expression patterns of upregulated candidate genes on sagittal sections of P6 OB. Rostral tips of the OB were pointing to the left. In situ hybridization was used to examine transcript distribution and identify cell-type specific gene in P6 OB. Postnatally upregulated canidate genes, such as Mef2c, RGS4, and Camk2b were expressed in multiple types of neurons, including mitral cells (ML), tufted cells, granule cells (GCL), periglomerular cells (arrows). Candidate genes, AK018172, Nmb, and Tbx21, were specifically expressed in mitral cells but not other neuronal types in P6 OB. GL, glomerular layer. Scale bars, 100 μm.
The transcription level differences could result from multiple types of neurons undergoing different cellular events in early postnatal OB. For instance, postnatally generated interneurons, including periglomerular cells and granule cells, migrate into the OB and extend dendritic processes (Hinds, 1968; Luskin, 1993) while mitral cells prune their dendritic processes and specify apical dendrite targets (Blanchart et al., 2006). We hypothesized that cell-type specific transcripts may regulate cell-type specific cellular events during development. Hence, upregulated genes that are specifically expressed in the mitral cell at P6 may participate in mitral cell dendritic pruning event. To identify mitral cell-specific genes, we performed in situ hybridization to examine the expression patterns of 30 upregulated candidate genes in P6 OB. We observed genes that were selectively expressed in multiple types of neurons, including myocyte enhancer factor 2C (Mef2c), regulator of G-protein signaling 4 (RGS4), and calcium/calmodulin-dependent protein kinase II, beta (Camk2b) (Fig. 1B). We also observed genes that were specifically expressed in mitral and tufted cells but not other neuronal types in P6 OB, including AK018172, neuromedin B (Nmb), and T-box 21 (Tbx21) (Fig. 1B). Transcription factor Tbx21 was previously shown to restrictedly expressed by mitral/tufted cells (Faedo et al., 2002; Yoshihara et al., 2005) and therefore served as a positive control for in situ hybridization experiments (Fig. 1B).
TARSH expression is restricted in mitral and tufted cells in the early postnatal OB
TARSH (GeneID: 320712) was one of the highest up-regulated genes (12-fold) identified by microarray screening (Supplementary Table 1)and also showed mitral cell specific expression by in situ hybridization.We examined the dynamics of TARSH transcripts in developing OB from E14 to P35 using quantitative RT-PCR. TARSH expression was continuously up-regulated from E14 to P6. TARSH transcript levels were highest at P6 and down-regulated afterwards (Fig. 2A). A similar time course of TARSH expression was also observed by in situ hybridization. TARSH signals were first detected in the OB at E18 (Fig. 2B and C), maintained through P6 (Fig. 2D and E), and diminished at P20 (Fig. 2F). TARSH transcripts were restricted in mitral and tufted cell layers in the OB (Fig. 2C-E). Furthermore, we demonstrated that TARSH transcripts were expressed in the same cell population identified by a mitral and tufted cell marker, Tbx21 (Fig. 2G). These results showed that TARSH transcripts were transiently expressed in mitral/tufted cells during the first two postnatal weeks (Table 1). This transcription dynamics correlates with the developmental time course of mitral cell dendritic refinement (Lin et al., 2000).
Figure 2. Transient TARSH expression in mitral and tufted cells of the olfactory bulb.

(A) The transcription level of TARSH was examined by quantitative RT-PCR using mRNA from E14-P35 OB. TARSH transcripts continuously increased from E14, peaked around P6, and decreased after P10. (B-F) In situ localization of TARSH transcripts in the developing OB. TARSH signals were first detected in the mitral/tufted cell layer (ML) at E18 (C). TARSH expression was restricted in mitral (ML) and tufted cell layers at P3 (D) and P6 (E). At P20, TARSH expression was not observed in the OB (F). (G) Fluorescent in situ localization of TARSH transcripts (green) in the same cell population stained with mitral cell antibody marker Tbx21 (red) in the P6 OB. Blue, DAPI. GL, glomerular layer. Scale bars: (B-F), 100 μm; (G), 25 μm.
Table 1.
TARSH expression in developing olfactory system
| E16 | E18 | PO | P3 | P6 | P10 | P20 | P30 | P90 | |
|---|---|---|---|---|---|---|---|---|---|
| OB | − | + | + | + | + | + | − | − | − |
| AOB | − | − | − | − | − | − | − | ||
| AON | + | + | + | + | + | +/− | − | ||
| OT | − | − | − | − | |||||
| PC | + | + | + | +/− | |||||
| EC | + | + | + |
OB, olfactory bulb; AOB, accessory olfactory bulb; AON, anterior olfactory nucleus; OT, olfactory tubercle; PC, piriform cortex; EC entorhinal cortex.
TARSH expression is dynamically regulated in cortical regions of the main olfactory pathway
We further examined the expression of TARSH transcripts in different regions of the brain by RT-PCR. At P6, TARSH was expressed in the OB, the AON, and the PC (Fig. 3A). TARSH transcription was low in the neocortex and not detectible in other regions of the brain, namely the cerebellum, hippocampus and brainstem. On whole brain sagittal sections, consistent with RT-PCR results, TARSH transcripts were detected in the OB and the AON but not other regions of the brain by in situ hybridization (Fig. 3B). In the OB, TARSH signals were specifically localized in mitral and tufted cell layers within the main OB, but not in the accessory olfactory bulb (AOB) (Fig. 3C). In the AON, TARSH was observed in layer II neurons between P0-P20 (Fig. 3C, 8A). TARSH was also detected in layer II neurons of the PC (Fig. 3D). In addition, we observed TARSH transcripts in cells sparsely distributed in the entorhinal cortex at P6-P20 (Table 1). Interestingly, TARSH signals were absent in brain regions of the accessory olfactory system, including the AOB (Fig. 3C) and accessory olfactory cortices (data not shown). Though RT-PCR signals were observed in nasal tissue, no TARSH expression was detected in the olfactory neuroepithelium (Supplementary Fig. 3). Therefore, the expression of TARSH is restricted to neurons along the main olfactory pathway in the brain.
Figure 3. TARSH transcript expression in cortical regions of the main olfactory pathway.

(A) RT-PCR of TARSH transcripts in P6 brain tissues. TARSH transcripts were detected in regions of the olfactory pathway, namely olfactory bulb (OB), anterior olfactory nucleus (AON), and piriform cortex (PC). TARSH expression was low in the neocortex and not detected in other regions of the brain. β-Actin served as the loading control. (B) In situ hybridization with a TARSH antisense probe on a P6 whole brain section. TARSH signals were detected in the OB and AON, but not other brain regions. (C) TARSH expression in the developing OB and AON. At P6, TARSH was detected in mitral and tufted cell layers within the main OB and layer II neurons in the AON. At P20, TARSH expression in the AON remained while the expression in the OB diminished. TARSH hybridization signal was not detected in the accessory olfactory bulb (AOB). (D) TARSH expression in the PC. TARSH in situ hybridization signals were detected in layer II neurons of the PC at P20. An enlarged view of the region indicated with the square is shown on the right. Scale bars, 500 μm.
The temporal expression of TARSH varied in different regions along the olfactory pathway (Table 1). In the OB, TARSH was expressed in mitral/tufted cells starting at E18, persisted through P10, and diminished before P20 (Fig. 2, Table 1). In the AON and the PC, TARSH signals were observed in layer II neurons at early postnatal stages, maintained through P20, and diminished around P30 (Fig. 3, Table 1). Thus, the temporal expression pattern of TARSH is tightly regulated in the developing main olfactory system.
To investigate TARSH's subcellular localization, we generated a polyclonal antibody against mouse TARSH (antibody specificity was shown in Supplementary Fig. 1). Immunohistochemistry was performed to examine TARSH expression patterns in regions of the main olfactory pathway at P6. TARSH expression was not detected in the olfactory sensory neurons (Supplementary Fig. 3). Consistent with in situ results, TARSH immunostaining was observed in mitral and tufted cell layers in the OB (Fig. 4A-C). In the AON and the PC, TARSH expression was present in layer II neurons (Fig. 4D-I). TARSH staining signals was localized to the cell bodies and appears to be concentrated at the base of apical dendrites. This subcellular localization was not only observed in mitral and tufted cells in the OB (Fig. 4C) but also in layer II neurons of the AON and the PC (Fig. 4F, 4I).
Figure 4. TARSH protein expression pattern in the olfactory pathway.

Immunohistochemical localization of TARSH in brain regions of the main olfactory pathway at P6. (A-C) In the OB, TARSH signals (red) were detected in the mitral cell layer (ML) and tufted cells next to the glomerular layer (GL), shown by DAPI counterstaining (blue). (D-F) In the AON, TARSH (red) was detected in layer II neurons (DAPI, blue). (G-I) In the PC, TARSH (red) was also detected in layer II neurons (DAPI, blue). Higher magnification confocal images of the equivalent square regions indicated in (B, E, H) were shown in (C, F, I). TARSH was expressed by pyramidal shaped neurons (arrows) in OB (C), AON (F) and PC (I). (J-L) By confocal imaging, TARSH (red) immunostaining partially overlap with GM130 (green), a cis-Golgi compartment marker which is enriched at the base of mitral cell apical dendrites (arrows). Mitral cells were identified by Tbx21 expression (blue). (M-O) Higher magnification confocal images of the square region indicate in (I). TARSH (red) subcellular distribution was perinuclear and at the base of apical dendrites (arrow) in PC neurons. GM130 (green) immunoreactivity partially overlaps with TARSH expression. Scale bars: (A-H), 100 μm; (J-O), 50 μm.
We further validated that TARSH is distributed in the apical dendritic shafts by co-immunostaining with GM130. GM130 is a marker for the cis-Golgi compartment. It has been demonstrated that GM130 signal is enriched at the base of pyramidal neuron apical dendrites (Horton et al., 2005). In mitral and tufted cells, we observed that GM130 signals were also concentrated at the base of apical dendrites (Fig. 4J). Under high magnification using confocal imaging, TARSH immunostaining appears to overlap largely with GM130 (Fig. 4J-L). A similar distribution was also observed in layer II neurons of olfactory cortical regions (Fig. 4M-O). These results suggest that TARSH protein is distributed in apical dendrites of pyramidal neurons along the main olfactory pathway. In addition, co-localization of TARSH and GM130 invokes the possibility that TARSH is trafficked through the secretory pathway.
TARSH is a secreted protein
TARSH (also known as Abi3bp) was named based on its interaction with the SH3 domain of Abelson interacting protein 3 (Abi3) as identified through a yeast two-hybrid screen (Matsuda et al., 2001). However, TARSH protein has a predicted signal peptide which suggests that TARSH could potentially be a secreted extracellular protein. Here, we provide evidence to demonstrate that TARSH is a secreted protein. Firstly, we examined the 5'-end mRNA sequence of TARSH transcript by 5′-RACE using P6 OB cDNA. Consistent with the published sequence (Uekawa et al., 2005), predicted signal peptide sequence was present in TARSH cDNA amplified from the OB. Secondly, we investigated the subcellular localization of TARSH in transfected cells. In COS-7 cells, ectopically expressed TARSH appeared to overlap with the endoplasmic reticulum (ER) marker, Protein disulphide isomerase (Fig. 5A-C). This subcellular distribution suggests that TARSH is distributed in the ER vesicular secretory pathway.
Figure 5. TARSH is a secreted protein.
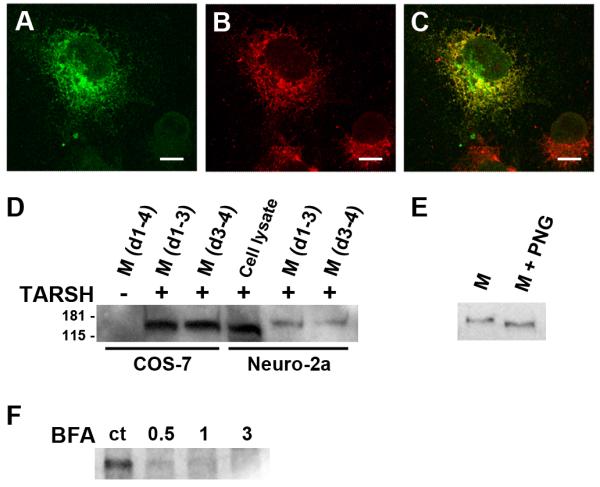
(A-C) TARSH distribution in COS-7 cells. Ectopically expressed TARSH-GFP (green) overlaps with the ER network marker PDI (red). TARSH was distributed in the ER secretory pathway. (D) Detection of TARSH in the media by Western blotting. TARSH-Myc expression construct was introduced into COS-7 and Neuro-2a cells by lentivirus. TARSH was detected in the culture medium (M) of both COS-7 and Neuro-2a cells 3 days after infection (d1-3). TARSH was also detected at day 4 after replacing culture medium at day 3(d3-4) suggesting that the release of TARSH was not from lysed cells. (E) Deglycosyaltion of TARSH protein. When the medium was treated with N-glycosidase (PNG), the molecular weight of TARSH reduced. (F) Blockage of TARSH secretion. When cells were treated with secretion inhibitor brefeldin A (BFA) at indicated concentrations (μg/ml), the release of TARSH into the medium was blocked. Scale bars, 10 μm.
The secretion of TARSH was further examined by detecting its presence in the culture medium. The expression plasmid TARSH-Myc was transfected into COS-7 or Neuro-2a cells. The presence of TARSH in the culture medium was tested by Western blotting. TARSH protein was detected in the media from both transfected COS-7 and Neuro-2a cells 3 days after transfection (Fig. 5D). To exclude the possibility of cell lysis release of TARSH, culture medium was replaced and collected again 24 hours later. In both COS-7 and Neuro-2a cultures, TARSH was again detected in the culture medium (Fig. 5D). The molecular weight of TARSH in the media appeared larger than that in the cell lysate. To test whether the molecular weight shift was due to glycosylation, which is a characteristic of secreted proteins, we treated the medium with N-glycosidase (PNGaseF). PNGaseF treatment reduced the molecular weight of TARSH indicating TARSH proteins in the media were glycosylated (Fig. 5E).
The subcellular localization of TARSH in heterologous cells suggested that TARSH is trafficked through classical ER-Golgi secretory pathway. To further investigate this possibility, we blocked the secretion with brefeldin A (BFA) which disrupts the Golgi apparatus. Transfected cells were treated with BFA for 24 hours and the media were collected to analyze the changes of TARSH protein level. Compared to vehicle treated control media, TARSH level decreased dramatically with 0.5 μg/ml BFA and completely diminished with 3 μg/ml BFA (Fig. 5F). This result further supports that the secretion of TARSH is through ER-Golgi secretory pathway.
TARSH induces the reduction of dendritic complexity in mitral cells
To investigate the function of TARSH in regulating mitral cell dendritic complexity, we established a dissociated OB culture system. In this culture system, dissociated OB neurons were plated on coated cover glasses. Another cover glass with astrocyte feeder cells was placed in the same well to support the survival of OB neurons without direct cell contact. Mitral and tufted cells (referred as mitral cells thereafter) were identified by Protocadherin 21 expression (Nagai et al., 2005). All Protocadherin 21-positive cells have large nuclei (Supplementary Fig. 2A). In subsequent experiments, mitral cells were identified as cells with large nuclei (nuclear diameter >12 μm). We examined the endogenous TARSH expression in this culture system by immunocytochemistry. TARSH expression was not detected in cultured mitral cells at 8 to 11 DIV (Supplementary Fig. 2B).
To analyze mitral cell dendritic morphology, culture cells were transfected withfluorescent protein expression constructs. Mitral cell dendritic complexities were first compared between 8 and 11 DIV using Sholl analysis. No significant changes of dendritic complexity was observed within 130 μm radial distance from the cell body between 8 DIV and 11 DIV (Fig. 6A) (8 DIV, n = 21; 11 DIV, n = 16; t-test, P > 0.10). The stable dendritic complexity of cultured mitral cells within this time window allows examination of TARSH effects. As it was shown that TARSH was secreted in the medium by Neuro-2a cells (Fig. 5D), we collected conditioned medium (CM) from TARSH-expressing Neuro-2a cells and added into dissociated OB cultures. When treated with TARSH conditioned medium for 3 days (8 DIV to 11 DIV), mitral cells appear to have a less branched morphology when compared to that of the control cells. The dendritic complexity of mitral cells was analyzed by Sholl analysis. In TARSH treated mitral cells, intersection numbers, greater than 30 μm away from the soma, were reduced significantly (Fig. 6B) (control, n = 16; CM TARSH, n = 12; t-test, P < 0.05). A similar effect was observed when we transferred OB cells to the astrocyte (As) feeder layers transfected with TARSH expression constructs. With the presence of TARSH-overexpressing astrocytes (8 DIV to 11 DIV), the dendritic complexity of mitral cells reduced significantly once the distance was greater than 50 μm away from the soma (Fig. 6B) (control, n = 16; As TARSH, n = 11; t-test, P < 0.01). Therefore, TARSH appears to function as an extracellular factor to induce the reduction of mitral cell dendritic complexity. To validate that this effect is directly triggered by TARSH, we treated cultured mitral cells with purified TARSH proteins. Similar to TARSH conditioned medium, purified TARSH (500 ng/ml) induced significant reduction of mitral cell dendritic complexity (Fig. 6C) (control, n = 16; TARSH, n = 11; t-test, P < 0.01). Since mitral cells were cultured with cortical astrocytes, we further controlled the possible secondary effect derived from astrocytes under TARSH stimulation. In this set of control experiments, astrocyte feeder layers were exposed to TARSH proteins for 24hr prior to be transferred to mitral cell cultures. No significant difference in mitral cell dendritic complexity was observed between TARSH exposed astrocytes (As control) and the control (Fig. 6C) (control, n = 16; As control, n = 10; t-test, P > 0.05). This result indicates that the morphological changes of mitral cells are not mediated by TARSH treated astrocytes. The reduction of mitral cell dendritic complexity is a direct effect of TARSH.
Figure 6. TARSH induces the reduction of dendritic complexity in mitral cells.

Sholl analysis of mitral cell dendritic complexity in dissociated OB cultures. (A) Between 8 DIV and 11 DIV, the dendrite complexity of mitral cell transfected with control RFP plasmids (MC) did not change within 130 μm radial distance from the soma (P > 0.10). Treatments in (B-D) were applied to the cultures at 8 DIV and mitral cell dendritic complexity were evaluated at 11 DIV. (B) TARSH conditioned medium (CM TARSH) treatment induced significant reduction of mitral cell dendritic complexity compared to the control (MC) (>30 μm from the soma; P < 0.05). Similar effect was also observed when cultured mitral cells were transferred to an astrocyte feeder layer transfected with TARSH expression plasmids (As TARSH) (>50 μm from the soma, P < 0.01). (C) Purified TARSH protein (IP TARSH) induced significant reduction of mitral cell dendritic complexity compared to the control (MC) (>50 μm from the soma; P < 0.01). Astrocyes pre-exposed to purified TARSH protein (As control) did not alter mitral cell dendritic complexity. (D) Mitral cells overexpressing TARSH (MC-TARSH) showed significant reduction of dendritic complexity compared to the control (MC) (>30 μm from the soma; P < 0.05). Similar dendritic complexity reduction effect were also observed in non-transfected mitral cells visualized by GFP expression (GFP TARSH) (>30 μm from the soma; P < 0.05) when other cells in the same culture were overexpressing TARSH. Scale bars, 50 μm. t-test was used for all statistics. Values are mean ± s.e.m.
Based on the observation that mitral cells themselves express TARSH in vivo, we test whether TARSH can act as an autocrine factor (secreted by mitral cells and functions on the population itself) to regulate mitral cell dendritic complexity. Cultured mitral cells were transfected with TARSH expression construct to evaluate its effect on their own dendritic complexity. Mitral cells were transfected (at low frequency < 2%) at 8 DIV and their dendritic complexity was evaluated at 11 DIV by Sholl analysis. An overall reduction of dendritic complexity was observed in TARSH-expressing mitral cells (Fig. 6D) (control, n = 16; TARSH, n = 17; t-test, P < 0.05). It is possible that this dendritic morphological change is induced either by secreted TARSH protein or cytoplasmic function of TARSH expression. To test whether TARSH is indeed secreted into the culture media to induce mitral cell dendritic morphological changes, we examined mitral cells that were not transfected with the expression construct in the same culture. Cultured cells were sequentially transfected with MCherry-IRES-TARSH construct to mark TARSH expressing cells and GFP expression constructs to identify mitral cells that were not transfected by TARSH expression construct. The morphology of mitral cells which express GFP but not MCherry was analyzed. A similar dendritic complexity reduction was also observed in mitral cells that were not expressing TARSH (Fig. 6D) (control, n = 16; GFP TARSH, n = 12; t-test, P < 0.05). This result indicates that mitral cell dendritic complexity reduction is triggered by secreted TARSH. Therefore, TARSH can act as an autocrine factor to trigger mitral cell dendritic complexity reduction in vitro.
TARSH restricts neurite branching and outgrowth of OB interneurons but not olfactory sensory neurons
TARSH may function to regulate the morphology of other neuronal types in the OB. To investigate TARSH function in regulating neurite outgrowth of OB interneurons, we evaluated their morphology in the presence of TARSH when compared to controls. In the dissociated OB culture, 94% of the neurons were glutamic acid decarboxylase 67 (GAD67, the GABA-synthesizing enzyme)-positive cells (data not shown). GABAergic interneurons, including periglomerular cells and granule cells, form dendro-dendritic connections with mitral cells and are part of local inhibitory circuits in the OB (Mugnaini et al., 1984; Yokoi et al., 1995). With the presence of TARSH, the average dendritic field area of the interneurons was half the size of control ones (Fig. 7A) (control, 28943.5 ± 1427.6 μm2, n = 40; TARSH, 12567.8 ± 931.8 μm2, n = 31; t-test, P = 10−13), and the neurite complexity reduced at a radial distance of 30-100 μm from the soma (Fig. 7B) (control, n =18; TARSH, n = 18; t-test, P < 0.04). The smaller dendritic field and reduced neurite complexity were the result of less neurite branching and decreased neurite outgrowth of higher-order neurites (Fig. 7C) (secondary neurite: control, 23.6 ± 2.0, n = 21; TARSH, 16.2 ± 1.4, n = 21; t-test, P = 0.004. tertiary neurite: control, 12.5 ± 1.2, n = 21; TARSH, 5.1 ± 0.7, n = 21; t-test, P = 10−6). The neurite length of secondary and tertiary neurites was shorter in the presence of TARSH (Fig. 7D) (secondary neurite: control, 22.9 ± 1.7 μm, n = 21; TARSH, 18.0 ± 1.1 μm, n = 21; t-test, P = 0.01. tertiary neurite: control, 10.2 ± 0.8 μm, n = 21; TARSH, 6.1 ± 0.7 μm, n = 21; t-test, P = 10−4). In contrast to higher-order neurite branches, primary neurite number and length were not significantly affected by TARSH (Neurite number: control, 4.0 ± 0.3, n = 21; TARSH, 3.6 ± 0.2, n = 30; t-test, P = 0.26. Neurite length: 121.9 ± 8.0 μm, n = 21; TARSH, 107.7 ± 6.0 μm, n = 30; t-test, P = 0.15). Thus, TARSH restricts higher-order neurite branching and outgrowth of GABAergic OB interneurons.
Figure 7. TARSH restricts neurite outgrowth of OB interneurons but not olfactory sensory neurons.

(A) Morphology of OB interneurons. Astrocyte feeder layers were transfected with RFP plasmid (MC) or the TARSH expression construct (MC-TARSH). Interneurons were transfected with GFP plasmids to visualize their morphology. The neurite complexities of the interneurons decreased significantly at a distance of 40–120 μm away from the soma when TARSH is present in the media (t-test, P-value < 0.04) (B). With astrocyte expressing TARSH, total neurite branch number reduced 43% (MC n=21; MC-TARSH n=30) (C). Fewer secondary and tertiary branches were observed, while primary branch number did not change (C). The neurite lengths of secondary and tertiary branches were also shorter in the presence of TARSH (D). (E) Morphology of olfactory sensory neurons. Cell morphology was visualized by β-tubulin staining. A bipolar morphology of the olfactory sensory neuron was observed in the presence of MC-TARSH expressing astrocytes. (F) The axonal-like neurite length of olfactory sensory neurons was not affected by the presence of TARSH (MC n=58; MC-TARSH n=43). Scale bars, 20 μm. *, t-test, P-value < 0.01. Values are mean ± s.e.m.
We also examined the effect of TARSH on axon outgrowth of olfactory sensory neurons with olfactory sensory neuron dissociated cultures. The morphology of cultured olfactory sensory neurons resembles the in vivo bipolar morphology: one short dendritic-like and one long axonal-like process (Fig. 7E). With the presence of TARSH, olfactory sensory neuron morphology remained bipolar similar to control cells. The axonal-like neurite length was similar with or without TARSH expressed by the feeder layer cells (Fig. 7F) (control, 132.6 ± 8.3 μm, n = 58; TARSH, 146.2 ± 11.2 μm, n = 43; t-test, P = 0.32). Therefore, TARSH did not affect axonal outgrowth of the olfactory sensory neuron.
TARSH expression and function are independent of neuronal activity
Sensory experience is required for precise systematic connections to occur in the OB (Zou et al., 2004; Zou et al., 2007). Blocking sensory input changes gene expression in the OB (Klintsova et al., 1995) and slightly slows the dendritic maturation process of mitral cells (Lin et al., 2000; Matsutani & Yamamoto, 2000). Is TARSH expression dependent upon olfactory sensory stimulation? We investigated this possibility by performing unilateral naris closure at P0 to block odor-induced activity. We examined the TARSH expression pattern at different developmental time points by in situ hybridization to compare brain regions ipsilateral and contralateral to naris closure. TARSH expression in mitral/tufted cells within the main OB and layer II neurons in the AON showed no difference between the open and closed sides (Fig. 8A). The temporal expression patterns of TARSH in OB, AON, and PC were also not disturbed by odor deprivation in unilateral naris closure mice. We further investigated TARSH expression in adenylyl cyclase 3 (AC3) knock-out mice. AC3 is one of the key components in olfactory receptor-mediated signaling cascade and participates in the activity-dependent refinement process to coalesce olfactory sensory neuron axons (Wong et al., 2000; Zou et al., 2007). To test whether loss of AC3 function alters TARSH transcription regulation, we examined TARSH expression in AC3 knock-out mice. Again, the temporal and spatial expression patterns of TARSH were the same as wild-type mice (Fig. 8B). Thus, TARSH expression is independent of AC3-mediated odorant activity.
Figure 8. TARSH expression and function are independent of neuronal activity.

(A) In situ hybridization of TARSH in unilateral naris closure mice. No difference in Opg in situ signals were observed in the OB and AON at P6 and P15 between ipsilateral (solid arrows) or contralateral (open arrows) sides of the naris closure. The transient expression time window of Opg in the mitral/tufted cell and AON was not affected by odor deprivation. *, AOB. Scale bars, 200 μm. (B) TARSH expression in the OB, AON, and PC was not altered in AC3 knock-out mice. (C) Mitral cell morphology after KCl treatment. Mitral cell morphology was visualized by transfecting with GFP expression plasmids. Mitral cells were treated with 25mM KCl for 24 hour before being fixed at 8 DIV. Dendritic complexity and total dendrite length (within 200 μm radial distance) were reduced significantly when treated with KCl. (D) Mitral cell morphology was influenced by TARSH and neuronal activity. Mitral cell morphology was visualized by MCherry expression (MC). Overexpressing TARSH (MC-TARSH) in the mitral cell reduced dendritic complexity and decreased dendrite length by 30%. More severe reduction of dendritic complexity and dendrite length were observed when MC-TARSH mitral cells were treated with KCl at threshold duration (8 hour) before being fixed at 11 DIV. Scale bars, 50 μm. t-test, *p-value =0.04; **p-value ≤ 0.01. Values are mean ± s.e.m.
We further tested whether TARSH function is affected by neuronal activity in vitro. High KCl concentration (25mM) causes membrane depolarization and is used routinely to test the effect of neuronal activity on cultured neurons. Chronic KCl depolarization was shown to increase neuronal survival and induce morphological changes of many types of neurons (Gallo et al., 1987; Franklin & Johnson, 1992; Redmond et al., 2002; Jin et al., 2003). Here we first tested the effects of KCl treatment on the changes of mitral cell dendritic morphology. When treated with 25 mM KCl for 24 hours starting at 7 DIV, mitral cell dendritic complexity was reduced significantly at a radial distance of 40-120 μm from the soma (Fig. 8C) (control, n = 11; KCl, n = 13; t-test, P < 0.03). Total dendrite length within 200 μm radial distance was reduced 40% (Fig. 8C) (control, 1156 ± 83 μm, n = 11; KCl, 696 ± 63 μm, n = 13; t-test, P = 104). Therefore, chronic KCl treatment resulted in shorter dendrite length and simplified dendritic complexity in mitral cells. We had shown that overexpressing TARSH causes reduction of dendritic complexity in mitral cells. Furthermore, ectopic TARSH expression induced a 30% reduction of mitral cell dendrite length within dendritic field within 200 μm in diameter when compared to the control (Fig. 8D) (control, 1233 ± 139 μm, n = 16; TARSH, 879 ± 65 μm, n = 17; t-test, P = 0.02). To investigate the relationship between TARSH-regulated and activity-mediated mitral cell dendritic morphology changes, we treated mitral cells overexpressing TARSH with KCl at the threshold duration. When mitral cells were treated with KCl for 8 hours before fixation, dendritic complexity started to reduce near the cell body (Fig. 8D) (control, n = 16; KCl, n = 13; 40 μm, t-test, P = 0.02). Though slightly increased dendritic complexity was observed at distal regions, it was not significantly different from control experiments and total dendrite length within 200 μm radial distance also did not change significantly (Fig. 8D) (control, 1233 ± 139 μm, n = 16; KCl, 1441 ± 115 μm, n = 13; t-test, P = 0.27). When TARSH-overexpressing mitral cells were treated with KCl for 8 hours before fixation, dendritic complexity reduced significantly around the cell body (Fig. 8D) (TARSH, n = 17; TARSH+KCl, n = 13; 30, 60, 70 μm, t-test, P < 0.04) and dendrite length was also reduced more severely than in cells expressing TARSH alone (Fig. 8D) (TARSH, 879 ± 65 μm, n = 17; TARSH+KCl, 694 ± 59 μm, n = 10; t-test, P = 0.04). Thus, TARSH can function independent of neural activity to promote the reduction of dendritic complexity in mitral cells in vitro.
Discussion
From a genome-wide microarray screen, we identified TARSH as a mitral/tufted cell-specific gene in the developing OB. The temporal expression pattern of TARSH is correlated with the time course of postnatal refinement of mitral cell dendrites. We further demonstrate that TARSH is a secreted factor which functions to promote the reduction of dendritic complexity in mitral cells and to restrict neurite outgrowth and branching in interneurons in vitro. TARSH is also expressed in pyramidal neurons in multiple main olfactory cortical regions. To our knowledge, TARSH is the first gene to show such restricted yet systematic expression across multiple relays along a particular sensory pathway.
TARSH (also known as Abi3bp) is named for its binding with the SH3 domain of Abelson interacting protein 3 (Abi3) in a yeast two-hybrid screen (Matsuda et al., 2001). However, the intracellular interaction between Abi3 and TARSH was not validated by any other biochemical or cell biological approaches. TARSH has a signal peptide sequence and potentially could be a secreted molecule. In this study, we provide several lines of evidence to support that TARSH is a secreted protein: 1) The subcellular distribution of TARSH overlaps with secretory compartment markers in both heterologous cells and mitral cells, 2) TARSH is detected in culture medium of heterologous cells transfected with expression construct, 3) The release of TARSH can be blocked by inhibiting secretion, and 4) Extracellular TARSH is gylcosylated which a characteristic of secreted proteins. However, we do not rule out the possibility that an intracellular form of TARSH also exists, particularly in non-neuronal cells, and could interact with Abi3.
Several secreted molecules are known to refine neuronal connections in the central nervous system. Stereotyped axonal pruning of hippocampal neurons is triggered by secreted semaphorins to activate the Plexin signaling pathway (Cheng et al., 2001; Bagri et al., 2003). Neuronal pentraxins, another class of secreted proteins, are necessary for early synaptic refinement in mammalian retina and dorsal lateral geniculate nucleus (Bjartmar et al., 2006). The timed onset of semaphorin 3A expression during development triggers the elimination of hippocampal mossy fiber and pyramidal axon branches. Interestingly, TARSH expression in the developing OB is temporally correlated with the postnatal dendritic refinement of mitral cells. TARSH protein expression is restricted in the mitral and tufted cells in the OB. We demonstrated that TARSH proteins are localized at the apical dendritic shafts of mitral cells and can be transported along the dendrites. In vitro experiments indicate that soluble TASRH induces the reduction of mitral cell dendritic complexity, suggesting that mitral cells are able to response to secreted TARSH. Thus, TARSH may function as an autocrine factor in mitral cells. This proposed mechanism is further substantiated by the fact that mitral cell dendritic complexity was significantly reduced in cultured mitral cells overexpressing TARSH themselves. In supporting the fact that mitral cells are capable of responding to self-secreted TARSH, we investigated whether mitral cells in the OB bind to soluble TARSH in situ. Using tagged TARSH protein as a probe, we evaluate the binding sites of TARSH on fresh OB sections. Binding signals were observed on the surface of mitral cells' somas and dendritic processes (data not shown). Evidence was reported that the development of neuronal connections can be regulated by secreted factors via an autocrine mechanism (Lacmann et al., 2007; Ting et al., 2007; Sanchez-Camacho & Bovolenta, 2008). In Drosophila visual system, the migration of R7 axonal growth cone is regulated by self expressed dActivin (Ting et al., 2007). In the hippocampal network, activity-dependent release of TGF-β exerts autocrine actions and activates its own signaling pathway (Lacmann et al., 2007). A recent study demonstrated that autocrine mechanism plays important function in axonal growth and guidance in mammalian visual system (Sanchez-Camacho & Bovolenta, 2008). Sonic hedgehog is expressed by contra-lateral projection retinal ganglion cells (RGC). Disruption of sonic hedgehog signaling in contra-lateral projecting RGC results in abnormal axonal projections of these neurons, suggesting an autocrine mechanism of sonic hedgehog for this neuronal population. In this study, we provided evidence to support that TARSH may also be an autocrine factor that regulates dendritic refinement of the mitral cell population. In addition, TARSH functions to inhibit interneuron dendritic growth in vitro indicating that TARSH may act as a paracrine factor as well. Whether TARSH is required for mitral cell dendritic refinement and interneuron dendritic maturation in vivo needs to be further examined. Knockout mice are being generated to investigate TARSH function in vivo.
TARSH was reported to be expressed only in the brain and lung among tissues examined (Uekawa et al., 2005). Consistent with previous findings, we detected TARSH expression in the brain. Interestingly, TARSH is exclusively expressed in multiple areas along the main olfactory pathway, including OB, AON, PC, and entorhinal cortex, while it is absent in accessory olfactory system and other regions of the brain. The synaptic connections in the OB are refined within the first two postnatal weeks to coalesce olfactory sensory neuron axons and remodel mitral cell dendrites (Malun & Brunjes, 1996; Matsutani & Yamamoto, 2000; Zou et al., 2004). The temporal expression of TARSH in mitral cells is correlated with this developmental event. In the main OB, mitral cells extend elaborate dendritic trees during embryonic development and prune dramatically to bear only a single apical dendrite during early postnatal stages. In wild-type mice, 71% of mitral cells achieve single apical dendrite morphology at P6 and this pruning process completes by P10 (Lin et al., 2000; Matsutani & Yamamoto, 2000). TARSH gene expression is up-regulated between P0-P6 and down-regulated afterwards, which is correlated with the time course of mitral cell dendritic pruning. On the other hand, in the AOB, mitral cells do not undergo dendritic pruning. All mitral cells in the AOB bear multiple apical-oriented dendritic processes (Brennan, 2001). The differences in dendritic remodeling between main OB and AOB are also correlated with the differences in TARSH expression.
Both sensory experience and intrinsic genetic programs are important for the establishment and maintenance of precise neuronal connections in many sensory modalities (Katz & Shatz, 1996; Zou et al., 2004). In the olfactory system, blocking sensory input perturbs the consolidation phase of the olfactory sensory neuron axon convergent process (Zou et al., 2004; Zou et al., 2007), and slows the dendritic remodeling process of the mitral cell (Lin et al., 2000; Matsutani & Yamamoto, 2000). It is also established that, despite a delay, dendritic pruning of mitral cells was able to complete without the presence of odor-evoked activity (Lin et al., 2000). In the Drosophila olfactory system, intrinsic genetic programs specify the projection of the second-order neuron. Stereotyped axonal and dendritic targeting patterns are determined by cell lineage and birth order (Jefferis et al., 2001; Marin et al., 2002; Lin et al., 2007). In addition, POU domain transcription factors and graded membrane molecule expression also plays critical roles in the targeting specificity of the projection neurons for the establishment of precise connections (Komiyama et al., 2003; Komiyama et al., 2007). In the vertebrate olfactory system, lineage relationship of mitral cells does not appear to involve in their dendritic targeting specificity (Reid et al., 1999). The molecular mechanism which regulates mitral cell dendritic patterning remains elusive in mice. Here we demonstrated that TARSH induces the reduction of mitral cell dendritic complexity and its developmental expression is independent of odor-evoked activity. Whether TARSH is required for mitral cell dendritic pruning needs to be further study in vivo.
Supplementary Material
Acknowledgements
We thank Kent Erickson for the use of the LightCycler, and the UCD Microarray Core Facility for assistance with microarray experiments. Yoshihiro Yoshihara generously provided the Tbx21 and Pcdh21 antibody and Ken Beck provided the PDI antibody. Lentiviral plasmids and MCherry coding fragment were gifts from Carlos Lois and Roger Tsien. AC3 knock-out brains were courtesy of Dong-Jing Zou. We also thank Richard Tucker, Hwai-Jong Cheng and Tyler Cutforth for critical reading of the manuscript. This investigation was conducted in a facility constructed with support from Research Facilities Improvement Program Grant Number C06 RR12088-01 from the National Center for Research Resources, National Institutes of Health. This study is supported by National Institutes of Health (grant R01-DC006015 to Q.G.) and National Science Foundation (grant IBN0324769 to Q.G.).
References
- Bagri A, Cheng HJ, Yaron A, Pleasure SJ, Tessier-Lavigne M. Stereotyped pruning of long hippocampal axon branches triggered by retraction inducers of the semaphorin family. Cell. 2003;113:285–299. doi: 10.1016/s0092-8674(03)00267-8. [DOI] [PubMed] [Google Scholar]
- Bjartmar L, Huberman AD, Ullian EM, Renteria RC, Liu X, Xu W, Prezioso J, Susman MW, Stellwagen D, Stokes CC, Cho R, Worley P, Malenka RC, Ball S, Peachey NS, Copenhagen D, Chapman B, Nakamoto M, Barres BA, Perin MS. Neuronal pentraxins mediate synaptic refinement in the developing visual system. J Neurosci. 2006;26:6269–6281. doi: 10.1523/JNEUROSCI.4212-05.2006. [DOI] [PMC free article] [PubMed] [Google Scholar]
- Blanchart A, De Carlos JA, Lopez-Mascaraque L. Time frame of mitral cell development in the mice olfactory bulb. J Comp Neurol. 2006;496:529–543. doi: 10.1002/cne.20941. [DOI] [PubMed] [Google Scholar]
- Brennan PA. The vomeronasal system. Cell Mol Life Sci. 2001;58:546–555. doi: 10.1007/PL00000880. [DOI] [PMC free article] [PubMed] [Google Scholar]
- Chen H, Kohno K, Gong Q. Conditional ablation of mature olfactory sensory neurons mediated by diphtheria toxin receptor. J Neurocytol. 2005;34:37–47. doi: 10.1007/s11068-005-5046-8. [DOI] [PubMed] [Google Scholar]
- Cheng HJ, Bagri A, Yaron A, Stein E, Pleasure SJ, Tessier-Lavigne M. Plexin-A3 mediates semaphorin signaling and regulates the development of hippocampal axonal projections. Neuron. 2001;32:249–263. doi: 10.1016/s0896-6273(01)00478-0. [DOI] [PubMed] [Google Scholar]
- Faedo A, Ficara F, Ghiani M, Aiuti A, Rubenstein JL, Bulfone A. Developmental expression of the T-box transcription factor T-bet/Tbx21 during mouse embryogenesis. Mech Dev. 2002;116:157–160. doi: 10.1016/s0925-4773(02)00114-4. [DOI] [PubMed] [Google Scholar]
- Franklin JL, Johnson EM., Jr. Suppression of programmed neuronal death by sustained elevation of cytoplasmic calcium. Trends Neurosci. 1992;15:501–508. doi: 10.1016/0166-2236(92)90103-f. [DOI] [PubMed] [Google Scholar]
- Gallo V, Kingsbury A, Balazs R, Jorgensen OS. The role of depolarization in the survival and differentiation of cerebellar granule cells in culture. J Neurosci. 1987;7:2203–2213. doi: 10.1523/JNEUROSCI.07-07-02203.1987. [DOI] [PMC free article] [PubMed] [Google Scholar]
- Haberly LB, Price JL. The axonal projection patterns of the mitral and tufted cells of the olfactory bulb in the rat. Brain Res. 1977;129:152–157. doi: 10.1016/0006-8993(77)90978-7. [DOI] [PubMed] [Google Scholar]
- Hinds JW. Autoradiographic study of histogenesis in the mouse olfactory bulb. I. Time of origin of neurons and neuroglia. J Comp Neurol. 1968;134:287–304. doi: 10.1002/cne.901340304. [DOI] [PubMed] [Google Scholar]
- Horton AC, Racz B, Monson EE, Lin AL, Weinberg RJ, Ehlers MD. Polarized secretory trafficking directs cargo for asymmetric dendrite growth and morphogenesis. Neuron. 2005;48:757–771. doi: 10.1016/j.neuron.2005.11.005. [DOI] [PubMed] [Google Scholar]
- Jefferis GS, Marin EC, Stocker RF, Luo L. Target neuron prespecification in the olfactory map of Drosophila. Nature. 2001;414:204–208. doi: 10.1038/35102574. [DOI] [PubMed] [Google Scholar]
- Jin X, Hu H, Mathers PH, Agmon A. Brain-derived neurotrophic factor mediates activity-dependent dendritic growth in nonpyramidal neocortical interneurons in developing organotypic cultures. J Neurosci. 2003;23:5662–5673. doi: 10.1523/JNEUROSCI.23-13-05662.2003. [DOI] [PMC free article] [PubMed] [Google Scholar]
- Katz LC, Shatz CJ. Synaptic activity and the construction of cortical circuits. Science. 1996;274:1133–1138. doi: 10.1126/science.274.5290.1133. [DOI] [PubMed] [Google Scholar]
- Klintsova AY, Philpot BD, Brunjes PC. Fos protein immunoreactivity in the developing olfactory bulbs of normal and naris-occluded rats. Brain Res Dev Brain Res. 1995;86:114–122. doi: 10.1016/0165-3806(95)00015-6. [DOI] [PubMed] [Google Scholar]
- Komiyama T, Johnson WA, Luo L, Jefferis GS. From lineage to wiring specificity. POU domain transcription factors control precise connections of Drosophila olfactory projection neurons. Cell. 2003;112:157–167. doi: 10.1016/s0092-8674(03)00030-8. [DOI] [PubMed] [Google Scholar]
- Komiyama T, Sweeney LB, Schuldiner O, Garcia KC, Luo L. Graded expression of semaphorin-1a cell-autonomously directs dendritic targeting of olfactory projection neurons. Cell. 2007;128:399–410. doi: 10.1016/j.cell.2006.12.028. [DOI] [PubMed] [Google Scholar]
- Lacmann A, Hess D, Gohla G, Roussa E, Krieglstein K. Activity-dependent release of transforming growth factor-beta in a neuronal network in vitro. Neuroscience. 2007;150:647–657. doi: 10.1016/j.neuroscience.2007.09.046. [DOI] [PubMed] [Google Scholar]
- Li C, Wong WH. Model-based analysis of oligonucleotide arrays: expression index computation and outlier detection. Proc Natl Acad Sci U S A. 2001;98:31–36. doi: 10.1073/pnas.011404098. [DOI] [PMC free article] [PubMed] [Google Scholar]
- Lin DM, Wang F, Lowe G, Gold GH, Axel R, Ngai J, Brunet L. Formation of precise connections in the olfactory bulb occurs in the absence of odorant-evoked neuronal activity. Neuron. 2000;26:69–80. doi: 10.1016/s0896-6273(00)81139-3. [DOI] [PubMed] [Google Scholar]
- Lin HH, Lai JS, Chin AL, Chen YC, Chiang AS. A map of olfactory representation in the Drosophila mushroom body. Cell. 2007;128:1205–1217. doi: 10.1016/j.cell.2007.03.006. [DOI] [PubMed] [Google Scholar]
- Lois C, Hong EJ, Pease S, Brown EJ, Baltimore D. Germline transmission and tissue-specific expression of transgenes delivered by lentiviral vectors. Science. 2002;295:868–872. doi: 10.1126/science.1067081. [DOI] [PubMed] [Google Scholar]
- Luo L, Flanagan JG. Development of continuous and discrete neural maps. Neuron. 2007;56:284–300. doi: 10.1016/j.neuron.2007.10.014. [DOI] [PubMed] [Google Scholar]
- Luo L, O'Leary DD. Axon retraction and degeneration in development and disease. Annu Rev Neurosci. 2005;28:127–156. doi: 10.1146/annurev.neuro.28.061604.135632. [DOI] [PubMed] [Google Scholar]
- Luskin MB. Restricted proliferation and migration of postnatally generated neurons derived from the forebrain subventricular zone. Neuron. 1993;11:173–189. doi: 10.1016/0896-6273(93)90281-u. [DOI] [PubMed] [Google Scholar]
- Malun D, Brunjes PC. Development of olfactory glomeruli: temporal and spatial interactions between olfactory receptor axons and mitral cells in opossums and rats. J Comp Neurol. 1996;368:1–16. doi: 10.1002/(SICI)1096-9861(19960422)368:1<1::AID-CNE1>3.0.CO;2-7. [DOI] [PubMed] [Google Scholar]
- Marin EC, Jefferis GS, Komiyama T, Zhu H, Luo L. Representation of the glomerular olfactory map in the Drosophila brain. Cell. 2002;109:243–255. doi: 10.1016/s0092-8674(02)00700-6. [DOI] [PubMed] [Google Scholar]
- Marin EC, Watts RJ, Tanaka NK, Ito K, Luo L. Developmentally programmed remodeling of the Drosophila olfactory circuit. Development. 2005;132:725–737. doi: 10.1242/dev.01614. [DOI] [PubMed] [Google Scholar]
- Matsuda S, Iriyama C, Yokozaki S, Ichigotani Y, Shirafuji N, Yamaki K, Hayakawa T, Hamaguchi M. Cloning and sequencing of a novel human gene that encodes a putative target protein of Nesh-SH3. J Hum Genet. 2001;46:483–486. doi: 10.1007/s100380170049. [DOI] [PubMed] [Google Scholar]
- Matsutani S, Yamamoto N. Differentiation of mitral cell dendrites in the developing main olfactory bulbs of normal and naris-occluded rats. J Comp Neurol. 2000;418:402–410. [PubMed] [Google Scholar]
- Mombaerts P, Wang F, Dulac C, Chao SK, Nemes A, Mendelsohn M, Edmondson J, Axel R. Visualizing an olfactory sensory map. Cell. 1996;87:675–686. doi: 10.1016/s0092-8674(00)81387-2. [DOI] [PubMed] [Google Scholar]
- Mugnaini E, Oertel WH, Wouterlood FF. Immunocytochemical localization of GABA neurons and dopamine neurons in the rat main and accessory olfactory bulbs. Neurosci Lett. 1984;47:221–226. doi: 10.1016/0304-3940(84)90517-2. [DOI] [PubMed] [Google Scholar]
- Nagai Y, Sano H, Yokoi M. Transgenic expression of Cre recombinase in mitral/tufted cells of the olfactory bulb. Genesis. 2005;43:12–16. doi: 10.1002/gene.20146. [DOI] [PubMed] [Google Scholar]
- Ojima H, Mori K, Kishi K. The trajectory of mitral cell axons in the rabbit olfactory cortex revealed by intracellular HRP injection. J Comp Neurol. 1984;230:77–87. doi: 10.1002/cne.902300107. [DOI] [PubMed] [Google Scholar]
- Redmond L, Kashani AH, Ghosh A. Calcium regulation of dendritic growth via CaM kinase IV and CREB-mediated transcription. Neuron. 2002;34:999–1010. doi: 10.1016/s0896-6273(02)00737-7. [DOI] [PubMed] [Google Scholar]
- Reid CB, Liang I, Walsh CA. Clonal mixing, clonal restriction, and specification of cell types in the developing rat olfactory bulb. J Comp Neurol. 1999;403:106–118. [PubMed] [Google Scholar]
- Ressler KJ, Sullivan SL, Buck LB. Information coding in the olfactory system: evidence for a stereotyped and highly organized epitope map in the olfactory bulb. Cell. 1994;79:1245–1255. doi: 10.1016/0092-8674(94)90015-9. [DOI] [PubMed] [Google Scholar]
- Sanchez-Camacho C, Bovolenta P. Autonomous and non-autonomous Shh signalling mediate the in vivo growth and guidance of mouse retinal ganglion cell axons. Development. 2008;135:3531–3541. doi: 10.1242/dev.023663. [DOI] [PubMed] [Google Scholar]
- Shaner NC, Campbell RE, Steinbach PA, Giepmans BN, Palmer AE, Tsien RY. Improved monomeric red, orange and yellow fluorescent proteins derived from Discosoma sp. red fluorescent protein. Nat Biotechnol. 2004;22:1567–1572. doi: 10.1038/nbt1037. [DOI] [PubMed] [Google Scholar]
- Ting CY, Herman T, Yonekura S, Gao S, Wang J, Serpe M, O'Connor MB, Zipursky SL, Lee CH. Tiling of r7 axons in the Drosophila visual system is mediated both by transduction of an activin signal to the nucleus and by mutual repulsion. Neuron. 2007;56:793–806. doi: 10.1016/j.neuron.2007.09.033. [DOI] [PMC free article] [PubMed] [Google Scholar]
- Treloar HB, Purcell AL, Greer CA. Glomerular formation in the developing rat olfactory bulb. J Comp Neurol. 1999;413:289–304. [PubMed] [Google Scholar]
- Uekawa N, Terauchi K, Nishikimi A, Shimada J, Maruyama M. Expression of TARSH gene in MEFs senescence and its potential implication in human lung cancer. Biochem Biophys Res Commun. 2005;329:1031–1038. doi: 10.1016/j.bbrc.2005.02.068. [DOI] [PubMed] [Google Scholar]
- Vassar R, Chao SK, Sitcheran R, Nunez JM, Vosshall LB, Axel R. Topographic organization of sensory projections to the olfactory bulb. Cell. 1994;79:981–991. doi: 10.1016/0092-8674(94)90029-9. [DOI] [PubMed] [Google Scholar]
- Weimann JM, Zhang YA, Levin ME, Devine WP, Brulet P, McConnell SK. Cortical neurons require Otx1 for the refinement of exuberant axonal projections to subcortical targets. Neuron. 1999;24:819–831. doi: 10.1016/s0896-6273(00)81030-2. [DOI] [PubMed] [Google Scholar]
- Willhite DC, Nguyen KT, Masurkar AV, Greer CA, Shepherd GM, Chen WR. Viral tracing identifies distributed columnar organization in the olfactory bulb. Proc Natl Acad Sci U S A. 2006;103:12592–12597. doi: 10.1073/pnas.0602032103. [DOI] [PMC free article] [PubMed] [Google Scholar]
- Wong ST, Trinh K, Hacker B, Chan GC, Lowe G, Gaggar A, Xia Z, Gold GH, Storm DR. Disruption of the type III adenylyl cyclase gene leads to peripheral and behavioral anosmia in transgenic mice. Neuron. 2000;27:487–497. doi: 10.1016/s0896-6273(00)00060-x. [DOI] [PubMed] [Google Scholar]
- Yokoi M, Mori K, Nakanishi S. Refinement of odor molecule tuning by dendrodendritic synaptic inhibition in the olfactory bulb. Proc Natl Acad Sci U S A. 1995;92:3371–3375. doi: 10.1073/pnas.92.8.3371. [DOI] [PMC free article] [PubMed] [Google Scholar]
- Yoshihara S, Omichi K, Yanazawa M, Kitamura K, Yoshihara Y. Arx homeobox gene is essential for development of mouse olfactory system. Development. 2005;132:751–762. doi: 10.1242/dev.01619. [DOI] [PubMed] [Google Scholar]
- Yu CR, Power J, Barnea G, O'Donnell S, Brown HE, Osborne J, Axel R, Gogos JA. Spontaneous neural activity is required for the establishment and maintenance of the olfactory sensory map. Neuron. 2004;42:553–566. doi: 10.1016/s0896-6273(04)00224-7. [DOI] [PubMed] [Google Scholar]
- Zhang YA, Okada A, Lew CH, McConnell SK. Regulated nuclear trafficking of the homeodomain protein otx1 in cortical neurons. Mol Cell Neurosci. 2002;19:430–446. doi: 10.1006/mcne.2001.1076. [DOI] [PubMed] [Google Scholar]
- Zhao H, Reed RR. X inactivation of the OCNC1 channel gene reveals a role for activity-dependent competition in the olfactory system. Cell. 2001;104:651–660. doi: 10.1016/s0092-8674(01)00262-8. [DOI] [PubMed] [Google Scholar]
- Zou DJ, Chesler AT, Le Pichon CE, Kuznetsov A, Pei X, Hwang EL, Firestein S. Absence of adenylyl cyclase 3 perturbs peripheral olfactory projections in mice. J Neurosci. 2007;27:6675–6683. doi: 10.1523/JNEUROSCI.0699-07.2007. [DOI] [PMC free article] [PubMed] [Google Scholar]
- Zou DJ, Feinstein P, Rivers AL, Mathews GA, Kim A, Greer CA, Mombaerts P, Firestein S. Postnatal refinement of peripheral olfactory projections. Science. 2004;304:1976–1979. doi: 10.1126/science.1093468. [DOI] [PubMed] [Google Scholar]
Associated Data
This section collects any data citations, data availability statements, or supplementary materials included in this article.