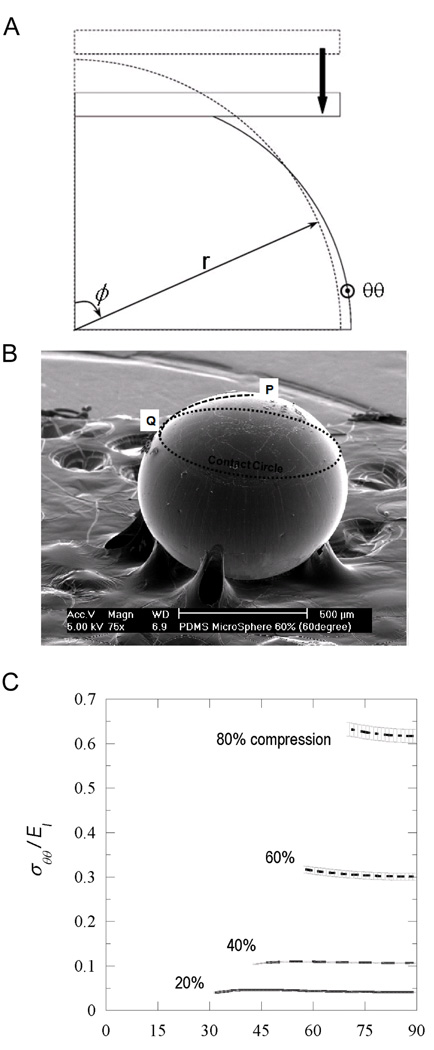
Figure 3.
A) A quarter axisymmetric model of the sphere and the upper compressing plate in the relaxed and compressed states. The direction θθ is oriented pointing out of the page at the edge of the 2D representation of the microsphere. B) The experimentally observed contact circle whose radius was measured as the distance between P and Q, after relaxation, as noted schematically on the SEM image of a sphere patterned with 58% compression. C) The circumferential stress (normalized by PDMS modulus, E) as a function of meridional position, ϕ, at 20, 40, 60, and 80% compression (ϕ = 90° is coincident with the equator of the sphere). The plots are terminated at the boundary of the contact circle.

