Abstract
Eleven polycyclic aromatic hydrocarbons (PAHs) and 14 acetylenic PAHs and biphenyls were used to analyze interactions with cytochrome P450 (P450) 1B1 in inhibiting catalytic activity, using 7-ethoxyresorufin O-deethylation (EROD) as a model reaction. Most of the chemicals examined were direct inhibitors of P450 1B1 except for 4-(1-propynyl)biphenyl, a mechanism-based inhibitor. In the case of direct inhibition of EROD activity {15 of 24 chemicals, e.g. benzo[a]pyrene, 1-(1-propynyl)pyrene, and 3-(1-propynyl)phenanthrene}, restoration of the EROD activity occurred with increasing incubation time, and kinetic analysis showed that EROD Km values were higher with these inhibitors at initial stages of incubation but became lower with increasing incubation time. With the other 9 chemicals, the Km values for P450 1B1-mediated EROD increased during the incubations. Acetylenic inhibitors, but not the 11 PAHs, induced reverse type I spectral changes with P450 1B1 and the low dissociation constants (Ks) suggested a role for such interaction in the inhibition of catalytic activity. Studies of quenching of P450 1B1-derived fluorescence with inhibitors demonstrated that acetylenic inhibitors and PAHs interacted rapidly with P450 1B1, with Kd values <10 μM. However, studies of quenching of inhibitor-derived fluorescence with P450 1B1 showed these interactions to be different, i.e. B[a]P interacted with P450 1B1 more slowly. Molecular docking of P450 1B1, based on P450 1A2 crystal structure, suggested that there are clear differences in the interaction of PAH inhibitors with P450 1B1 and 1A2 and that these differences may explain why PAH inhibitors inhibit P450 1 enzymes by different mechanisms. The results suggest that P450 1B1 interacts with synthetic polycyclic aromatic acetylenes and PAHs in different ways, depending on the chemicals, and that these differences in interactions may explain how these chemicals inhibit P450 activities by different mechanisms.
Introduction
Polycyclic aromatic hydrocarbons (PAHs)1 are ubiquitous environmental carcinogens and induce toxicity and carcinogenesis when they are activated by xenobiotic-metabolizing enzymes such as P450, epoxide hydrolase, and aldoketoreductase (1-3). P450s 1A1 and 1B1 catalyze oxidation of PAHs to toxic and carcinogenic products and the levels of expression and catalytic function of these P450 enzymes may be important in explaining why there are individual differences in responses towards PAHs (4). Polymorphisms of P450 genes and the induction and inhibition of P450 proteins by numerous environmental chemicals have been considered to be the factors that cause individual differences in catalytic functions of these P450 enzymes (2,3,5). Indeed, there are numerous reports showing that genetic polymorphisms of P450s 1A1 and 1B1 genes affect the incidence of tumor formation in humans, although other studies do not support these results (2,5-7). P450s 1A1 and 1B1 have been shown to be induced in vivo by chemical inducers, (e.g. polyhalogenated biphenyls, dibenzofurans and dioxins), and PAHs, and inhibited in vitro by many types of chemicals, {e.g. resveratrol, rhapontigenin, synthetic organoselenium compounds such as 1,2-, 1,3- and 1,4-phenylenebis(methylene)selenocyanate, and synthetic acetylenic PAHs such as 1-ethynylpyrene (1EP), 2-ethynylpyrene (2EP), 1-(1-propynyl)pyrene (1PP), 2-ethynylphenanthrene (2EPh), 2-(1-propynyl)phenanthrene (2PPh), and 4-(1-propynyl)biphenyl (4Pbi)} (1,2,8-14).
We have recently shown that many PAHs, e.g. benzo[a]pyrene (B[a]P), benz[a]anthracene (B[a]A), and 5-methylchrysene (5MeCh), are potent inhibitors of human P450s 1A1, 1A2, and 1B1 in vitro and that the IC50 values obtained with these PAHs are similar to potent known inhibitors, e.g. several synthetic acetylenic chemicals and α-naphthoflavone (15). These results are of interest because humans are exposed to mixtures of environmental PAHs through foods and atmosphere and these PAHs have both activities as active carcinogens through metabolism by P450s and as chemoprevention agents by inhibiting P450s themselves (3, 16-18). Recently we reported that P450s 1A1, 1A2, and 1B1 are inhibited by PAHs and other chemical inhibitors through different mechanisms, e.g. 1PP and 1EP inhibit P450 1A1 in a mechanism-based manner, while they act as direct inhibitors of P450 1B1 (19). P450 1A2 is also found to be inhibited by B[a]P and the related chemicals by a mechanism-based manner, while these chemicals directly inhibit P450s 1A1 and 1B1 (19).
In this study, we examined how these chemical inhibitors interact with P450 1B1 by monitoring the inhibition of 7-ethoxyresorufin O-deethylation (EROD) as a model reaction. Chemical inhibitors studied included 11 PAHs and 14 synthetic acetylenic PAHs and biphenyls. Three methods were used to study the interactions between inhibitors and P450 1B1: i) spectral interaction of inhibitors with P450 1B1, ii) quenching of P450 1B1-derived fluorescence emission with inhibitors, and iii) quenching of inhibitor-derived fluorescence emission with P450 1B1. A model for the interaction of these chemical inhibitors with P450 1B1 binding sites is proposed.
Experimental Procedures
Chemicals
Acetylenic PAHs and biphenyls, including 1EP, 2EP, 4-ethynylpyrene (4EP), 1-vinylpyrene (1VP), 1PP, 2EPh, 3-ethynylphenanthrene (3EPh), 9-ethynylphenanthrene (9EPh), 2PPh, 3-(1-propynyl)phenanthrene (3PPh), 9-(1-propynyl)phenanthrene (9PPh), 2-ethynylnaphthalene (2EN), 4-ethynylbiphenyl (4Ebi), and 4Pbi were synthesized as described previously (13,14). B[a]A, chrysene, 5-methylchrysene (5MeCh), 7,12-dimethylbenz[a]anthracene (DMBA), B[a]P, benzo[e]pyrene (B[e]P), dibenz[a,j]acridine (DB[a,j]Ac), 3-methylcholanthrene (3MC), fluoranthene (FA), benzo[b]fluoranthene (B[b]FA), and benzo[j]fluoranthene (B[j]FA) were obtained from Sigma Chemical Co. (St. Louis, MO) or Kanto Kagaku Co. (Tokyo). 7-Ethoxyresorufin and resorufin were purchased from Sigma. Other chemicals and reagents used in this study were obtained from the sources described previously or were of the highest qualities commercially available (15,19).
Enzymes
Bacterial “bicistronic” P450 1A1, 1A2, and 1B1 systems were prepared as described (15,19). To facilitate expression and purification of P450s, six histidine residues were introduced at the position before the termination codon (12). The plasmids for the expression of P450s 1A1, 1A2, or 1B1 plus human NADPH-P450 reductase (using a single promoter) were introduced into Escherichia coli DH5α cells by a heat shock procedure, and the transformants were selected in Luria-Bertani medium containing 100 μg ampicillin/mL. Bacterial membranes were prepared and suspended in 10 mM Tris-HCl buffer (pH 7.4) containing 1.0 mM EDTA and 20% glycerol (v/v) (20).
For purification of P450 enzymes, the bacterial membranes were solubilized in 0.10 M potassium phosphate buffer (pH 7.4) containing 20% glycerol (v/v), 0.5 M NaCl, 10 mM β-mercaptoethanol, 0.5% sodium cholate (w/v), 1% Triton N-101 (w/v), and 30 μM α-naphthoflavone. The solubilized membranes were centrifuged, the supernatant was applied to a nickel-nitrilotriacetic acid column (Qiagen), and the P450 proteins were purified by the method as described by Chun et al. (12).
Enzyme Assays
Most of the EROD assays were done at 37 °C, unless stated otherwise. Standard reaction mixtures (1.5 mL) contained recombinant P450 1B1 (3.3 nM), P450 1A1 (5 nM), or P450 1A2 (100 nM) plus NADPH (0.83 μM) and 7-ethoxyresorufin (4 μM). Reactions were initiated by adding NADPH, and product (resorufin) formation was monitored directly in a Hitachi F-4500 spectrofluorometer using an excitation wavelength of 571 nm and an emission wavelength of 585 nm (15,19). All of the PAH inhibitors and 7-ethoxyresorufin were dissolved in (CH3)2SO and added directly to the incubation mixtures; the final concentration of organic solvent in the mixture was <0.4% (v/v).
Metabolism-dependent inhibition of P450s by chemicals was determined as described previously (19), except that incubation was conducted at 37 °C instead of 25 °C, with mixing, and the P450 1B1 concentration used was 3.3 nM not 50 nM. P450s were mixed with 0.10 M potassium phosphate buffer (pH 7.4) containing chemical inhibitors and 7-ethoxyresorufin in a cuvette in a spectrofluormeter, with mixing, at 37 °C. The reaction was started with NADPH and the increase in resorufin formation was monitored directly for 0-30 min. Metabolism-dependent changes in inhibition of P450 by chemicals was determined using the pseudo-first-order time-dependent losses of EROD activity, essentially according to the methods described previously (19). Briefly, semi-log plots of the percent relative activity (activities with versus without inhibitors) were determined and the losses of activities were calculated from initial linear decreases in activities per min. The Ki values were estimated using GraphPad Prism software (GraphPad Software, San Diego, CA).
Spectral Binding Titrations
Purified P450 1B1 was diluted to 1 μM in 0.10 M potassium phosphate buffer (pH 7.4) and divided into two cuvettes. Spectra were recorded with subsequent additions of PAHs in a Jasco V-550 spectrophotometer. The difference in absorbance between the wavelength maximum (414-416 nm) and minimum (383-387 nm) was plotted versus the substrate concentration. Spectral dissociation constants (Ks) were estimated using GraphPad Prism software (GraphPad Software, San Diego, CA).
Quenching of P450 1B1 Fluorescence with PAHs
Purified P450 1B1 was diluted in 100 mM potassium phosphate buffer (pH 7.4) to a concentration of 1.0 μM and the (tryptophan) fluorescence intensity was measured between 280 and 400 nm (excitation wavelength at 295 nm). Binding of PAHs by P450 was monitored by detecting decreases in fluorescence intensity after the addition of different concentrations of PAHs. The apparent half-lives of quenching due to the interactions of inhibitors with P450 1B1 were estimated using Curve Fitting of New Cricket Graph III. Binding constants (Kd) were estimated using GraphPad Prism software (GraphPad Software, San Diego, CA).
Quenching of PAH Fluorescence with P450 1B1
Seven acetylenic PAHs (1EP, 2EP, 4EP, 1VP, 1PP, 2EPh, and 2PPh) and eight PAHs (chrysene, 5MeCh, B[a]P, B[e]P, DB[a,j]Ac, 3MC, FA, and B[b]FA) have detectable fluorescence emission at 10 nM concentrations that allow determination of interaction with P450 1B1. These inhibitors were diluted in 100 mM potassium phosphate buffer (pH 7.4) containing 20% glycerol (v/v) and the fluorescence intensities were measured (at various excitation/emission wavelengths, as described in Figure 8, vide infra). Quenching of fluorescence emission was measured after addition of P450 1B1. The apparent half-lives and binding constants (Kd) were estimated by nonlinear regression analysis using the program KaleidaGraph (Synergy Software, Reading, PA).
Figure 8.
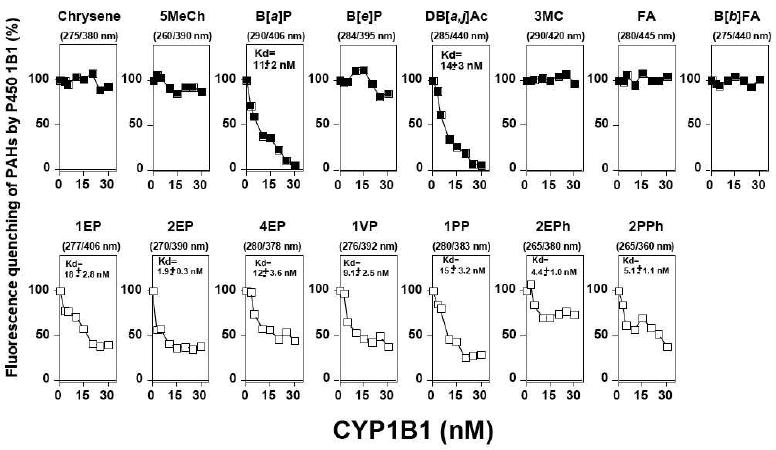
Binding of different inhibitors to P450 1B1. P450 1B1 (0-30 nM) was mixed (at 25 °C) with inhibitors (at 10 nM) and the fluorescent quenching was determined at the excitation and emission wavelengths indicated at the tops of the figures. Kd values were estimated (quadratic equations) and are indicated in the figures.
Other Assays
P450 and protein concentrations were estimated by the methods described previously (21,22).
Docking Simulation of PAHs into a Homology Model of P450 1B1 Based on P450 1A2 Structure
The crystal structure of P450 1A2 sequence has recently been reported (23). The human P450 1B1 primary sequence was aligned with human P450 1A2 (Protein Data Bank code 2HI4) in the MOE software (ver. 2007.09, Chemical Computing Group, Montreal, Canada) for modeling of a three-dimensional structure (24,25). Prior to docking, the energy of the P450 1B1 structure was minimized using the CHARM22 force field. Docking simulation was carried out for PAH binding to the homology model of P450 1B1 using the MMFF94x force field distributed in the MOE Dock software. Twenty solutions were generated for each docking experiment and ranked according to total interaction energy (S value).
Results
Inhibition of P450 1B1-Dependent EROD Activities by PAHs
In this study, we used EROD for the model reaction in the study of inhibition of P450 1A1, 1A2, and 1B1 by various PAH inhibitors, since the assay is simple and the only product is resorufin, which can be readily monitored by continuous fluorescent measurements. Using this assay method, we have recently shown that several PAH compounds inhibit P450 1A1- and 1B1-dependent EROD activities by different mechanisms, i.e. the mechanism-based inhibition and the direct inhibition (19). For example, 1EP and 1PP inhibit P450 1A1 in a mechanism-based manner but inhibit P450 1B1 directly. The term “mechanism-based inhibitor” indicates a competitive inhibitor that is converted to an irreversible inhibitor at the active site of the enzyme, in a time- and cofactor-dependent matter. A direct inhibitor is one that acts by simple competitive inhibition (14,19).
In order to understand the basis of these differences in mechanisms of inhibition, we have performed further using 11 PAHs and 14 synthetic acetylenic PAHs and biphenyls (Figure 1). For the measurement of EROD activities, slightly different incubation conditions were used in these studies, compared to previous ones (19), (the incubation temperature used was 37 °C instead of 25 °C and the P450 1B1 concentration used was 3.3 not 50 nM).
Figure 1.
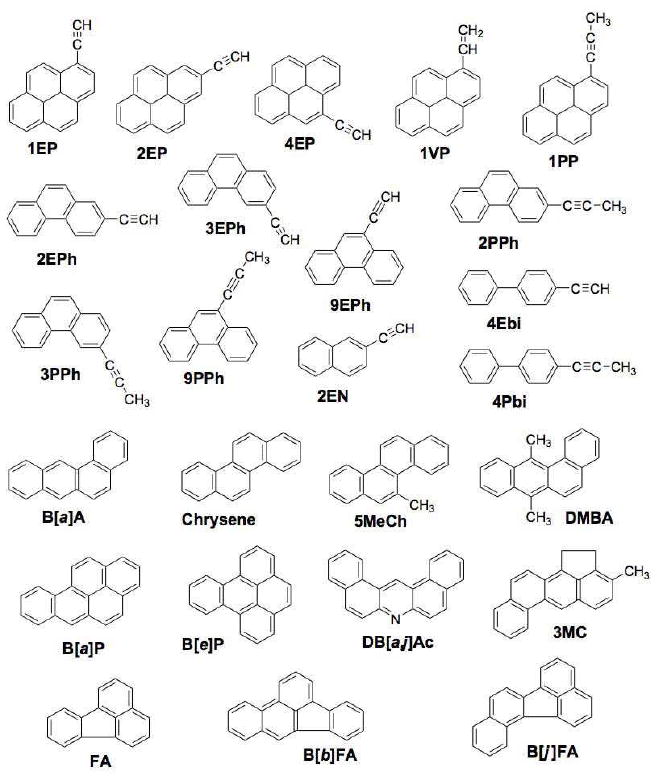
Chemical structures of PAH inhibitors used in this study.
We first determined the inhibitory effects of B[a]P on EROD activities catalyzed by 3.3, 13, and 50 nM P450 1B1 in incubations at 37 °C (Figure 2). EROD activities were initially inhibited by 25, 50, and 100 nM B[a]P in a concentration-dependent manner, with more significant inhibition at lower P450 1B1 concentrations (Figures 2A and 2D). However, the EROD activity was tended to restore with increasing incubation time, and such trends were more significant at lower concentrations of P450 1B1 (Figures 2A, 2B, and 2C). The semi-log plots of the percent relative activity (activities with versus without inhibitors) clearly showed that B[a]P directly inhibited P450 1B1 activities and the activities were tended to restore with increasing the incubation time, which was more apparent at lower concentrations of P450 1B1. These results were somewhat surprising in that our previous studies showed that B[a]P inhibited P450 1B1 directly and the activities were not restored when B[a]P was incubated with 50 nM P450 1B1 at 25 °C (19).
Figure 2.
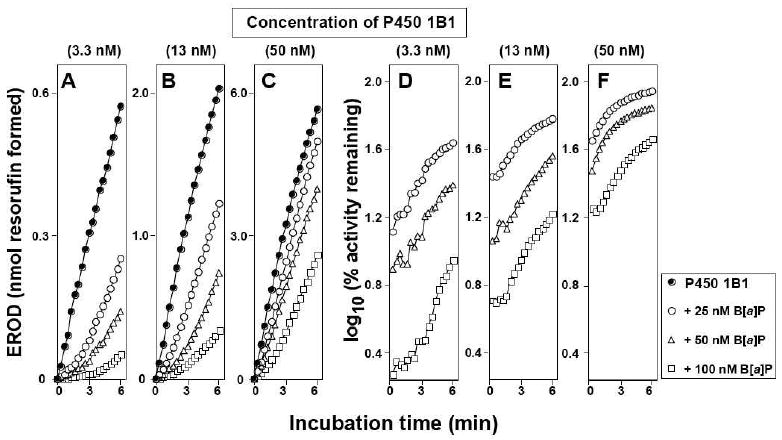
Dependence of inhibition of P450 1B1-supported EROD activity by B[a]P on incubation time. P450 1B1, at concentrations of 3.3 nM (parts A and D), 13 nM (parts B and E), and 50 nM (parts C and F) was used without B[a]P (closed circles in parts A, B, and C, ●), 25 nM B[a]P (open circles, ○), 50 nM B[a]P (open triangles, Δ), and 100 nM B[a]P (open squares, □). Reactions were done at 37 °C. Formation of resorufin was monitored as a function of incubation time in parts A, B, and C, and the effects of B[a]P were determined as log10 (% activity remaining) in parts D, E, and F.
All of the PAH inhibitors used, except for 4Pbi, were direct inhibitors of P450 1B1, and with these (1EP, 1PP, 4EP, 1VP, 3EPh, 2PPh, 3PPh, B[a]A, B[a]P, B[e]P, B[b]FA, B[j]FA, 5MeCh, DMBA, and DB[a,j]Ac) the EROD activity was restored with increasing incubation time (at 37 °C) (Table 1). IC50 values for the inhibition of P450 1B1-dependent EROD activities by these inhibitors (except for 4Pbi) were calculated and compared after a pre-incubation time of 5 s (the IC50 of 4Pbi, a mechanism-based inhibitor, was determined after 6 min of incubation time). Of 11 PAHs examined, B[a]A, 5MeCh, B[a]P, B[e]P, DB[a,j]Ac, 3MC, FA, B[b]FA, and B[j]FA inhibited P450 1B1 with IC50 values < 50 nM (Table 1). The IC50 values for chrysene and DMBA were 92 nM and 300 nM, respectively. 1EP, 1PP, and 3PPh inhibited P450 1B1 with IC50 values < 50 nM, while 2EP, 4EP, 1VP, 2EPh, 3EPh, 9EPh, 2PPh, and 9PPh inhibited with IC50 values between 80 and 250 nM. 2EN, 4Ebi, and 4Pbi were not potent inhibitors of P450 1B1, with IC50 values of 190, 3.3, and 17 μM, respectively.
Table 1.
Inhibition of P450 1B1-mediated EROD activity by polycyclic aromatic inhibitors a
| acetylenic inhibitors | inhibition of EROD activity | PAH inhibitors | inhibition of EROD activity | ||
|---|---|---|---|---|---|
| mechanism* | IC50 (μM) | mechanism* | IC50 (μM) | ||
| 1EP | direct/restore | 0.031 ± 0.004 | B[a]A | direct/restore | 0.009 ± 0.001 |
| 2EP | direct | 0.110 ± 0.020 | chrysene | direct | 0.092 ± 0.011 |
| 4EP | direct/restore | 0.250 ± 0.020 | 5MeCh | direct/restore | 0.008 ± 0.001 |
| 1VP | direct/restore | 0.088 ± 0.010 | DMBA | direct/restore | 0.300 ± 0.033 |
| 1PP | direct/restore | 0.022 ± 0.003 | B[a]P | direct/restore | 0.031 ± 0.004 |
| 2EPh | direct | 0.130 ± 0.021 | B[e]P | direct/restore | 0.017 ± 0.002 |
| 3EPh | direct/restore | 0.110 ± 0.016 | DB[a,j]Ac | direct/restore | 0.015 ± 0.002 |
| 9EPh | direct | 0.140 ± 0.018 | 3MC | direct | 0.014 ± 0.002 |
| 2PPh | direct/restore | 0.100 ± 0.012 | FA | direct | 0.015 ± 0.001 |
| 3PPh | direct/restore | 0.040 ± 0.003 | B[b]FA | direct/restore | 0.005 ± 0.001 |
| 9PPh | direct | 0.110 ± 0.021 | B[j]FA | direct/restore | 0.044 ± 0.006 |
| 2EN | direct | 190 ± 16 | |||
| 4Ebi | direct | 3.3 ± 0.5 | |||
| 4Pbi | mechanism-based | 17 ± 2.0 | |||
“Direct” inhibitors are the chemicals that inhibited EROD activities throughout the incubation period and “direct/restore” inhibitors are the chemicals that inhibited EROD activities during the initial periods of incubation but for which EROD activity increased with increasing incubation time. 4Pbi is a mechanism-based inhibitor that required oxidation by P450 1B1 for the inhibition. IC50 values were obtained at 15 s of incubation time for “direct” and “direct/restore” inhibitors and at 6 min of incubation time for the mechanism-based inhibitor. IC50 values were determined with 5-7 concentrations of inhibitors and the results are presented as means and SE.
Three inhibitors, B[a]P, 1PP, and 3PPh, were then compared in their abilities to inhibit P450s 1A1 and 1B1, incubating at 37 °C for 30 min (Figure 3). Inhibition of P450 1A2 by B[a]P is also included in Figure 3. B[a]P directly inhibited P450 1A1 (Figure 3A) and the semi-log plots of the percent relative activity showed little change in inhibition of P450 1A1 throughout the incubation time, indicating no association with the transformation of B[a]P in the inhibition process (Figure 3H). In contrast, 1PP and 3PPh only weakly inhibited P450 1A1 in the first phase of incubation but the inhibition significantly increased with incubation time, indicating that products of these chemicals generated by P450 1A1 are involved in the inhibition (Figures 3B, 3C, 3I, and 3J). P450 1A2 was directly inhibited by low concentration of B[a]P, but the inhibition was increased with time at higher B[a]P concentrations (Figures 3D and 3K). P450 1A2 was also inhibited by 1PP and 3PPh by a mechanism-based manner in this assay condition (data not shown).
Figure 3.
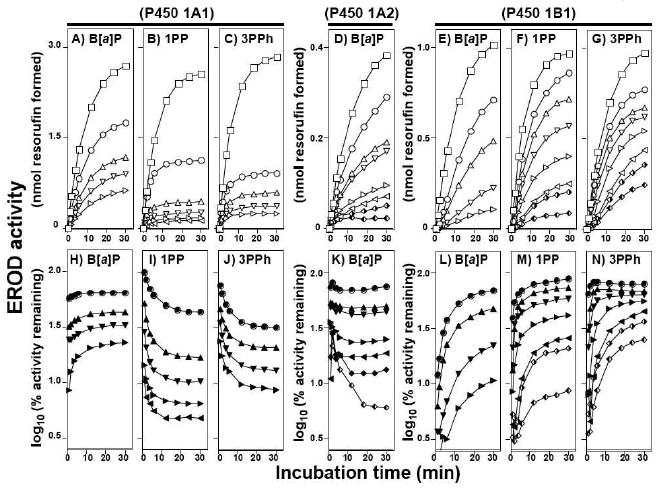
Inhibition of P450 1A1- (parts A, B, C, H, I, and J), P450 1A2- (parts D and K), and P450 1B1- (parts E, F, G, L, M, and N) dependent EROD activity by B[a]P (parts A, D, E, H, K, and L), 1PP (parts B, F, I, and M), and 3PPh (parts C, G, J, and N). Experiments were done at 37°C. In parts A through G, formation of resorufin was plotted with increasing incubation time and the squares (□)) in the figures indicate activity without inhibitors. In parts H to N, EROD activities were presented as log10 (% activity remaining). Concentrations of B[a]P used were 42, 83, 166, and 333 nM for both P450 1A1 (parts A and H) and 1B1 (parts E and L) and 5.2, 10, 21, 42, 83, 166, and 333 nM for P450 1A2 (parts D and K). Concentrations of 1PP were 8.3, 33, 88, 444, and 1300 nM for P450 1A1 (parts B and I), and 17, 25, 33, 66, 133, and 266 nM for P450 1B1 (parts F and M). Concentrations of 3PPh were 170, 330, 670, and 1300 nM for P450 1A1 (parts C and J), and 16, 33, 66, 130, 270, 333, and 500 nM for P450 1B1 (parts G and N). All of the traces in the figures are indicated from top to bottom, with increasing concentrations of inhibitors.
On the other hand, three inhibitors—B[a]P, 1PP, and 3PPh—directly inhibited P450 1B1 at the first part of the incubation and catalytic activity increased with increasing incubation time (Figures 3E, 3F, 3G, 3L, 3M, and 3N). Semi-log plots of the percent relative activity clearly showed that the inhibited EROD activities were restored with incubation time, indicating that the oxidation of B[a]P, 1PP, and 3PPh by P450 1B1 might be involved in the recovery of the inhibition of EROD activities (Figures 3L, 3M, and 3N).
The effects of B[a]P, 1PP, and 3PPh on EROD activities catalyzed by P450s 1A1 and 1B1 were examined over an incubation period of 6 min (Tables 2 and 3). Substrate (7-ethoxyresorufin) concentrations used were 0.35, 0.7, 1.4, 2.8, 4.2, and 5.6 μM. EROD Km and kcat values for P450 1A1 in the absence of inhibitors were ~0.1 μM and 60-70 nmol product formed/min/nmol P450, respectively (Table 2). The Km values for P450 1A1-dependent EROD increased in a concentration-dependent manner with 25, 37, and 50 nM B[a]P. B[a]P caused slight decreases in kcat values. 1PP (66 nM) and 3PPh (333 nM) increased the Km values of P450 1A1 by 8- to 9-fold at initial incubation time, and these increased with increasing the incubation time; the fold increases in Km values at 360 s with 1PP and 3PPh were 10-fold and 25-fold, respectively. The kcat values were decreased with 1PP and 3PPh, being more apparent with 1PP.
Table 2.
Effects of incubation time on inhibition of P450 1A1-dependent EROD activity by B[a]P, 1-PP, and 3PPh
| incubation time (s) |
EROD activity | |||||||||||
|---|---|---|---|---|---|---|---|---|---|---|---|---|
| P450 1A1 | plus 25 nM B[a]P | plus 37.5 nM B[a]P | plus 50 nM B[a]P | plus 66 nM 1PP | plus 333 nM 3PPh | |||||||
|
Km (μM) |
kcat (nmol/min/nmol) |
Km (μM) |
kcat (nmol/min/nmol) |
Km (μM) |
kcat (nmol/min/nmol) |
Km (μM) |
kcat (nmol/min/nmol) |
Km (μM) |
kcat (nmol/min/nmol) |
Km (μM) |
kcat (nmol/min/nmol) |
|
| 15 | 0.11±0.02 | 66±3 | 0.41±0.08 | 55±2 | 0.50±0.07 | 57±3 | 1.2±0.3 | 56±4 | 0.80±0.23 | 36±3 | 0.9±0.21 | 45±4 |
| 30 | 0.10±0.02 | 64±2 | 0.38±0.05 | 63±2 | 0.45±0.07 | 56±2 | 1.1±0.2 | 55±3 | 0.77±0.10 | 37±2 | 1.0±0.22 | 47±3 |
| 60 | 0.11±0.05 | 73±3 | 0.40±0.10 | 55±3 | 0.54±0.08 | 52±2 | 1.2±0.4 | 53±6 | 0.79±0.13 | 35±2 | 1.4±0.19 | 46±3 |
| 90 | 0.11±0.03 | 70±2 | 0.40±0.13 | 53±4 | 0.48±0.09 | 51±3 | 1.2±0.3 | 51±4 | 0.97±0.13 | 31±1 | 1.6±0.26 | 43±3 |
| 120 | 0.09±0.01 | 71±2 | 0.39±0.11 | 51±3 | 0.47±0.07 | 49±2 | 1.1±0.1 | 48±2 | 0.91±0.11 | 25±1 | 1.9±0.13 | 42±2 |
| 150 | 0.10±0.01 | 71±2 | 0.40±0.07 | 50±2 | 0.53±0.08 | 49±2 | 1.1±0.1 | 47±2 | 1.01±0.08 | 25±1 | 2.0±0.11 | 39±2 |
| 180 | 0.09±0.01 | 67±2 | 0.41±0.04 | 49±2 | 0.59±0.05 | 50±2 | 0.87±0.2 | 44±2 | 1.03±0.05 | 23±1 | 2.1±0.10 | 37±1 |
| 210 | 0.10±0.02 | 68±3 | 0.38±0.07 | 47±2 | 0.51±0.05 | 47±2 | 0.86±0.1 | 43±2 | 1.08±0.10 | 22±1 | 2.3±0.15 | 36±2 |
| 240 | 0.09±0.02 | 65±2 | 0.38±0.08 | 46±2 | 0.50±0.06 | 47±2 | 0.89±0.1 | 42±2 | 1.10±0.08 | 20±1 | 2.4±0.18 | 34±1 |
| 270 | 0.10±0.02 | 65±2 | 0.38±0.07 | 46±3 | 0.55±0.07 | 47±3 | 0.89±0.1 | 42±2 | 1.04±0.07 | 19±1 | 2.6±0.22 | 33±1 |
| 300 | 0.10±0.02 | 63±3 | 0.36±0.06 | 44±2 | 0.54±0.05 | 45±2 | 0.78±0.1 | 40±2 | 1.07±0.08 | 18±1 | 2.4±0.15 | 31±1 |
| 330 | 0.11±0.02 | 62±3 | 0.40±0.05 | 45±3 | 0.57±0.04 | 45±2 | 0.87±0.1 | 40±2 | 1.10±0.07 | 17±1 | 2.5±0.19 | 29±1 |
| 360 | 0.11±0.01 | 61±1 | 0.35±0.05 | 42±2 | 0.52±0.05 | 43±2 | 0.79±0.1 | 39±2 | 1.05±0.08 | 16±1 | 2.7±0.11 | 28±1 |
Km and kcat values were obtained with 6 different concentrations of the substrate (7-ethoxyresorufin) and the results are presented as means and S.E.
Table 3.
Effects of incubation time on inhibition of P450 1B1-dependent EROD activity by B[a]P, 1-PP, and 3PPh
| incubation time (s) |
EROD activity | |||||||||
|---|---|---|---|---|---|---|---|---|---|---|
| P450 1B1 | plus 5 nM B[a]P | plus 10 nM B[a]P | plus 66 nM 1PP | plus 33 nM 3PPh | ||||||
|
Km (μM) |
kcat (nmol/min/nmol) |
Km (μM) |
kcat (nmol/min/nmol) |
Km (μM) |
kcat (nmol/min/nmol) |
Km (μM) |
kcat (nmol/min/nmol) |
Km (μM) |
kcat (nmol/min/nmol) |
|
| 15 | 0.47±0.07 | 31±2 | 0.71±0.32 | 6±1 | 0.92±0.19 | 5±1 | 3.2±0.5 | 6±1 | 1.10±0.14 | 6±1 |
| 30 | 0.46±0.09 | 29±2 | 0.54±0.21 | 7±1 | 0.84±0.15 | 6±1 | 2.8±0.4 | 8±1 | 0.67±0.12 | 7±1 |
| 60 | 0.45±0.08 | 30±2 | 0.45±0.08 | 10±1 | 0.87±0.12 | 7±1 | 2.3±0.2 | 9±2 | 0.58±0.12 | 12±1 |
| 90 | 0.46±0.07 | 30±3 | 0.36±0.10 | 11±2 | 0.45±0.12 | 7±1 | 2.7±0.2 | 11±1 | 0.21±0.02 | 12±1 |
| 120 | 0.46±0.06 | 30±2 | 0.32±0.09 | 12±2 | 0.46±0.08 | 9±2 | 2.3±0.3 | 13±2 | 0.17±0.02 | 13±2 |
| 150 | 0.53±0.06 | 32±3 | 0.33±0.10 | 14±2 | 0.38±0.11 | 9±2 | 2.1±0.2 | 14±2 | 0.21±0.02 | 15±1 |
| 180 | 0.50±0.06 | 30±2 | 0.33±0.11 | 15±3 | 0.30±0.12 | 9±1 | 1.7±0.2 | 14±2 | 0.17±0.01 | 17±2 |
| 210 | 0.58±0.06 | 32±3 | 0.34±0.10 | 15±2 | 0.33±0.10 | 10±2 | 1.6±0.2 | 14±1 | 0.17±0.01 | 17±2 |
| 240 | 0.59±0.04 | 32±2 | 0.33±0.10 | 15±3 | 0.36±0.11 | 11±2 | 1.2±0.1 | 14±2 | 0.17±0.01 | 18±1 |
| 270 | 0.58±0.06 | 33±3 | 0.31±0.11 | 16±3 | 0.32±0.12 | 11±1 | 1.0±0.1 | 14±3 | 0.19±0.01 | 18±2 |
| 300 | 0.61±0.05 | 32±3 | 0.32±0.10 | 16±2 | 0.31±0.12 | 12±1 | 0.9±0.1 | 14±2 | 0.19±0.02 | 18±2 |
| 330 | 0.61±0.04 | 32±3 | 0.30±0.09 | 16±2 | 0.34±0.13 | 12±2 | 0.7±0.1 | 14±1 | 0.19±0.02 | 18±3 |
| 360 | 0.64±0.05 | 32±2 | 0.29±0.09 | 16±3 | 0.33±0.12 | 12±1 | 0.7±0.1 | 14±2 | 0.21±0.03 | 18±1 |
Km and kcat values were obtained with 6 different concentrations of the substrate (7-ethoxyresorufin) and the results are presented as means and S.E.
The effects of B[a]P, 1PP, and 3PPh on the Km and kcat values of EROD activities catalyzed by P450 1B1 were determined (Table 3). The EROD Km and kcat values of P450 1B1 were 0.45-0.65 μM and ~ 30 nmol product formed/min/nmol P450 following 6 min incubation time. B[a]P (concentrations of 5 and 10 nM) increased Km values by 1.5-fold and 2.0-fold, respectively, during the first 15 s and then until 60 s of incubation time and then decreased Km with increasing the incubation time until 6 min. The kcat values in the presence of B[a]P were first decreased to one-fifth of the control values and, then increased with increasing the incubation time. The effects of 1PP (66 nM) and 3PPh (33 nM) on Km values were more significant that those with B[a]P; the fold increases with 1PP and 3PPh at 15 s were 6.8 and 2.3, respectively. It is also interesting to note that the increased Km values seen with 1PP and 3PPh tended to decrease with increasing incubation time, and the Km value with 3PPh (33 nM) at 6 min of incubation was one-third of the control value. In these cases, the kcat values were first decreased by one-fifth with 66 nM 1PP and 33 nM 3PPh and then increased with increasing incubation time; the kcat values after 6 min of incubation time were 44% and 56%, respectively, of the controls.
Spectral Interaction of PAHs with P450 1B1
Synthetic acetylenic PAHs, such as 3EPh, induced “reverse type I” spectral changes with P450 1B1, having peak absorbance at 416, 530, and 566 nm and a trough at 383 nm in the difference spectra (Figure 4). Such spectral changes were not seen with P450 1A1 or 1A2 (data not shown). Other PAHs (including 11 PAHs) did not show any apparent spectral changes with P450 1A1, 1A2, or 1B1 (at 1 μM P450 and 5 μM PAH concentrations); higher concentrations of these PAHs precluded spectral analysis with P450s.
Figure 4.
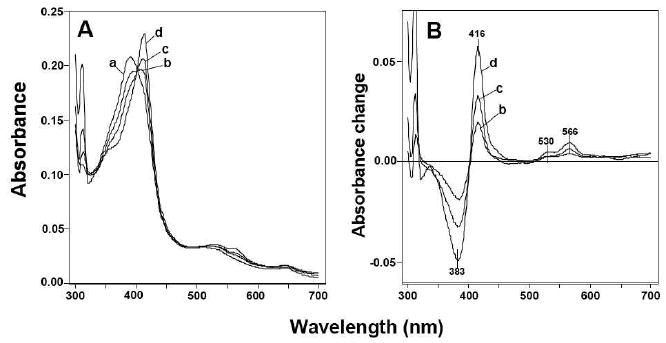
Spectral interaction of 3EPh with human P450 1B1. 3EPh (at concentrations of 0 μM (a), 2 μM (b), 4 μM (c), and 10 μM (d)) was added to 2 μM P450 1B1 in 0.10 M potassium phosphate buffer (pH 7.4) containing 20% glycerol (v/v) and the absolute (A) and difference (B) spectra were recorded between 300 and 700 nm.
All of the acetylenic inhibitors used induced reverse Type I spectral interaction with P450 1B1, and Ks and ΔAmax values were calculated (Table 4). The peak wavelengths were between 414 and 416 nm and the trough wavelengths between 383 and 387 nm. In most cases, Ks values were determined to be 2-5 μM (except 4EP, 2EN, 4Ebi, and 4Pbi, which were 15, 7.6, and 12 μM, respectively (see Table 1); ΔAmax/Ks ratios were lower with these four chemicals).
Table 4.
Spectral interaction of polycyclic aromatic inhibitors with human P450 1B1
| spectral interactions with P450 1B1 | ||||
|---|---|---|---|---|
| wavelengths (peak/trough) | Ks (μM) | ΔAmax (ΔA~416-A~383) | ΔAmax / Ks | |
| 1EP | 416/383 | 2.9 ± 1.0 | 0. 049 ± 0.008 | 0.017 |
| 2EP | 416/387 | 3.4 ± 0.5 | 0.071 ± 0.005 | 0.021 |
| 4EP | 416/383 | 4.0 ± 0.9 | 0.052 ± 0.006 | 0.013 |
| 1VP | 416/383 | 4.3 ± 0.5 | 0.092 ± 0.006 | 0.021 |
| 1PP | 416/383 | 2.7 ± 0.4 | 0. 042 ± 0.003 | 0.016 |
| 2EPh | 414/383 | 4.2 ± 1.3 | 0.080 ± 0.013 | 0.020 |
| 3EPh | 414/383 | 3.0 ± 0.4 | 0.071 ± 0.004 | 0.024 |
| 9EPh | 415/383 | 3.6 ± 1.0 | 0.071 ± 0.010 | 0.020 |
| 2PPh | 415/383 | 2.2 ± 0.1 | 0.067 ± 0.001 | 0.030 |
| 3PPh | 415/383 | 3.1 ± 0.4 | 0.060 ± 0.004 | 0.019 |
| 9PPh | 416/383 | 3.2 ± 0.3 | 0.049 ± 0.002 | 0.015 |
| 2EN | 415/383 | 15 ± 8 | 0.049 ± 0.038 | 0.003 |
| 4Ebi | 416/383 | 7.6 ± 1.2 | 0.023 ± 0.002 | 0.003 |
| 4Pbi | 415/386 | 12 ± 5 | 0.074 ± 0.022 | 0.005 |
Spectral interaction was determined in a system containing 1 μM P450 1B1 and 6-8 concentrations of PAH inhibitors in 100 mM potassium phosphate buffer (pH 7.4). The Ks values were calculated with hyperbolic or quadratic equations as appropriate with GraphPad Prism software (GraphPad Software, San Diego, CA). Results are presented as means ± S.E.
Quenching of P450 1B1 Fluorescence by PAHs
P450 1B1 shows fluorescence emission at around 331-335 nm (when excited at 295 nm), which could be quenched by B[a]P, presumably reflecting binding of B[a]P to P450 1B1 (Figure 5A) (26). The apparent half-lives of the quenching due to interactions of B[a]P, 1PP, and B[b]FA with P450 1B1 were determined to be <0.05 s in these cases, although the real numbers must be determined with stopped-flow measurements (Figure 5B). The apparent Kd values for the interaction of these three inhibitors with P450 1B1 were estimated to be 1.0 (± 0.2), 1.9 (± 0.4), and 1.1 (± 0.1) μM, respectively (Figure 5C). All of the chemical inhibitors used in this study were found to interact with P450 1B1, except 2EN, 4Ebi, and 4Pbi which could not be used in the assay because of their spectral properties. The Kd values of the interaction of P450 1B1 were <2.5 μM with 1EP, 1PP, 2EP, 4EP, 1VP, 9EPh, 9PPh, B[a]A, B[a]P, FA, B[b]FA, B[j]FA, 5MeCh, and DB[a,j]Ac (Table 5). The Kd values were <10 μM when other inhibitors were used (2EPh, 3EPh, 2PPh, 3PPh, B[e]P, chrysene, DMBA, and 3MC).
Figure 5.
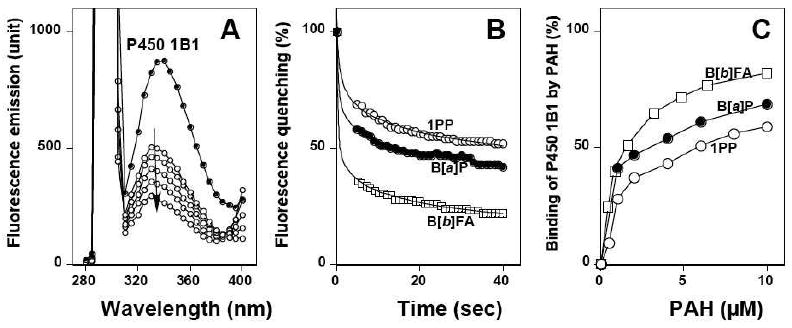
Binding of PAHs to P450 1B1 as studied by fluorescence quenching. (A) Quenching of tryptophan fluorescence of P450 1B1 with different concentrations of B[a]P. (B) Kinetics of interaction of B[a]P, 1PP, and B[b]FA. (C) Dependence of binding to P450 1B1 on concentration of B[a]P, 1PP, and B[b]FA. Incubation mixtures contained 1.0 μM P450 1B1 in 100 mM potassium phosphate buffer and varying concentrations of inhibitors, and the fluorescence emission was determined between 280 nm and 400 nm in part A and at 331 nm in parts B and C (excitation wavelength of 295 nm). The half maximal time (t1/2) for the fluorescence quenching was <0.05 s for all of the cases at 8 μM each of B[a]P, 1PP, and B[b]FA, based on a Curve Fitting of New Cricket Graph III. The reactions were carried at 25 °C.
Table 5.
Interaction of polycyclic aromatic inhibitors with human P450 1B1
| acetylenic inhibitors | PAH binding to P450 1B1 | PAH inhibitors | PAH binding to P450 1B1 | ||
|---|---|---|---|---|---|
| Kd, μM | Bmax (%) | Kd, μM | Bmax (%) | ||
| 1EP | 1.9± 0.1 | 74 ± 1 | B[a]A | 2.0 ± 0.1 | 46 ± 1 |
| 2EP | 2.1 ± 0.3 | 69 ± 3 | chrysene | 4.3 ± 0.6 | 84 ± 6 |
| 4EP | 0.9 ± 0.1 | 67 ± 3 | 5MeCh | 1.9 ± 0.3 | 83 ± 5 |
| 1VP | 2.0 ± 0.2 | 65 ± 2 | DMBA | 3.1 ± 0.3 | 62 ± 1 |
| 1PP | 1.9 ± 0.4 | 69 ± 1 | B[a]P | 1.0 ± 0.2 | 77 ± 4 |
| 2EPh | 4.7 ± 0.6 | 62 ± 4 | B[e]P | 6.3 ± 0.8 | 100 ± 6 |
| 3EPh | 9.2 ± 3.0 | 108 ± 22 | DB[a,j]Ac | 1.6 ± 0.3 | 62 ± 4 |
| 9EPh | 1.6 ± 0.3 | 52 ± 3 | 3MC | 4.8 ± 0.5 | 105 ± 6 |
| 2PPh | 4.6 ± 0.6 | 77 ± 5 | FA | 1.1 ± 0.1 | 91 ± 2 |
| 3PPh | 3.3 ± 0.5 | 73 ± 5 | B[b]FA | 1.1 ± 0.1 | 91 ± 2 |
| 9PPh | 1.6 ± 0.2 | 61 ± 3 | B[j]FA | 1.8 ± 0.1 | 90 ± 2 |
| 2EN | UD | UD | |||
| 4Ebi | UD | UD | |||
| 4Pbi | UD | UD | |||
Fluorescence quenching was assayed using 1.0 μM P450 1B1 in 100 mM potassium phosphate buffer (pH 7.4) with 7 different concentrations of PAHs, and decreases in fluorescence intensities were measured at 331 nm (excitation at 295 nm). Ks values were estimated using hyperbolic or quadratic equations, as appropriate, with GraphPad Prism software (GraphPad Software, San Diego, CA). UD, undetectable due to interference with inhibitors. Bmax is the extrapolated % quenching. Results are presented as means ± S.E.
In preliminary studies 1PP, 1VP, B[a]P, FA, and B[b]FA also interacted with P450 1A1 and 1A2 in this quenching assay with Kd values ~ 10 μM (data not shown).
Quenching of Fluorescence Emission from Inhibitors with P450 1B1
The interactions with P450 1B1 were analyzed using quenching of inhibitor-derived fluorescence (Figure 6). B[a]P had two emission peaks at 406 and 429 nm (excitation at 290 nm), and both were quenched by the addition of P450 1B1 (Figure 6A). The half-maximal times to decrease B[a]P emission (with 2.5, 5, and 10 nM B[a]P) were estimated to be 33, 15, and 7.5 s, respectively (Figure 6B). Quenching of B[a]P fluorescence was dependent on the concentration of P450 1B1 and was more significant at lower B[a]P concentrations (Figure 6C).
Figure 6.
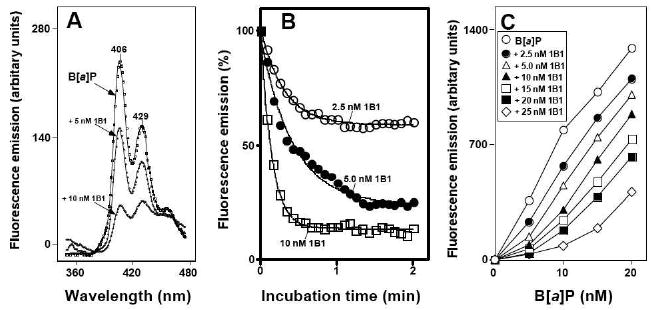
Binding of B[a]P to P450 1B1 as determined by fluorescence quenching of B[a]P with increasing concentrations of P450 1B1. (A) Varying concentrations of P450 1B1 were added to a cuvette containing 100 mM potassium phosphate buffer (pH 7.4), 20% glycerol (v/v), and 10 nM B[a]P, and the fluorescence quenching was determined with an excitation wavelength of 290 nm and emission wavelengthes of 360 and 480 nm. (B) Fluorescence quenching of B[a]P with 2.5, 5.0, and 10 nM P450 1B1 was monitored using an emission wavelength of 406 nM. The half lives for quenching were estimated as described in Materials and Methods. (C) Interaction of P450 1B1 with B[a]P was assayed at different concentrations of the enzyme and the inhibitor. The temperature was 25 °C.
Fluorescence quenching was also seen with 1EP and DB[a,j]Ac, as well as B[a]P, in the presence of P450s 1A1 and 1B1, but to a lesser extent with P450 1A1 than 1B1 (Figure 7). No interactions between P450 1A2 and 1EP, B[a]P, and DB[a,j]Ac were detected under these assay conditions (Figure 7).
Figure 7.
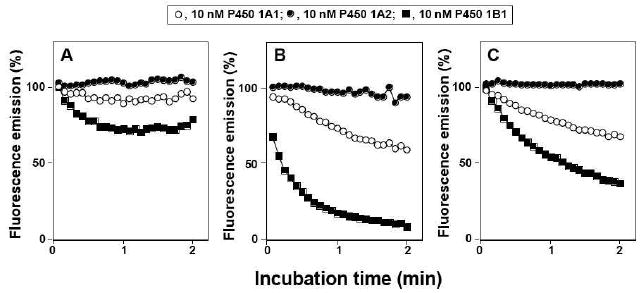
Binding of 1EP (part A), B[a]P (part B), and DB[a,j]Ac (part C) with P450 1A1 (open circles,○), P450 1A2 (closed circles, ●), and P450 1B1 (closed squares, ■). Experimental details are as in the legend to Figure 6, except that excitation and emission wavelengthes were set at 277 and 406 nm for 1EP and at 285 and 440 nm for DB[a,j]Ac, respectively. The enzyme and inhibitor concentrations used were 10 nM and the temperature was 25 °C.
Eight PAHs (chrysene, 5MeCh, B[a]P, B[e]P, DB[a,j]Ac, 3MC, FA, and B[b]FA) and seven acetylenic inhibitors (1EP, 2EP, 4EP, 1VP, 1PP, 2EPh, and 2PPh) were tested for the interaction with P450 1B1 using inhibitor-derived fluorescence assays (Figure 8). The other inhibitors could not be tested because these chemicals had weak fluorescence intensities that could not be used to determine the interactions with P450 1B1.
Among the eight PAHs examined, only B[a]P and DB[a,j]Ac (at 10 nM concentrations) were found to interact with P450 1B1, with Kd values of 11 and 14 nM, respectively, and others were not (Figure 8, upper parts of figure). In contrast, all seven acetylenic PAHs interacted with P450 1B1 under these assay conditions (Figure 8, lower parts of figure). The Kd values for these acetylenic inhibitors were all between 1.9 and 18 nM.
Docking of PAHs in a model of P450 1B1, which is based on P450 1A2 crystal structure
Human P450 1A2 crystal structure (23) allows a homology model of the P450 1B1 protein to be generated using the MOE program. The top-rank docking-model of B[a]P, 1PP, 3PPh, B[b]FA, and DB[a,j]Ac were adopted. The reaction energies for above 5 compounds in the docking models were inversely correlated with their IC50 values for P450 1B1 (shown in Table 1) significantly (r = - 0.93, p = 0.02) and with their Kd values (shown in Table 5) not quite significantly (r = - 0.81, p = 0.09). In the models of B[a]P, B[b]FA, and DB[a,j]Ac, the aromatic hydrocarbons apparently orientated to the center of the heme (Figure 9) in an appropriated manner. In contrast, acetylenic 1PP and 3PPh seemed to be flexibly adopted an orientation suitable for either ring-oxidation or acetylene-epoxidation for P450 1B1.
Figure 9. Docking simulation of PAHs into a homology model of P450 1B1.
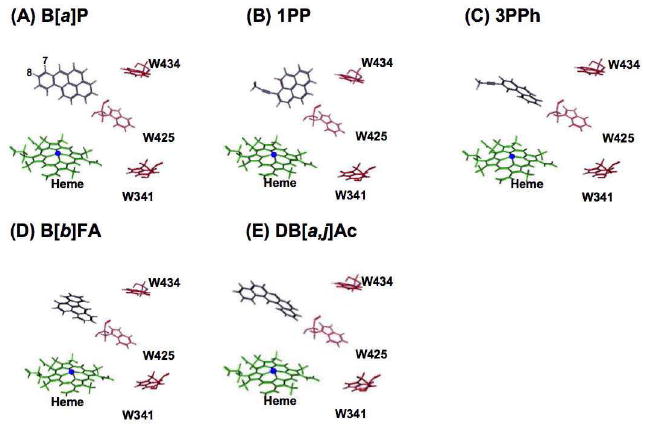
(A) B[a]P, (B) 1PP, (C) 3PPh, (D) B[b]FA, and (E) DB[a,j]Ac were adopted an orientation for a model of P450 1B1 with interaction energies (S values) of 64.8, 60.0, 48.0, 82.6, and 74.5, respectively.
Similar analysis was carried out using P450 1A2 (Figure 10). B[a]P adopted to P450 1A2 in other orientation than P450 1B1; The carbons at 8 or 9 positions of B[a]P were easy to approach to the iron of heme in P450 1A2 (Figure 10A). Acetylenic 1PP and 3PPh adopted one orientation for acetylene-epoxidation for P450 1A2 (Figures 10B and 10C).
Figure 10. Docking simulation of PAHs into a reported structure of P450 1A2.
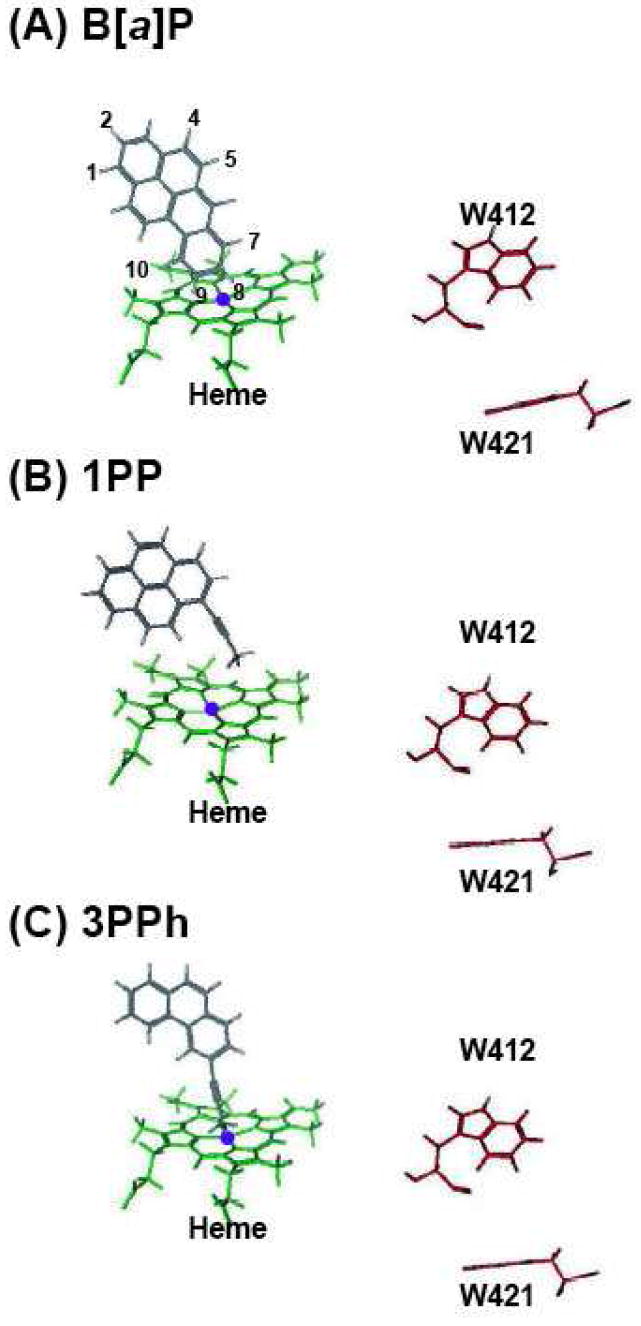
(A) B[a]P, (B) 1PP, and (C) 3PPh were adopted an orientation with interaction energies (S values) of 54.8, 38.5, and 30.4, respectively.
Discussion
Our results show that 11 PAHs and 14 (synthetic) acetylenic PAHs and biphenyls inhibit human P450 1B1 activity by different mechanisms. Among the chemicals examined, only 4Pbi appears to be a mechanism-based inhibitor of P450 1B1, in that P450 1B1-dependent EROD activity was inhibited more by 4Pbi with increasing incubation time (19). For the direct inhibitors, Km values with 2EP, 2EPh, 9EPh, 9PPh, 2EN, and 4Ebi increased throughout the incubation period. On the other hand, 1EP, 4EP, 1VP, 1PP, 3EPh, 2PPh, 3PPh, B[a]A, 5MeCh, DMBA, B[a]P, B[e]P, DB[a,j]Ac, B[b]FA, and B[j]FA inhibited EROD activities catalyzed by P450 1B1 in the initial steps of incubations, but the activities tended to recover with continuing incubation time. The results suggest that these chemicals are direct inhibitors of P450 1B1 but are oxidized by P450 1B1 to products that lose the ability to inhibit P450 1B1 or possibly to products that enhance P450 1B1 enzyme activity. The latter possibility has some support in that P450 1B1 EROD Km values increased with these chemicals at the first step of the incubation, while the Km values decreased with increasing incubation time. However, the catalytic efficiency (kcat/Km) never really exceeded that of the control. It is also interesting to note that the P450 1B1 EROD kcat values of activities were first decreased to ~ one-fifth of the control activities by B[a]P, 1PP, and 3PPh but tended to increase with increasing incubation time. The results suggest that the inhibitors directly inhibit P450 1B1 but are readily oxidized by P450 1B1 to non-inhibitory products or to products that enhance the P450 1B1 activity.
As reported previously (19), B[a]P is a direct inhibitor of P450 1A1; the P450 1A1 EROD Km value was increased in a concentration-dependent manner, with slight decreases in kcat. On the other hand, 1PP and 3PPh were mechanism-based inhibitors, i.e. these inhibitors increased the Km values by ~8-fold at the initial step of incubation time and then decreased catalytic efficiency more with increasing incubation time. Interestingly, these two inhibitors produced decreased kcat values with increasing incubation time, indicating either direct mechanism-based inactivation occurs or products are formed that are more potent inhibitors of P450 1A1 than the parent compounds. Acetylenic compounds, such as 1EP and 1PP, have been shown to be activated by P450 enzymes to reactive products that bind covalently to a heme nitrogen or nucleophilic moieties of the enzymes, thus leading inhibition of P450 catalytic activities (27). Our previous and present results showed that both P450 1A1 and 1A2, but not P450 1B1, activate several acetylenic chemicals to products that were more inhibitory towards these P450s than the parent compounds (15,19).
Fourteen acetylenic polycyclics induced reverse type I spectral changes with P450 1B1 (peak wavelength at 414 to 416 nm and trough wavelength at 383 to 387 nm). Ks values obtained with P450 1B1 were <5 μM, except for 2EN, 4Ebi, and 4Pbi, where inhibition activities of P450 1B1 were relatively modest (IC50 values of > 2 μM). Compounds that induce “type II” spectral changes with P450s have been shown to interact with the cytochrome at the heme iron and, thus are able to inhibit P450 activities (28). However, the compounds considered here do not have any moieties that would be expected to interact with the iron atom. The reverse type I spectra results form the fact that the isolated P450 1B1 is originally partially in the high-spin configuration (Figure 4A), as shown previously (27), and the addition of ligands drives the equilibrium to low spin (Figure 4A), presumably with the association of H2O as a sixth ligand to the heme iron atom.
Our current studies showed that 11 PAHs did not induce spectral changes with P450 1B1 although these chemicals inhibit P450 1B1 activity very strongly. Mechanisms underlying inhibition of P450 1B1 by these PAHs might be different from those of the acetylenic inhibitors. However, most of the PAH inhibitors used in this work interacted with P450 1B1, as judged by quenching of the tryptophan fluorescence at 331 nm (excitation wavelength at 295 nm) (26). The rapid binding (<0.05 s) of PAH inhibitors to P450 1B1 was suggested in this study, although the real times must be examined with stopped-flow measurements. Indeed, the substrate testosterone has been reported to bind to P450 3A4 at rates of ~0.025 s by stopped-flow work (26). Human P450 1B1 contains seven tryptophans (among 543 amino acid residues) and these tryptophans are not located near apparent substrate binding sites. Trp341 is located in the I helix and Trp425 is in the K’ helix, which may be involved in other types of interactions (e.g. access channels or hinge regions). The results indicate that acetylenic inhibitors are able to interact both with the heme iron and tryptophan residue(s) of P450 1B1 and the 11 PAHs bind only to the latter.
Imai and his associates have reported that B[a]P and several other PAHs form an equimolar complex with rabbit P450 1A2 at a single binding site, by measuring in vitro fluorescence quenching of PAHs and appearance of CD bands and that the binding might be specific for P450 1A2, because neither rabbit P450 2B1 nor albumin formed such complexes with PAHs (30). This P450 enzyme was first isolated from liver microsomes of 3MC-treated rabbits as a 3MC complex in vivo, and it has been suggested that 3MC was bound specifically to the heme-containing domain of P450 1A2 (31). Fluorescence-emission techniques have also been applied to the studies of interaction of B[a]P with rat P450s by Marcus et al. (32), who showed that specific quenching of B[a]P fluorescence occurs with P450 1A1, but not with P450 1A2, 2A1, 2B1, 2E1, and 2C11 and that a change in spin state of rat P450 1A1 with B[a]P correlates with the interaction.
Our PAH fluorescence quenching assays indicated that two PAHs, B[a]P and DB[a,j]Ac, can interact with human P450 1B1 to form equimolar complexes, but interactions with P450 1B1 were not found with other PAHs, including chrysene, 5MeCh, B[e]P, 3MC, FA, and B[b]FA. The binding of B[a]P to P450 1B1 was apparently not very rapid under these assay conditions, i.e. the t1/2 values for quenching (of 2.5, 5.0, and 10 nM B[a]P fluorescence with 10 nM P450 1B1) were determined to be 33, 15, and 7.5 s, respectively. The interaction between rabbit P450 1A2 and B[a]P has also been reported to be slow, because the fluorescence spectra is measured after incubating at 25°C for more than 30 min to complete the binding (30). Interestingly, the fluorescence of each of several acetylenic PAHs (e.g., 1EP, 2EP, 4EP, 1VP, 1PP, 2EPh, and 2PPh) which could be determined in this assay system were quenched by P450 1B1 with different Kd values between 1.9 and 18 nM. Again, interaction of these acetylenic PAHs with P450 1B1 was slow, indicating the differences in the binding sites determined with spectral titrations experiments and two fluorescence quenching assays.
In this study, we constructed a homology modelling of P450 1B1, which is based on a crystal structure of P450 1A2 reported recently (23). Comparison of molecular docking of P450 1B1 and 1A2 with PAH inhibitors suggested that there were clear differences in interacting 1PP and 3PPh with these P450s; the aromatic positions of these chemicals dock with prosthetic group of P450 1B1 heme, while the acetylenic chain of 1PP and 3PPh lie near at P450 1A2 heme. These results support the view that P450 1A2 (and P450 1A1) can oxidize 1PP and 3PPh to reactive side-chain epoxides that inhibit these P450 activities (27) and that P450 1B1 metabolizes these inhibitors to oxidative products at aromatic position that loose activity to inhibit P450 1B1 or to restore the P450 1B1 activity. The docking simulation also revealed differently fitted orientations of B[a]P in the substrate pockets of P450 1A2 and 1B1 (Figures 9 and 10). Carbon positions at 7, 8, 9, and 10 of B[a]P were easy to approach to P450 1A2 heme iron, but this was not the case in P450 1B1 presumably because of a larger substrate pocket in P450 1B1 than P450 1A2. These results and findings would be collectively relevant to different preferable substrates among P450 1B1 and 1A forms (33). Accordingly, P450 1B1 is able to genotoxically activate the relatively large fjord-type of PAHs among chemically diverse procarcinogens in comparison with P450 1A forms for bay-region-type of PAHs (1,3,4,33).
Urban atmosphere, diesel exhaust particles, tobacco smoke condensates, and broiled foods contain many types of carcinogens, and PAHs have been recognized to be the major ones (2,3,34,). Complex mixtures of PAHs and other chemicals have been studied to determine if these mixtures cause increased or decreased capacities to form PAH-DNA adducts in vitro and tumor formation in vivo, as compared with single chemical. The results reported to date are complex; in some cases, the carcinogenic activities and DNA-binding capacities are additive but in other cases decreased when compared with individual carcinogens (16,17,35,36). Since most of the PAHs require metabolic activation by P450s (and other enzymes) to exert their carcinogenic potentials, the nature of enzyme inhibitors in the mixtures has been studied extensively (14,15,19,37). Courter et al. have recently reported that components in urban dust particulate alter PAH-induced carcinogenesis by inhibiting P450 1A1 and 1B1 (18).
In conclusion, present results showed that there are different binding sites in P450 1B1 molecule for a variety of PAHs and acetylenic PAHs and biphenyls. Comparison of the results of spectral titration and of quenching of P450 1B1-derived and inhibitor-supported fluorescence indicated that PAHs and acetylenic PAHs and biphenyls interacted with P450 1B1 at different sites in causing inhibition of catalytic activity. Molecular docking studies showed that there are clear differences in interaction of selected PAH inhibitors, such as B[a]P, 1PP, and 3PPh, with active sites of P450 1B1 and P450 1A2, and these results supported that these P450 enzymes can form different metabolites of these PAH inhibitors, thus causing different mechanisms for inhibition of these P450 enzymes.
Acknowledgments
This work was supported in part by Grants from the Ministry of Education, Science, and Culture of Japan, the Ministry of Health and Welfare of Japan, and by NIH grants R37 CA090426 and P30 ES000267.
Footnotes
Abbreviations: B[a]A, benz[a]anthracene; B[b]FA, benzo[b]fluoranthene; B[j]FA, benzo[j]fluoranthene; B[a]P, benzo[a]pyrene; B[e]P, benzo[e]pyrene; DB[a,j]Ac, dibenz[a,j]acridine; DMBA, 7,12-dimethylbenz[a]anthracene; 4Ebi, 4-ethynylbiphenyl; 2EN, 2-ethynylnaphthalene; 1EP, 1-ethynylpyrene; 2EP, 2-ethynylpyrene; 4EP, 4-ethynylpyrene; 2EPh, 2-ethynylphenanthrene, 3EPh, 3-ethynylphenanthrene; 9-EPh, 9-ethynylphenanthrene; EROD, 7-ethoxyresorufin O-deethylation; FA, fluoranthene; 3MC, 3-methylcholanthrene; 5MeCh, 5-methylchrysene; PAHs, polycyclic aromatic hydrocarbons; 4Pbi, 4-(1-propynyl)biphenyl; 1PP, 1-(1-propynyl)pyrene; 2-PPh, 2-(1-propynyl)phenanthrene; 3-PPh, 3-(1-propynyl)phenanthrene, 9PPh, 9-(1-propynyl)phenanthrene; 1VP, 1-vinylpyrene.
References
- 1.Conney AH. Induction of microsomal enzymes by foreign chemicals and carcinogenesis by polycyclic aromatic hydrocarbons: G. H. A. Clowes Memorial Lecture. Cancer Res. 1982;42:4875–4917. [PubMed] [Google Scholar]
- 2.Hecht SS. Tobacco smoke carcinogens and breast cancer. Environm Molec Mutagen. 2002;39:119–126. doi: 10.1002/em.10071. [DOI] [PubMed] [Google Scholar]
- 3.Shimada T. Xenobiotic-metabolizing enzymes involved in activation and detoxification of carcinogenic polycyclic aromatic hydrocarbone. Drug Metab Pharmacokin. 2006;21:257–276. doi: 10.2133/dmpk.21.257. [DOI] [PubMed] [Google Scholar]
- 4.Shimada T, Fujii-Kuriyama Y. Metabolic activation of polycyclic aromatic hydrocarbons to carcinogens by cytochromes P450 1A1 and 1B1. Cancer Sci. 2004;95:1–6. doi: 10.1111/j.1349-7006.2004.tb03162.x. [DOI] [PMC free article] [PubMed] [Google Scholar]
- 5.Nebert DW, Ingelman-Sundberg M, Daly AK. Genetic epidemiology of environmental toxicity and cancer susceptibility: human allelic polymorphisms in drug-metabolizing enzyme genes, their functional importance, and nomenclature issues. Drug Metab Rev. 1999;31:467–487. doi: 10.1081/dmr-100101931. [DOI] [PubMed] [Google Scholar]
- 6.Hayashi S, Watanabe J, Nakachi K, Kawajiri K. Genetic linkage of lung cancer-associated MspI polymorphisms with amino acid replacement in the heme binding region of the human cytochrome P450IA1 gene. J Biochem (Tokyo) 1991;110:407–411. doi: 10.1093/oxfordjournals.jbchem.a123594. [DOI] [PubMed] [Google Scholar]
- 7.Watanabe J, Shimada T, Gillam EMJ, Ikuta T, Suemasu K, Higashi Y, Gotoh O, Kawajiri K. Association of CYP1B1 genetic polymorphism with incidence to breast and lung cancer. Pharmacogenetics. 2000;10:25–33. doi: 10.1097/00008571-200002000-00004. [DOI] [PubMed] [Google Scholar]
- 8.Nebert DW, Dalton TP, Okey AB, Gonzalez FJ. Role of aryl hydrocarbon receptor-mediated induction of the CYP1 enzymes in environmental toxicity and cancer. J Biol Chem. 2004;279:23847–23850. doi: 10.1074/jbc.R400004200. [DOI] [PubMed] [Google Scholar]
- 9.Hakkola J, Pasanen M, Pelkonen O, Hukkanen J, Evisalmi S, Anttila S, Rane A, Mantyla M, Purkunen R, Saarikoski S, Tooming M, Raunio H. Expression of CYP1B1 in human adult and fetal tissues and differential inducibility of CYP1B1 and CYP1A1 by Ah receptor ligands in human placenta and cultured cells. Carcinogenesis. 1997;18:391–397. doi: 10.1093/carcin/18.2.391. [DOI] [PubMed] [Google Scholar]
- 10.Shimada T, Inoue K, Suzuki Y, Kawai T, Azuma E, Nakajima T, Shindo M, kurose K, Sugie A, Yamagishi Y, Fujii–Kuriyama Y, Hashimoto M. Arylhydrocarbon receptor-dependent induction of liver and lung cytochromes P450 1A1, 1A2, and 1B1 by polycyclic aromatic hydrocarbons and polychlorinated biphenyls in genetically engineered C57BL/6J mice. Carcinogenesis. 2002;23:1199–1207. doi: 10.1093/carcin/23.7.1199. [DOI] [PubMed] [Google Scholar]
- 11.Guengerich FP, Chun Y-J, Kim D, Gillam EMJ, Shimada T. Cytochrome P450 1B1: A target for inhibition in anticarcinogenesis strategies. Mut Res. 2003;523-524:173–182. doi: 10.1016/s0027-5107(02)00333-0. [DOI] [PubMed] [Google Scholar]
- 12.Chun Y-J, Kim S, Kim D, Lee S-K, Guengerich FP. A new selective and potent inhibitor of human cytochrome P450 1B1 and its application to antimutagenesis. Cancer Res. 2001;61:8164–8170. [PubMed] [Google Scholar]
- 13.Shimada T, Yamazaki H, Foroozesh M, Hopkins NE, Alworth WL, Guengerich FP. Selectivity of polycyclic inhibitors for human cytochromes P450 1A1, 1A2, and 1B1. Chem Res Toxicol. 1998;11:1048–1056. doi: 10.1021/tx980090+. [DOI] [PubMed] [Google Scholar]
- 14.Foroozesh M, Primrose G, Guo Z, Bell LC, Guengerich FP, Alworth WL. Propynylaryl acetylenes as mechanism-based inhibitors of cytochrome P450 1A1, 1A2, and 2B1 enzymes. Chem Res Toxicol. 1997;10:91–102. doi: 10.1021/tx960064g. [DOI] [PubMed] [Google Scholar]
- 15.Shimada T, Guengerich FP. Inhibition of human cytochrome P450 1A1-, 1A2-, and 1B1-mediated activation of procarcinogens to genotoxic metabolites by polycyclic aromatic hydrocarbons. Chem Res Toxicol. 2006;19:288–294. doi: 10.1021/tx050291v. [DOI] [PubMed] [Google Scholar]
- 16.Marston CP, Pereira C, Ferguson J, Fischer K, Hedstrom O, Dashwood WM, Baird WM. Effect of a complex environmental mixture from coal tar containing polycyclic aromatic hydrocarbons (PAH) on the tumor initiation, PAH-DNA binding and metabolic activation of carcinogenic PAH in mouse epidermis. Carcinogenesis. 2001;22:1077–1086. doi: 10.1093/carcin/22.7.1077. [DOI] [PubMed] [Google Scholar]
- 17.Slaga TJ, Jecker L, Bracken WM, Weeks CE. The effects of weak or non-carcinogenic polycyclic hydrocarbons on 7,12-dimethylbenz[a]anthracene and benzo[a]pyrene skin tumor-initiation. Cancer Lett. 1979;7:51–59. doi: 10.1016/s0304-3835(79)80076-2. [DOI] [PubMed] [Google Scholar]
- 18.Courter LA, Musafia-Jeknic T, Fischer K, Bildfell R, Giovanini J, Pereira C, Baird WM. Urban dust particulate matter alters PAH-induced carcinogenesis by inhibition of CYP1A1 and CYP1B1. Toxicol Sci. 2007;95:63–73. doi: 10.1093/toxsci/kfl137. [DOI] [PubMed] [Google Scholar]
- 19.Shimada T, Murayama N, Okada K, Funae Y, Yamazaki H, Guengerich FP. Different mechanisms of inhibition for human cytochrome P450 1A1, 1A2, and 1B1 by polycyclic aromatic inhibitors. Chem Res Toxicol. 2007;20:489–496. doi: 10.1021/tx600299p. [DOI] [PubMed] [Google Scholar]
- 20.Parikh A, Gillam EMJ, Guengerich FP. Drug metabolism by Escherichia coli expressing human cytochromes P450. Nat Biotechnol. 1997;15:784–788. doi: 10.1038/nbt0897-784. [DOI] [PubMed] [Google Scholar]
- 21.Omura T, Sato R. The carbon monoxide-binding pigment of liver microsomes. I. Evidence for its hemoprotein nature. J Biol Chem. 1964;239:2370–2378. [PubMed] [Google Scholar]
- 22.Lowry OH, Rosebrough NJ, Farr AL, Randall RJ. Protein measurement with the Folin phenol reagent. J Biol Chem. 1951;193:265–275. [PubMed] [Google Scholar]
- 23.Sansen S, Yano JK, Reynald RL, Schoch GA, Griffin KJ, Stout CD, Johnson EF. Adaptations for the oxidation of polycyclic aromatic hydrocarbons exhibited by the structure of human P450 1A2. J Biol Chem. 2007;282:14348–55. doi: 10.1074/jbc.M611692200. [DOI] [PubMed] [Google Scholar]
- 24.Choudhary D, Jansson I, Sarfarazi M, Schenkman JB. Characterization of the biochemical and structural phenotypes of four CYP1B1 mutations observed in individuals with primary congenital glaucoma. Pharmacogenet Genomics. 2008;18:665–676. doi: 10.1097/FPC.0b013e3282ff5a36. [DOI] [PubMed] [Google Scholar]
- 25.Achary MS, Reddy AB, Chakrabarti S, Panicker SG, Mandal AK, Ahmed N, Balasubramanian D, Hasnain SE, Nagarajaram HA. Disease-causing mutations in proteins: structural analysis of the CYP1B1 mutations causing primary congenital glaucoma in humans. Biophys J. 2006;91:4329–4339. doi: 10.1529/biophysj.106.085498. [DOI] [PMC free article] [PubMed] [Google Scholar]
- 26.Isin EM, Guengerich FP. Kinetics and thermodynamics of ligand binding by cytochrome P450 3A4. J Biol Chem. 2006;281:9127–9136. doi: 10.1074/jbc.M511375200. [DOI] [PubMed] [Google Scholar]
- 27.Ortiz de Montellano PR, Kunze KL, Yost GS, Mico BA. Self-catalyzed destruction of cytochrome P-450: covalent binding of ethynyl sterols to prosthetic heme. Proc Natl Acad Sci USA. 1979;76:746–749. doi: 10.1073/pnas.76.2.746. [DOI] [PMC free article] [PubMed] [Google Scholar]
- 28.Yoshida Y, Kumaoka H. Studies on the substrate-induced spectral change of cytochrome P450 in liver microsomes. J Biochem (Tokyo) 1975;78:455–468. [PubMed] [Google Scholar]
- 29.Shimada T, Wunsch RM, Hanna IH, Sutter TR, Guengerich FP, Gillam EMJ. Recombinant human cytochorome P450 1B1 expression in Escherichia coli. Arch Biochem Biophys. 1998;357:111–120. doi: 10.1006/abbi.1998.0808. [DOI] [PubMed] [Google Scholar]
- 30.Imai Y. Interaction of polycyclic hydrocarbons with cytochrome P-450. I. Specific binding of various hydrocarbons to P4481. J Biochem (Tokyo) 1982;92:57–66. doi: 10.1093/oxfordjournals.jbchem.a133931. [DOI] [PubMed] [Google Scholar]
- 31.Imai Y, Hashimoto-Yutsudo C, Satake H, Girardin A, Sato R. Multiple forms of cytochrome P-450 purified from liver microsomes of phenobarbital- and 3-methylcholanthrene-pretreated rabbits. I. Resolution, purificaton, and molecular properties. J Biochem (Tokyo) 1980;88:489–503. doi: 10.1093/oxfordjournals.jbchem.a132996. [DOI] [PubMed] [Google Scholar]
- 32.Marcus CB, Turner CR, Jefcoate CR. Binding of benz[a]pyrene by purified cytochrome P450c. Biochemistry. 1985;24:5115–5123. doi: 10.1021/bi00340a024. [DOI] [PubMed] [Google Scholar]
- 33.Shimada T, Oda Y, Gillam EMJ, Guengerich FP, Inoue K. Metabolic activation of polycyclic aromatic hydrocarbons and their dihydrodiol derivatives and other procarcinogens by cytochrome P450 1A1 and 1B1 allelic variants and other human cytochrome P450 enzymes in Salmonella typhimurium NM2009. Drug Metab Dispos. 2001;29:1176–1182. [PubMed] [Google Scholar]
- 34.Rodgman A, Smith CJ, Perfetti TA. The composition of cigarette smoke: a retrospective, with emphasis on polycyclic components. Hum Exp Toxicol. 2000;19:573–595. doi: 10.1191/096032700701546514. [DOI] [PubMed] [Google Scholar]
- 35.DiGiovanni J, Rymer J, Slaga TJ, Boutwell RK. Anticarcinogenic and cocarcinogenic effects of benzo[e]pyrene and dibenz[a,c]anthracene on skin tumor initiation by polycyclic hydrocarbons. Carcinogenesis. 1982;3:371–375. doi: 10.1093/carcin/3.4.371. [DOI] [PubMed] [Google Scholar]
- 36.Courter LA, Pereira C, Baird WM. Diesel exhaust influences carcinogenic PAH-induced genotoxicity and gene expression in human breast epithelial cells in culture. Mutat Res. 2007;625:72–82. doi: 10.1016/j.mrfmmm.2007.05.005. [DOI] [PMC free article] [PubMed] [Google Scholar]
- 37.Mahadevan B, Charis P, Marston BC, Luch A, Dashwood W-M, Brooks E, Pereira C, Doehmer J, William M, Baird WM. Competitive inhibition of carcinogen-activating CYP1A1 and CYP1B1 enzymes by a standardized complex mixture of PAH extracted from coal tar. Int J Cancer. 2007;120:1161–1168. doi: 10.1002/ijc.22466. [DOI] [PubMed] [Google Scholar]


