Abstract
Activity at micellar interfaces of bacterial phospholipase C from Bacillus cereus on phospholipids solubilized in micelles was investigated with the goal of elucidating the role of the interface microstructure and developing further an existing kinetic model. Enzyme kinetics and physicochemical characterization of model substrate aggregates were combined; thus enabling the interpretation of kinetics in the context of the interface. Substrates were diacylphosphatidylcholine of different acyl chain lengths in the form of mixed micelles with dodecyldimethylammoniopropanesulfonate. An early kinetic model, reformulated to reflect the interfacial nature of the kinetics, was applied to the kinetic data. A better method of data treatment is proposed, use of which makes the presence of microstructure effects quite transparent. Models for enzyme-micelle binding and enzyme-lipid binding are developed and expressions incorporating the microstructural properties are derived for the enzyme-micelle dissociation constant KS and the interface Michaelis-Menten constant, KM. Use of these expressions in the interface kinetic model brings excellent agreement between the kinetic data and the model. Numerical values for the thermodynamic and kinetic parameters are determined. Enzyme-lipid binding is found to be an activated process with an acyl chain length dependent free energy of activation that decreases with micelle lipid molar fraction with a coefficient of about −15 RT and correlates with the tightness of molecular packing in the substrate aggregate. Thus the physical insight obtained includes a model for the kinetic parameters that shows that these parameters depend on the substrate concentration and acyl chain length of the lipid. Enzyme-micelle binding is indicated to be hydrophobic and solvent mediated with a dissociation constant of 1.2 mM.
1. Introduction
Phospholipases are interfacial enzymes that catalyze the hydrolysis of lipids aggregated in the form of mixed micelles or cell membranes. In the case of digestive enzymes, the substrates are mixed micelles of dietary lipids and bile salts 1. Hydrolysis of phospholipids in membranes by phospholipase enzymes is the first part of the biological process of lipid metabolism 2–5. The activity of phospholipases toward lipids in aggregated forms is significantly higher than that toward the monomeric form: hundred times or more for secretory phospholipase A2 and two to six fold for bacterial phospholipase C 6–8. Hydrolysis occurs at the aggregate/water interface and the mechanism of enzyme action may be specific to the phospholipase and the substrate. The goal of this work is to understand in a quantifiable manner how the physicochemical nature of the interface manifests in the kinetics and level of enzyme activity. The substrates in this study are mixed micelles of phospholipids and surfactants. Micellar substrates are relevant to enzymatic reactions in the digestive tract and in other applications9. Properties like lipid packing leading to chain length dependence of the enzyme activity could well have the same effect in other types of substrates of relevance in membrane lipid hydrolysis. Model micellar substrates are useful for quantifying these effects and thus a platform to investigate the interfacial nature of the kinetics. Interfacial enzyme activity studies have recognized that the microstructure of the aggregate is of significance in the level of activity 10–14. However studies of enzyme kinetics have mostly treated the aggregate as a black box. In pursuing the goals of understanding the role of aggregate microstructure and modeling the kinetics of hydrolysis at the interface, we have combined the physicochemical characterization of the substrate aggregate together with conducting enzyme kinetic studies, thus enabling the interpretation of kinetics in the context of the interface. In the work presented here, an interfacial kinetic model is further developed to account for interface microstructure effects by studying the enzymatic action of bacterial phospholipase C (PLC) from Bacillus cereus on previously characterized model substrate aggregates 15,16. This enzyme is of interest because it is functionally and structurally similar to mammalian PLC 2,7,14,17. A prescription is formulated to first confirm the presence of substrate aggregate microstructure effects and subsequently quantify their nature.
Enzyme kinetic characterization of B. cereus PLC on diacylphosphatidylcholine dispersed in micelles of the surfactant dodecyldimethylammoniopropanesulfonate (DPS) is performed. In recently completed work, this model substrate system was shown to have some useful properties that allow better control in investigating kinetics 16. For example, the micelle concentration can be varied while keeping the aggregation number or the micelle composition and thereby the interface substrate concentration constant. In addition the DPS/lipid mixed micelles are spherical and the shape does not vary in a series of samples of varying micelle concentration. In contrast bile salt/lipid mixed micelles show variations in microstructure within such a series and complicate the interpretation of enzyme kinetics 18. In our recent studies of B. cereus PLC activity on bile salt/lipid mixed micelles, a reformulated version of an early interface kinetic model was presented. When tested the model showed excellent applicability but not without concerns on the effects of microstructural variations 15. Unlike in bulk solution kinetics, effects of the kinetic medium in interface kinetics cannot be ignored because the nature of the interface medium changes with the interface substrate concentration. The premise of the present work is then, that the original interface kinetic model continues to apply and that a kinetic characterization must include physicochemical characterization of the substrate aggregate. Having chosen a well-behaved (in the context of the microstructure) substrate system and having completed physicochemical characterization of the substrate aggregates, we continued the work on the kinetic studies. The reformulated kinetic model was applied to the kinetic data. Use of the modified form quite transparently brings forward the behavior of the kinetic parameters; thus it is found to be a better method for treating the data. From the requirements of fitting of the kinetic data to the model, insights into the nature of the variation of the activity with interface substrate concentration, the kinetic parameters and the model itself are obtained. In particular two empirical postulates, derived from present observations, that bring the data into excellent agreement with the interface kinetic model are (i) the kinetic step of formation of micelle-bound enzyme-lipid complex requires activation and (ii) the enzyme-micelle binding for bacterial PLC is independent of the micelle lipid composition. Expressions relating the thermodynamic and kinetic parameters to the properties of the kinetic medium are developed. The free energy barrier for the transfer of the lipid from the micelle to the enzyme is determined and found to correlate with the packing of the lipid in the micelle. The mechanism of enzyme-micelle binding is the one mediated by the solvent rather than hopping of enzyme between micelles in an intermicellar collision.
2. Materials and Methods
2.1. Model for Interface kinetics
The concerned chemical reaction involving the hydrolysis of the phosphodiester bond is described in Eq. 1.
 |
(1) |
The reaction occurs at the interface in three steps 19. The derivations of the equations for activity are available in previous work and only the essential parts are repeated here15,19.
-
Enzyme binds to the micelle interface to form a micelle bound enzyme,
(2) n is the number of binding sites per micelle, [micelles] is the concentration of micelles.
-
The bound enzyme binds a lipid substrate in the aggregate, forming the complex . [S] is the interface substrate concentration.
(3) -
The enzyme catalyzes hydrolysis of the lipid in the chemical step, forming the product P.
(4)
Activity, defined by the rate of product formation, v, per mole of enzyme present, is v/[ET], where [ET] is the total enzyme concentration at the aggregate interface 19. The steady state solution for the activity, denoted by A is
| (5) |
and its inverse is
| (6) |
| (7) |
The lipid surface concentration, [S] is the number of moles of lipid molecules per micelle per unit surface area of micelle,
| (8) |
where [lipid] is the bulk solution lipid concentration, Amicelle is the micelle surface area, Nlipid is the aggregation number of the lipid molecules in the mixed micelle, and N0 is Avogadro’s number. The number of binding sites per micelle, n, is the ratio of micelle surface area to the area per binding site. Thus,
| (9) |
The area per binding site, a0, may be treated as the projection of the enzyme’s cross-sectional area on to the micelle surface. Use of eq. 8 and 9 in eq. 5 gives
| (10) |
where,
| (11) |
The reciprocal of the activity is,
| (12) |
2.2. Assay and Treatment of data
a
The singularity of the interface nature of the kinetics vis. à vis. bulk solution kinetics is the dependence of the activity on [micelles] as well as [S] and the occurrence of the additional parameter KS. Furthermore, when the medium is the interface whose properties change with [S], the possibility that KS and KM are functions of [S] cannot be ruled out. In bulk solution kinetics, KM is a solution property that is not expected to change with substrate concentration. Eq. 5, 6 and 10, 12 provide us with options and limits on designing assays. The two sample variables are [micelles] and [S]. Series of samples in which one variable can be varied while the other stayed constant would be desirable to begin a proper application of the kinetic model. For anionic and cationic micelles neither type of series can be realized 20–22. In general, for nonionic and zwitterionic micelles, the micelle concentration can be varied keeping [S] constant but the alternative is not possible. The choice of the present zwitterionic system was motivated by this possibility and was also verified as briefly outlined below in §2.3 and in the appendix and detailed in our published work 16.
The samples for the kinetic experiments were organized into two types of series:
Constant [S] or [micelle] dilution series
In this series, the [DPS]:[lipid] ratio, denoted by R, was constant while the total concentration CT = [DPS]+[lipid] was varied. This series is a constant composition series. As per the characterization experiments, in a constant composition series the micelle concentration varies with CT while the micelle aggregation and composition remain constant 16. Thus in a constant composition series the micellar lipid concentration and the interface properties are constant and this series is a constant [S] series as well.
Constant [lipid] or surface dilution series
In this series the solution lipid concentration was constant and the DPS concentration was varied. As [DPS] increases, the micelle concentration increases and the micellar lipid composition, , decreases. This series thus represents a surface dilution series. Across this series, the properties of the reaction medium, namely the interface, do change.
b
For a micelle dilution series, in which [S] is constant, one may choose to use eq. 6 and view the activity data as a function of [micelles]. However a better choice is to use eq. 12 and treat the activity as a function of [lipid]. If the kinetic parameters were dependent only on [S] apart from other absolute constants, then A−1 varies linearly with [lipid]−1 with slope and intercept:
| (13) |
| (14) |
Furthermore, if the kinetic parameters were constant, ζ would not vary from one micelle dilution series of a certain [S] to another of a different [S] and J would vary inversely with [S]. Any systematic deviation from such behavior is clue to the presence of aggregate microstructure effects. A deviation is indeed observed and its dependence on [S] is analyzed to develop hypotheses for the physicochemical nature of the enzyme-micelle and enzyme-lipid binding, the effects of substrate aggregate microstructure and the structure of KS and KM. The hypotheses based model expressions for these parameters are then incorporated into the kinetic model. Application of the resulting expanded model, in addition to reassuringly describing the data, yields numerical values for the various constants in those model expressions. Use of these constants and the model to calculate the activities for the surface dilution series reproduces the experimental data on those series remarkably well.
2.3 Chemicals and Experimental Methods
a
The lipids, 1,2-Dilauroyl-sn-glycero-3-phosphocholine (DLPC), 1,2-Dimyristoyl-sn-glycero-3-phosphocholine (DMPC), and 1,2-Dipalmitoyl-sn-glycero-3-phosphocholine (DPPC), were obtained from Avanti Polar Lipids as lyophilized powders. The surfactant, 3-Dodecyldimethylammoniopropanesulfonate (DPS, >98%) was obtained from Sigma and was used without further purification. Pyrene (optical grade, 99%, Aldrich) and 3,4-dimethyl benzophenone (DMBP, 99%, Aldrich) were used as fluorescence probe and quencher respectively for physicochemical characterization of the substrate by time resolved fluorescence quenching (TRFQ). 5-doxyl stearic acid methyl ester (5DSE; 99% Sigma), was used as spin probe in the ESR experiments. Phospholipase C (PLC) from Bacillus cereus was obtained from Sigma as a lyophilized powder. It was purified by dialysis against 0.05M sodium phosphate buffer at pH 8.0 for three days, changing the buffer every 8 hours. Protein concentration was determined by the method of Lowry et al.23 using bovine serum albumin (BSA) as standard and also by the extinction coefficient method 24,25. Lowry’s method involves the complexation between protein molecules and copper ions of Lowry’s reagent, which changes the color of the protein solution to blue. It requires a precise timing of readings because color instability can produce considerable error in the measurement 25. On the other hand, the extinction coefficient method does not involve any external reagent; therefore errors are much smaller in this method. Both of these methods gave results consistent to within ±5%. The purified enzyme was stored at pH 8.0 in 0.05M sodium phosphate buffer at 4°C.
b. Mixed micelle solution preparation
The solution compositions and concentrations in the constant [lipid] series were (i) [lipid] = 4mM and [DPS] ranging from 8 to 80mM (ii) [lipid] = 10mM and [DPS] ranging from 20 to 200mM. For each sample solution, the appropriate amount of DMPC powder was mixed with few drops of ethanol. The resulting ethanol solution mixture was vortexed thoroughly to produce a clear solution which was then dried under dry N2 flux to produce a film of DMPC. Thereafter, the required amounts of the DPS surfactant and water were added to the dry film to achieve the final concentrations. The solution was stirred overnight to ensure the complete solubilization of phospholipid in surfactant micellar solution. For the constant [S] series, stock solutions with [lipid] =20mM and [DPS] ranging from 40 to 200mM, were prepared as described above. These stock solutions were diluted subsequently with appropriate amounts of water to get different sample solutions with constant [DPS]/[lipid] ratio but different total concentration. The composition of the solution is expressed in molar fraction (XDMPC) of DMPC, or molar ratio (R) of DPS to lipid and the micelle composition is the molar fraction of lipid in the micelle written as defined by,
| (15) |
The aqueous concentration of the unassociated monomers, Mfree is negligible compared to the total concentration, CT; therefore can justifiably be approximated by Xlipid 16.
c. Enzyme activity
The activity of enzyme is the amount of phosphorylcholine released per milligram of enzyme per unit time. It is measured in units of μmol of acid released, due to lipid hydrolysis, per minute per milligram of enzyme (μmol/min/mg). The enzyme activity measurements were conducted employing standard pH-stat methods 1. The activity of PLC in mixed micelles of DPS/lipid was measured by addition of 20 μL of enzyme (0.084 μg) into 5 mL of mixed micelles solutions, and monitoring the amount of 0.01 M NaOH required per minute to maintain a constant pH of 8.00 using a Radiometer pH-stat assembly consisting of a titrator, an auto burette, and a pH meter, Model TIM 854 electrode, interfaced to a computer for recording data. The principle behind this method is the deprotonation of the phosphorylcholine released by the chemical reaction that causes the pH to drop and the amount of NaOH needed to bring the pH back to a preset value is a measure of enzyme activity. The reaction was followed for 8 min. The initial rate of activity was determined from the first 2 to 4 min of data. The yield increases linearly with time and the slope of the line divided by the mass of the enzyme in mg gives the activity, in units of μmol/min/mg. The error in the fitted slopes was < 1%. All activity measurements were conducted at 40 °C. Before any hydrolysis measurement, the stability of the enzyme was checked by measuring its activity towards a standard assay system. Two different standard assay mixtures used to determine the activity of PLC were (i) egg yolk emulsion and (ii) one of the DPS+DMPC mixtures of a selected concentration/composition. The egg yolk assay was used to determine the activity of the enzyme following the method described by Nieuwenhuizen et al. 26. The observed activity of freshly dialyzed PLC was 1400 (±4%) μmol/min/mg. The stock solution of PLC showed no loss of enzymatic activity for over a period of several weeks. The composition of the DPS+DMPC mixture selected as a control was [DMPC] = 4mM and [DPS] = 8mM. This system was preferred over the egg yolk assay because the lecithin content and composition may vary in different egg yolks. The observed activity in DPS+DMPC assay mixture was 2400 (±4%) μmol/min/mg. This reference system was measured before, at the middle and at the end of every series of experiments to reassure the reproducibility of results. The precision error in the activity determined from about fifty repeated measurements on the control sample, with the same batch of enzyme under the same experimental conditions, over the course of the entire set of experiments, was ±4%. The activity value was found to differ by a maximum of about 15 % between different batches of enzyme or the same enzyme solution kept over two months and different instrument warm-up times. For example, available methods to determine enzyme concentration can only estimate the concentration to within 10%. So working with the same batch was found to improve precision and thus more meaningful. Therefore care was taken to maintain identical experimental conditions and the experiments were conducted in the shortest time possible. These cautionary measures are believed to have led to the minimal scatter in the data so that reliable conclusions could be drawn.
d. Physicochemical characterization of substrate aggregates
Micelle aggregation numbers, Nlipid and NDPS, are obtained from time-resolved fluorescence quenching (TRFQ) and the micelle hydration indexed by the volume fraction of water in the polar micelle/water interface, from electron spin resonance (ESR). The measurements were conducted at sample temperatures of 40°C. The TRFQ and ESR data are combined together in a molecular space filling model which treats the mixed micelle as an entity of the two types of monomers and water. The calculations yield the geometrical features of the micelle. Use of the aggregation numbers and the calculated micelle area in eq. 8 gives [S]. Results of the previous characterization experiments on DPS/dimyristoylphosphatidylcholine (DMPC) and several additional measurements as required on the other lipid mixed micelles are used here. The techniques are described in previous publications 15,16. Additional information and data are provided in the appendix.
3. Results and Model for KS and KM
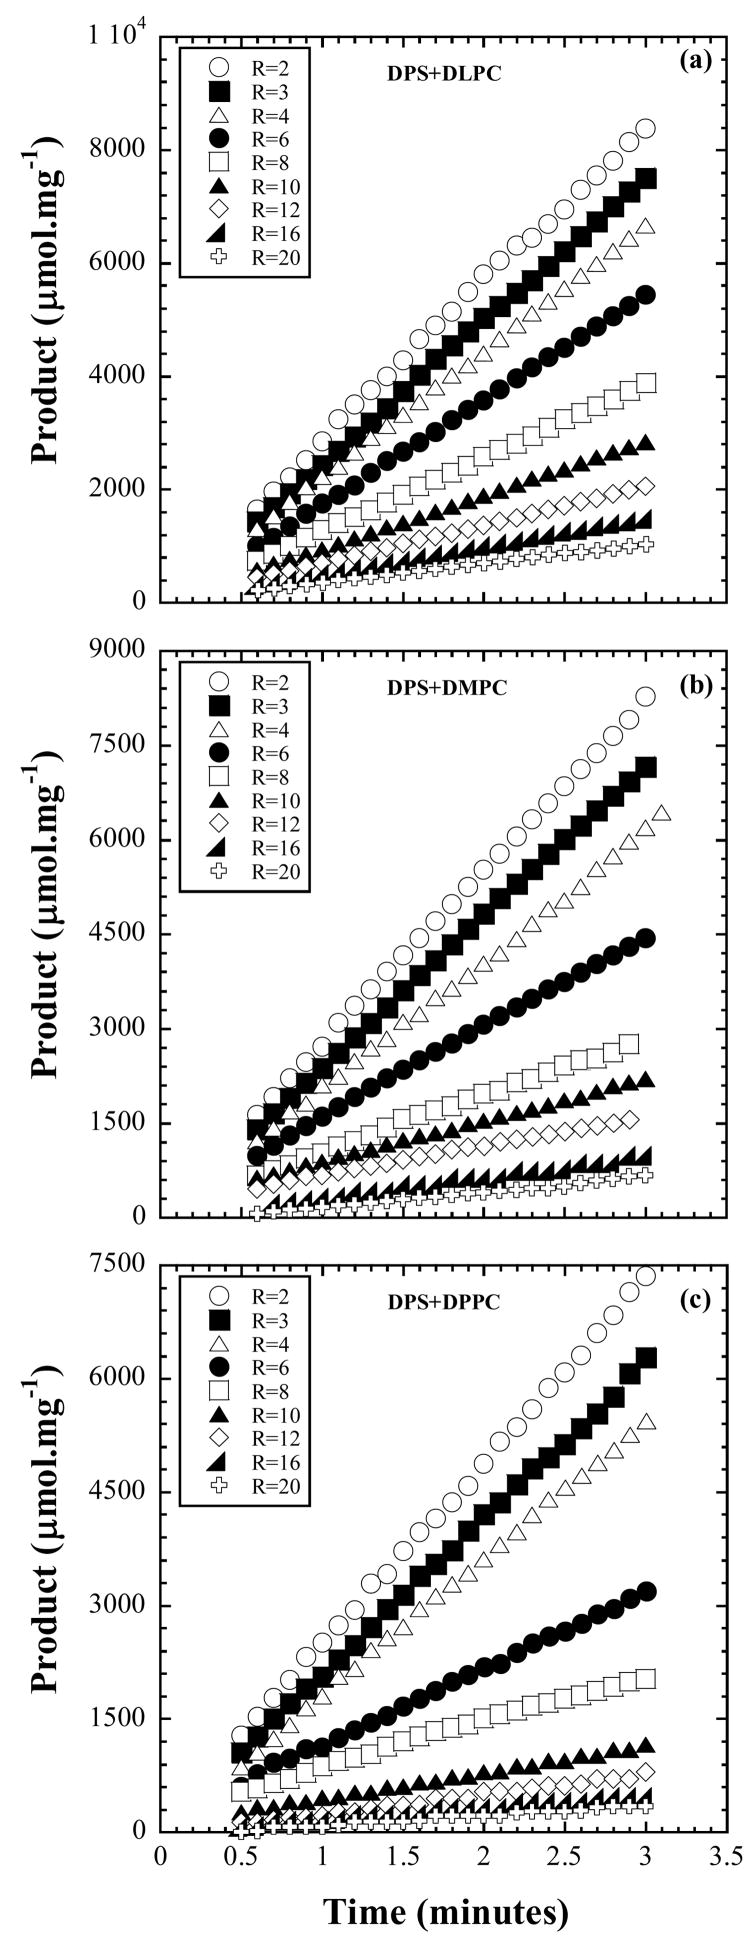
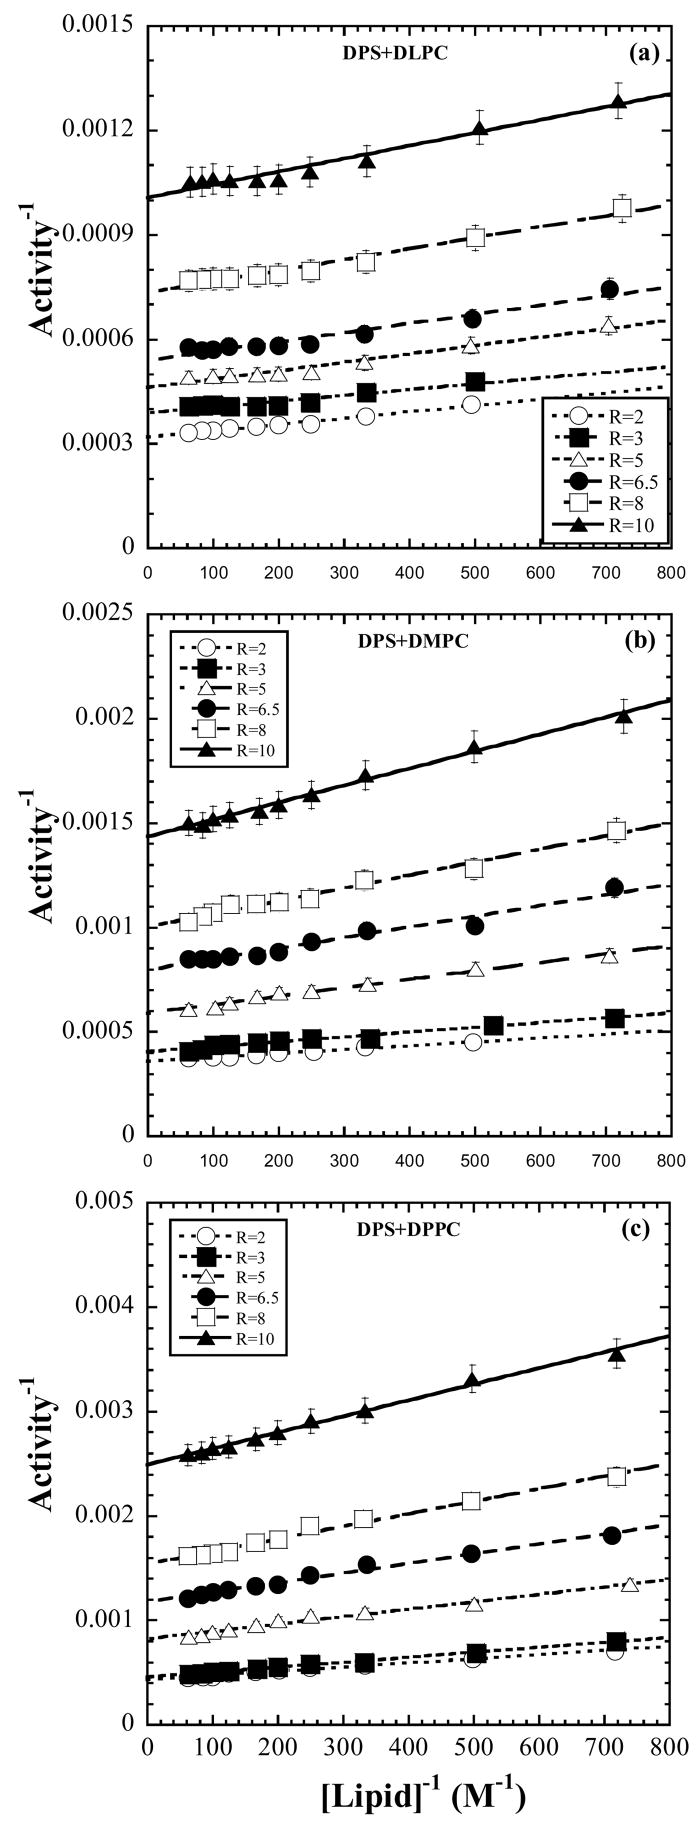
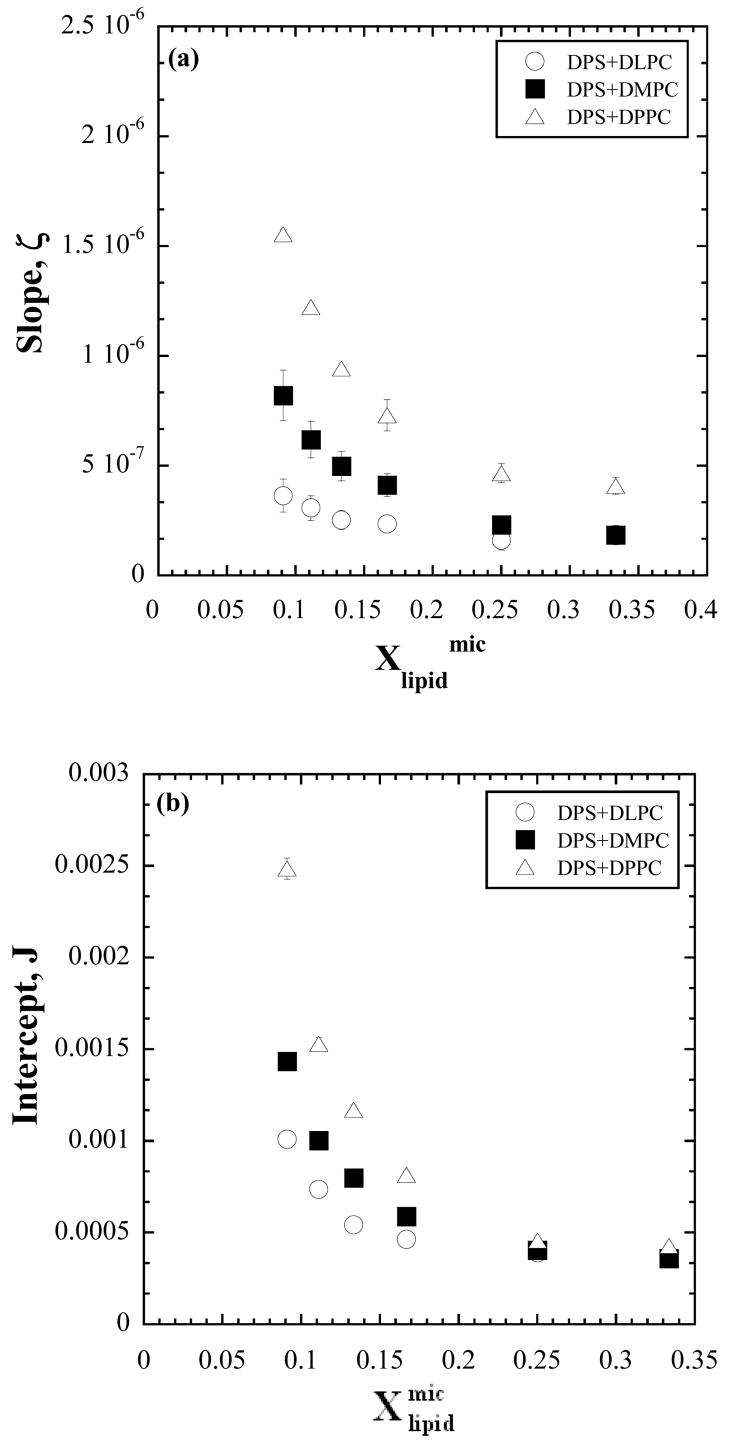
The curves in Fig. 1 are representative of the reaction progress curves. Numerical values for the activity (eq. 5 and §2.3c) are obtained from the slopes of reaction progress curves and treated according to the protocol described in §2.2b. For the six [micelle] dilution series each of constant composition or [S], the reciprocals of the activity are viewed against the reciprocals of [lipid] as in Fig. 2. The data indicate linear variation and do not exhibit scatter, presumably due to the precautions exercised as described in Section 2c. The slopes, ζ, of the linear variation according to eq. 13, being solely dependent on constants and on KS, KM, and k3, would be constant if these parameters were constant. The slopes however, as found in Fig. 3, decrease with increase in [S] or . The heterogeneity in slopes was tested using a general linear model with an interaction term between [S] treated as categorical and [lipid]−1. The slopes were significantly heterogeneous for all three lipids (DLPC: F5,45=10.199, P<0.001, R2=0.998; DMPC: F5,45=76.283, P<0.001, R2=0.999; DPPC: F5,48=142.200, P<0.001, R2=0.999) The test was implemented in SYSTAT 200. For each lipid, the low P-value justifies rejection of the null hypothesis that the slopes are homogeneous, given the data. The R2 values indicate that almost all the variation in inverse enzyme activity was explained by fitting lines with separate slopes.
Figure 1.
Reaction progress curves of product formed due to activity of bacterial PLC on diacylphosphatidylcholine solubilized by DPS forming mixed micelles. Three different acyl lipid chain lengths were investigated. The data shown are for the surface dilution series obtained with [lipid] = 0.010 M and [DPS] = R[lipid]. The substrate concentration is diluted by increasing R.
Figure 2.
Double reciprocal plots of inverse of the bacterial PLC micellar substrate activity vs. inverse of the molar concentration of phospholipid for six different micelle dilution series each of constant composition given by for each of the three lipids: (a) DLPC; (b) DMPC; (c) DPPC in mixed micelles with the surfactant DPS. The series is also described by constant [S] or constant . The solid lines are fits to the predicted linear variation of eq. 12.
Figure 3.
Investigation of the variation with of the (a) slopes, ζ, and (b) intercepts, J, of the lines in Fig. 2. An exponential dependence is indicated.
Note that , aggregation numbers and thereby the micelle area, Amic remain constant in the constant [S] series. This means, [S] and are linearly proportional to each other in this series and any functional variation with [S] can be regarded as a variation with as well. A preliminary examination of Fig. 3 suggested an exponential dependence. This gives good reason to hypothesize that the kinetic parameters are not constants because they can depend on the micellar microstructure which changes with [S]. The standpoint here is that the interface kinetic model is basically sound because it is based on reasonable hypotheses as represented by the kinetic steps (eq. 2–4) and that the possibility of the microstructural dependence of kinetic parameters needs to be examined. The exponential nature of the dependence suggests that some of the kinetics might be of the nature of Arhenius type of activated processes because rate constants of such processes depend exponentially on a free energy of activation and that this activation free energy depends on . Furthermore, the slope does not tend to zero for large . Possible effects the microstructure can have on the rate constants of the various kinetic steps and thereby on the parameters, KS and KM, are now considered.
3.1. Effect of microstructure on KM
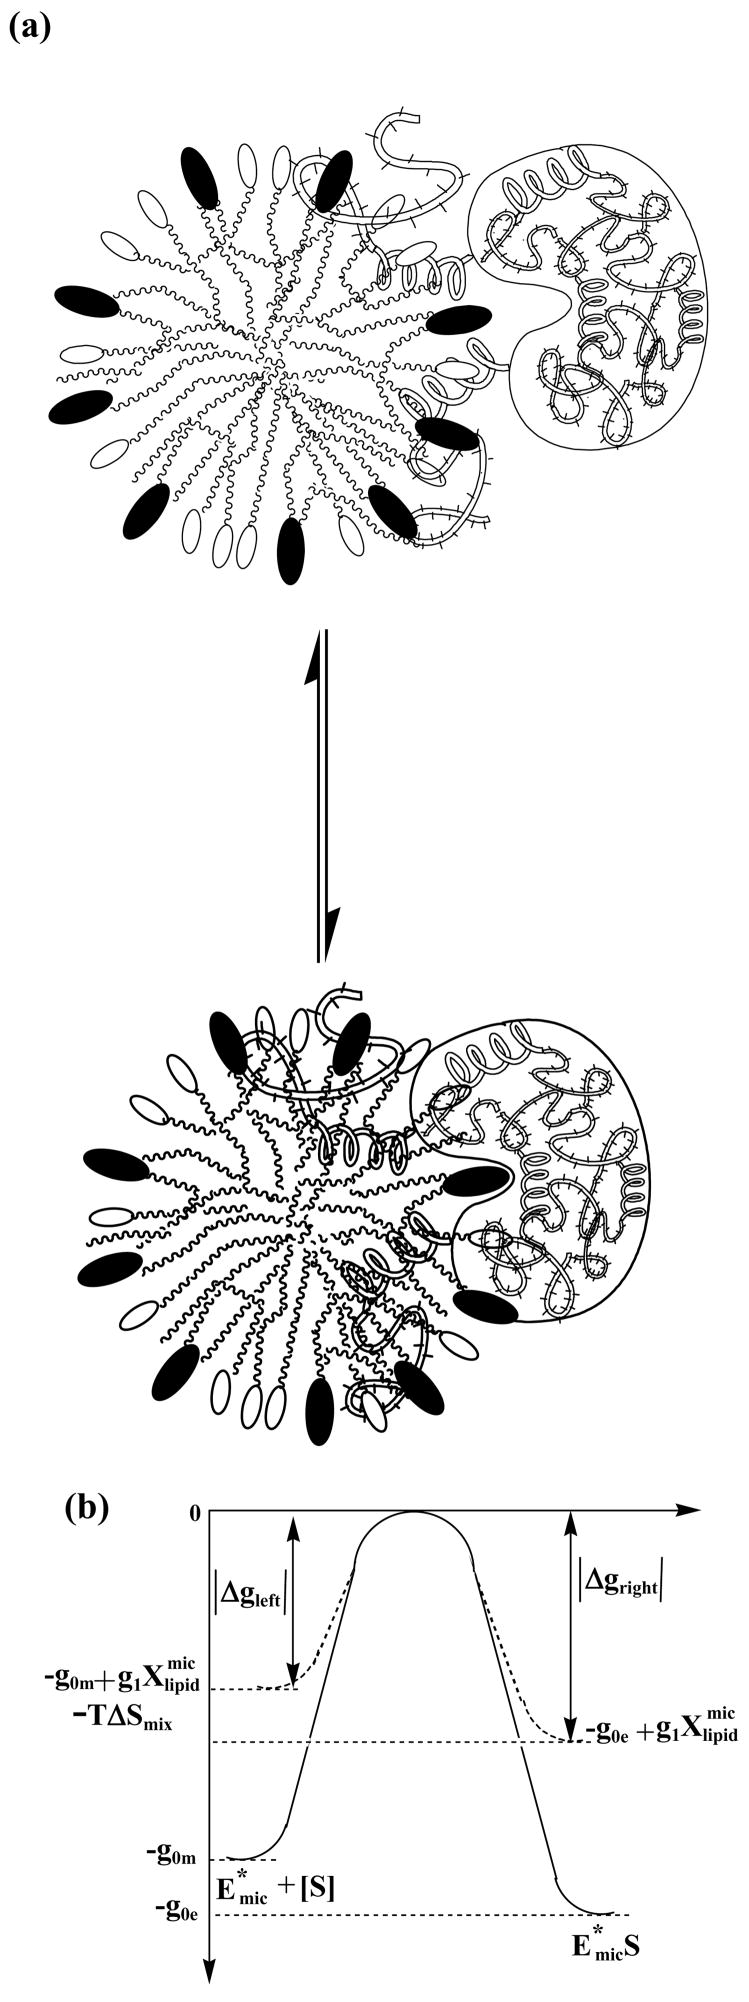
Following the conventional theories for rate constants, the model proposed for the rate constant k2 and k−2, that was also found to explain the data, is as follows. In the kinetic step (ii) the lipid binds to the micelle-bound enzyme. This step is visualized in Fig. 4a. The enzyme bound lipid and the micelle solubilized lipid are two thermodynamic states with a free energy barrier in between, Fig. 4b. In both of these states the lipid is in the micelle, as depicted in Fig. 4a, that visualizes the lipid as reaching out of the micelle, binding to the enzyme and anchoring the enzyme to the micelle 19,27–29. In the process the lipid transfers across a free energy barrier from one micro environment to another. The higher the barrier the slower the rate of transfer, so that k2 and k−2 as might be expressed for activated processes are;
Figure 4.
(a) Visualization of the kinetic step (ii) for the binding between micelle solubilized lipid and micelle bound enzyme. (b) Proposed free energy model diagram showing the free energy levels of the two lipid states: micelle solubilized state (left) and enzyme bound state (right) and the free energy barrier.
| (16) |
The height of the barrier, |Δgleft, right|, is the magnitude of the molar free energy difference between the free energy of the lipid at the top of the barrier (“transition state”) and the lipid in the micelle (left side in Fig. 4b) or lipid –enzyme-micelle complex (right side in Fig. 4b); R is the gas constant. Taking the free energy per lipid molecule to be 0 at the top, the heights of the barrier for the forward and reverse transfers are written down first and subsequently explained:
| (17) |
The free energy of the lipid in the micelle, |Δgleft|, increases from some initial value −g0m with contributions from the internal energy of molecular interactions, the entropy (configuration), and the entropy of mixing, . In a first approximation, we write the internal energy and the configuration entropy part to be linear in with a coefficient g1. The enzyme-bound lipid is bound to the micelle as well and its free energy, |Δgright| increases also as from some base value −g0e, but without the entropy of mixing.
Rewriting eq. 16 for k2 and k−2 using eq. 17 gives,
| (18) |
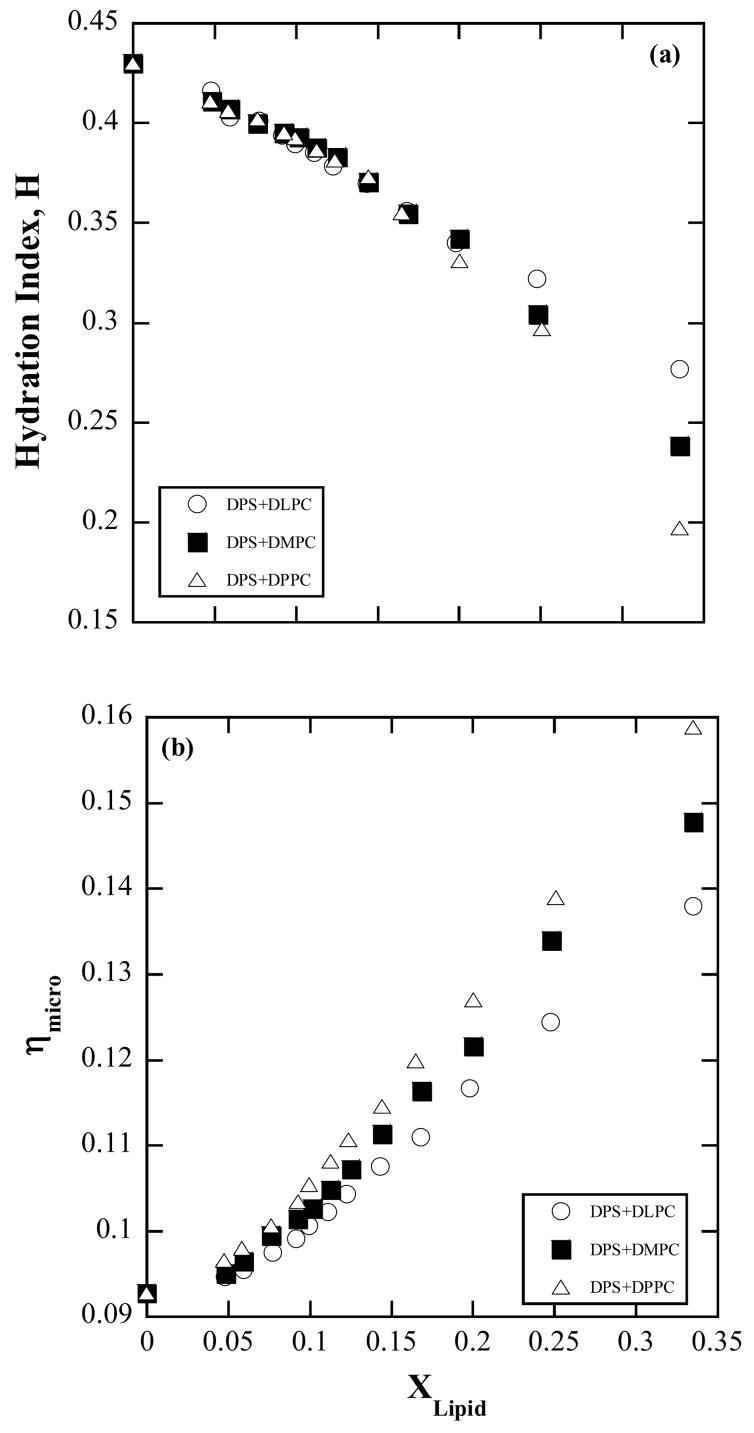
The pre-exponent terms k20 and k−20 now include the g0m and g0e terms respectively. Eq. 18 expresses the relation that the free energy per lipid molecule in the mixed micelle increases with the increase in the molar fraction of the lipid. The idea expressed by eq. 18 is that as lipid content in the micelle is increased, the transfer of the lipid between the micelle and the enzyme becomes easier, because the height of the barrier becomes shorter. To understand this physically, the micelle may be viewed as an assembly of molecules that become increasingly tightly packed as more lipids are introduced. The tightness of packing is reflected by the increase in microviscosity (or decrease in fluidity) and decreased hydration index (see data in appendix)16. The increased tightness of packing causes the micelle lipid free energy to increase and the barrier for transfer consequently reduces. The rate constant k3 is independent of the micelle lipid composition because the catalytic step occurs after the capture of the lipid by the enzyme and the micelle involvement does not change in this process. The parameter KM may then be written as,
| (19) |
3.2. Effect of microstructure on KS
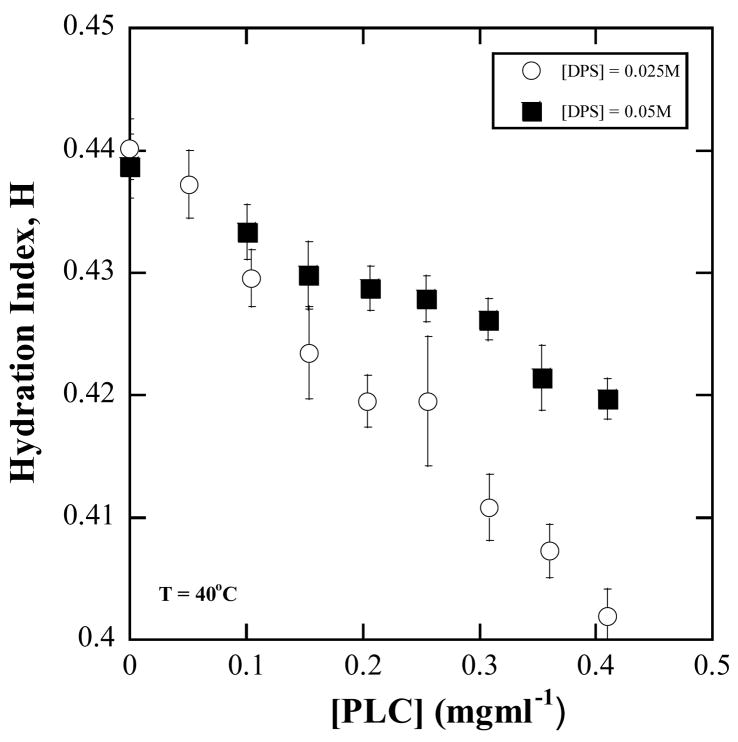
The parameter KS of step (i) is the enzyme-micelle dissociation constant, and is determined by the ratio of the micelle dissociation rate to the micelle association (or binding) rate constant. The bacterial PLC enzyme was found to bind to the DPS micelle even in the absence of lipid. Evidence was obtained from measurements of micelle hydration by ESR methods (Fig. A3). The hydration index of DPS micelles was measured with and without the presence of PLC in solution. The hydration index of DPS micelle decreased from 44 % in the absence of enzyme to 40 % percent in the presence of 0.4 mg/ml of enzyme. This indicates that the enzyme binds to the micelle irrespective of the presence of the lipid and displaces water from the micelle headgroup area, which is observed as a decrease in hydration. This finding is supported by studies using gel filtration chromatography that demonstrated binding of PLC to ionic, zwitterionic, and non-ionic detergent micelles not containing lipids 30. In view of this we treat KS of the initial binding step for micelle and PLC to be independent of . Another phenomenon that can influence the enzyme-micelle dissociation rate constant is the hopping of the bound enzyme from one micelle to another during a collision between micelles 31. Hopping includes this form of direct jump in addition to enzyme dissociation/association with the micelle through the solvent. The rate of hopping involving transfer in a collision, kh,, is then given by the collision rate of micelles which is proportional to the micelle concentration. The transfer jump is taken to be instantaneous, so that the micelle association rate is not affected, but the dissociation rate constant is increased by kh, so that KS becomes,
Figure A3.
Observations on H of DPS micelles at two different constant [DPS] concentrations of 25 mM and 50 mM. H decreases as enzyme is added to the micellar solution.
| (20) |
where KS0 replaces , the enzyme-micelle dissociation constant in the absence of hopping; kh0 is the proportionality between kh and [micelle] and α replaces . In the last equality, the micelle concentration is expressed as , where NT is the total aggregation number and R is the ratio of [DPS]:[lipid].
The scooting mode of enzyme-lipid association in which the enzyme is tightly bound to a micelle and stays on that micelle is unlikely for the present substrate system. The observation of sustained activity over more than 5 minutes and the level of activity observed precludes the possibility that the enzyme remains on the same micelle because the number of lipids per micelle is typically about 15 to 20 and they would be hydrolyzed in a short time and secondly the only micelles that participate would be those with the enzyme on them leading to low levels of activity.
3.3. Effect of microstructure on Activity
Introducing the above structures of KS and KM into eq. 12 yields
| (21) |
The slope of the inverse activity vs. inverse [lipid], (eq. 13) no longer constant, varies with the lipid composition of the micelle as,
| (22) |
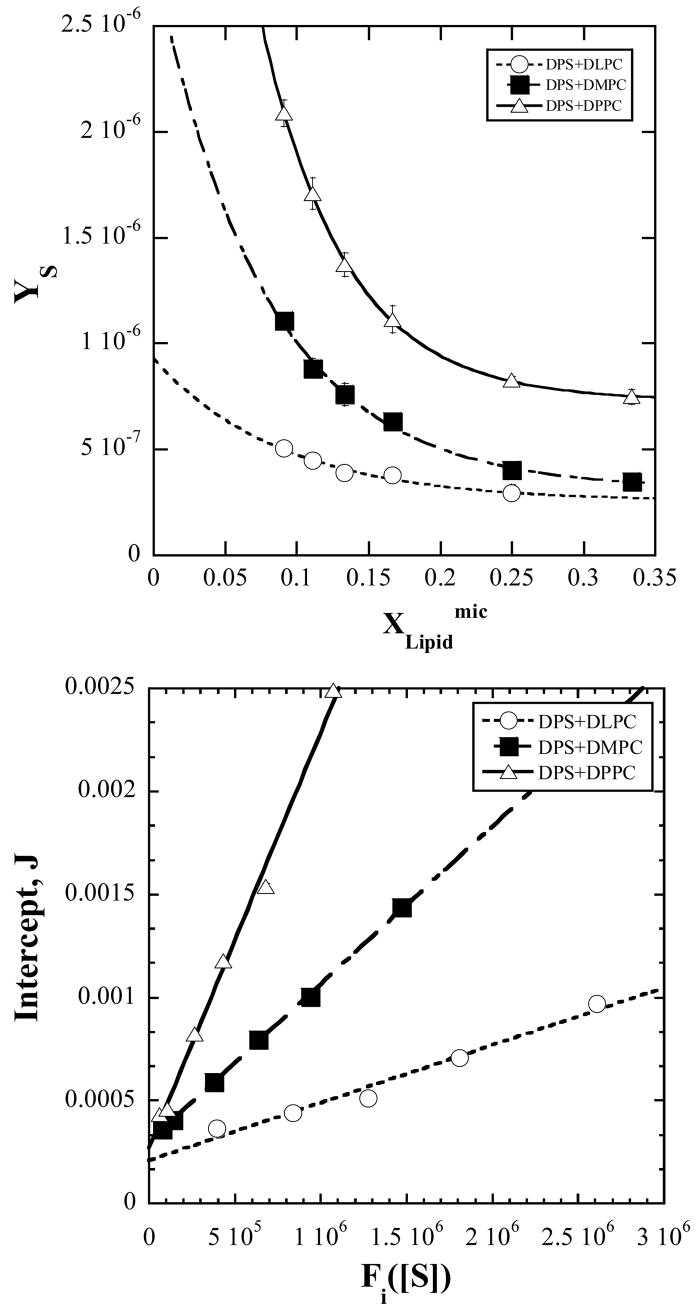
where the slope is modified to YS as defined above for convenience of graphing and clarity of presentation. The prediction of eq. 22 is that YS varies exponentially with . The experimental values of YS are examined for this behavior in Fig. 5. A fit yields g1, and . The intercept, J, of Fig. 5 can also be examined. The model in eq. 21 predicts the composition dependence of the intercept, J, to be,
Figure 5.
(a) Observed micelle composition dependence of the modified slope, YS, and fits to the exponential variation predicted by the model in eq. 22. The fits yield g1, and for each of the investigated lipids.
(b). Data points are the observed intercepts J vs, the composition dependent function Fi ([S]) (defined by eq. 23). The line is that predicted by eq. 23 calculated with the values obtained in part (a) for the fit parameters g1 and .
| (23) |
where Fi([S]) denotes the micelle composition dependent part of J. The function Fi([S]) is first calculated from the known values of [S], the compositions; R and , the aggregation number NT and the fit results of YS vs. (Fig. 5) for g1 and KM00/KM0 and α = 0. α is then adjusted to find that value which gives the best straight line for J vs. Fi([S]). The resulting plots of such a procedure are shown in Fig. 5b. The best fit to a straight line was obtained for α = 0. This means that hopping is insignificant and that the solvent mediated enzyme-micelle binding is the dominant mechanism. The slope and intercept of J vs. Fi([S]), then give the constants and . In summary, between YS vs. and J vs. Fi ([S]), we have g1, and and and , from which the parameters KM00, KM0, KS0, and k3 can be individually calculated using a model value for a0 (425 Å2) 19. The parameters thus derived are presented in Table 1.
Table 1.
Numerical values for the thermodynamic and kinetic parameters obtained from fits of the activity data to eq. 12 together with eq. 19 and 20.
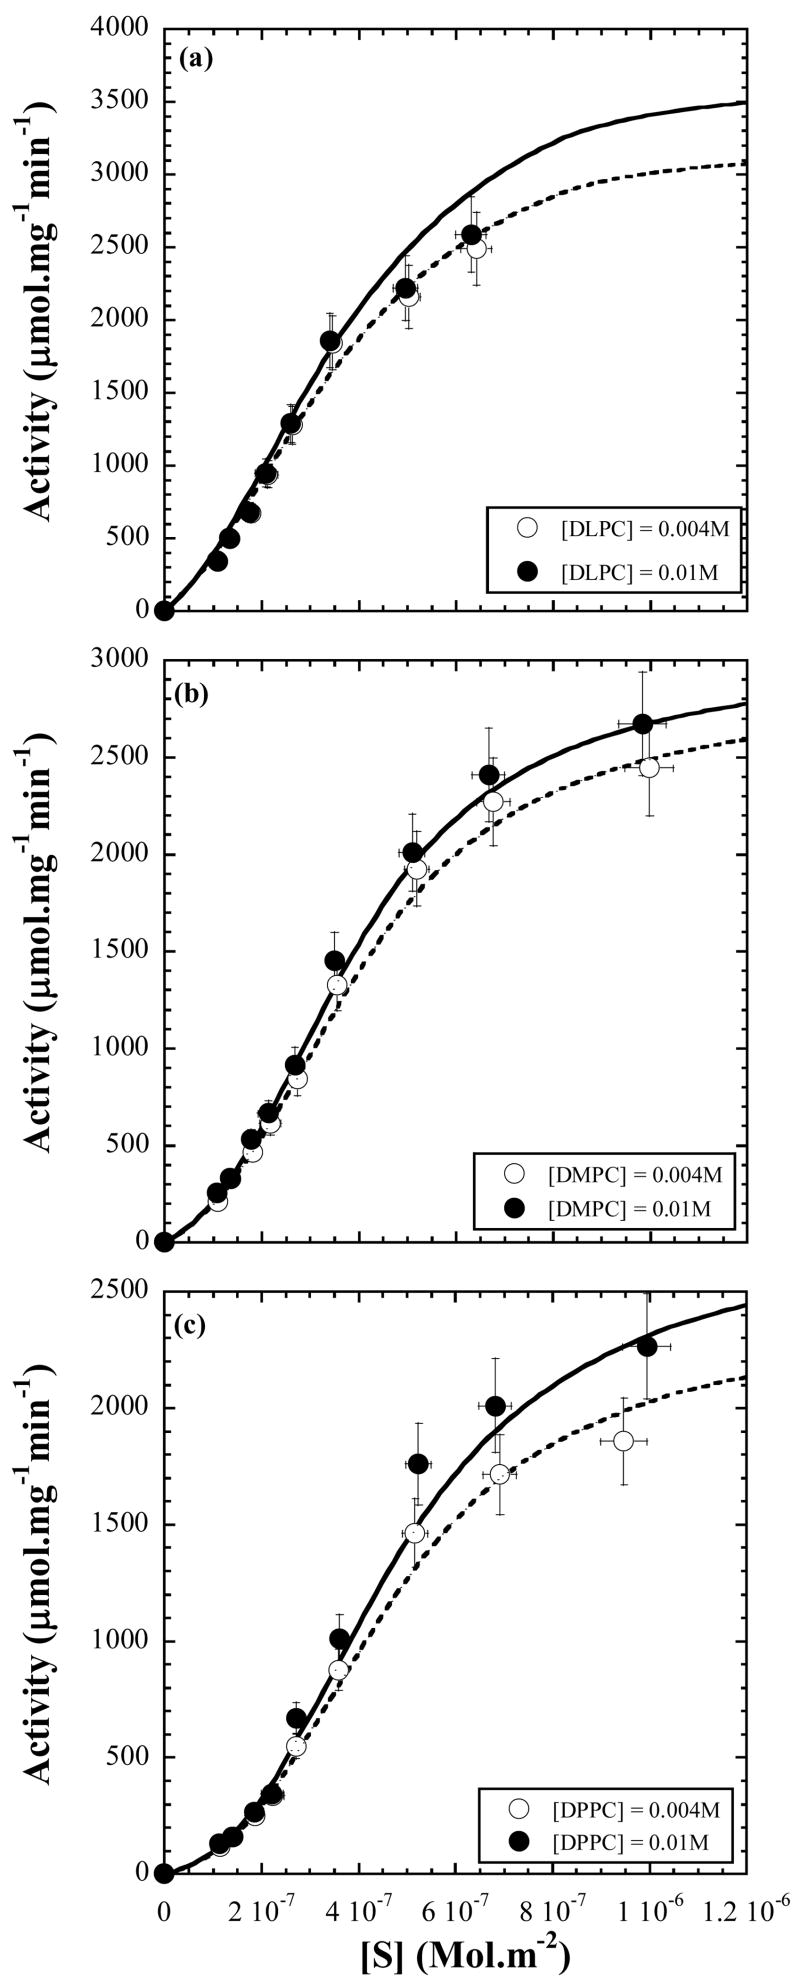
In Fig. 6, we cross-check how the model works for the surface dilution series in which neither the micelle concentration nor [S] is constant. Using the derived values of the kinetic constants given in Table 1, the activities are calculated for several values of [S]. The measured and calculated activities are found to be in excellent agreement.
Figure 6.
The observed variation of the measured activity for the surface dilution series (constant [lipid] and varying [DPS]). The lines are the calculated variation according to eq. 10 and 11 with values of the kinetic constants and parameters predicted by fits of the data on the micelle dilution series to the interface kinetic model and the model for the kinetic parameters.
4. Discussion
The main significance of the work presented is in providing an improved kinetic scheme toward mechanistic elucidation of enzymatic lipolysis. Specifically, the interface medium effects were expressed by the substrate concentration dependence of the kinetic parameters. From the observation that the experimentally determined slopes, , of A−1 vs. [lipid]−1 of different series each of a different [S], varied exponentially with (Fig. 3), the model for KM was developed with the ratiocination that an exponential variation of kinetic rate constants could have their origin in Arhenius type activated processes. The activation barrier for lipid transfer to and from the enzyme bound state was approximated to decrease linearly with the lipid composition of the micelle and consequently the rate constants of transfer, k2 and k−2, would increase with packing of more lipids in the micelle. This was favored by the physical reasoning that as the lipid component increases, the micelle becomes more packed and facilitates the release of the lipid. There is no direct quantifying parameter for tightness of packing. Rather it is a term signifying lack of ease of motion for a component molecule due to crowding. If the microviscosity were to be taken as an indicator of the tightness of packing, then the physicochemical characterization experiments do show that this property increases with (Fig. A2). However, the correlations described by increase in packing leading to decrease in barrier height leading to increase in k2 cannot be carried on indefinitely, because if the molecular motion reaches a rigid limit or, in the extreme case, freezes then it means k20 itself is not viable. Otherwise vesicles (with tighter packing) would be more efficient than micelles as substrates, but this is not so32. Reduced activity in vesicles, membranes, and monolayers at increased surface pressures has been attributed to tightness of packing because a portion of the enzyme needs to insert itself into the lipid structure prior to hydrolysis 10,33,34. Activity measurements were carried out on DPPC vesicles, which were prepared by vortexing a solution of 4 mM DPPC in water for ten minutes. The activity was found to be 75 μmol/min/mg, considerably lower than that in DPPC/DPS micelles (Fig. 2c and 6c). Comparison of the derived values of g1 (Table 1) for the different lipids shows that g1DLPC < g1DMPC < g1DPPC: as the acyl chain length increases the free energy coefficient for composition dependence increases. When interpreted in terms of packing, the longer the fatty acid chain length the tighter the packing. The DPS/DPPC mixed micelles exhibit the greatest increase in microviscosity from the value at Xlipid = 0, followed by DPS/DMPC and then DPS/DLPC corroborating that longer chain lipids experience tighter packing (Fig. A2). This does not mean that the barrier height for enzyme binding decreases and k2 increases with chain length because the zero of the free energy need not be the same for the different lipids. So g1 values cannot be used to compare k2 of the different lipids. Chain length dependence of the activity was observed in some early work35. The present data suggest that these differences might be related to the differences in the kinetic constants due to the packing structure. Packing, lipid configuration, and strength of enzyme-lipid binding may also affect the catalytic rate, k3, which is observed to decrease with chain length. The chemical step occurs when the lipid is enzyme-bound. In this state, the longer chain lipid being more hydrophobic may be less strongly enzyme-bound than a shorter chain lipid, (that is, longer the lipid chain lesser the free energy advantage in being enzyme-bound or smaller the |g0m−g0e|; Fig. 4b) making its proximity to the enzyme less probable and resulting in smaller k3.
Figure A2.
Composition (molar fraction of lipid in solution) dependence of the (a) hydration index, H, and (b) interface microviscosity, ηmicro, obtained from ESR experiments.
The bacterial phospholipase C enzymes are water-soluble and also bind to the interface. The possibility of enzyme hopping between collision partners during an intermicellar collision was included by writing KS as a sum of the solvent mediated dissociation constant, KS0 and a part due to hopping written as α[micelles] to account for the micelle concentration dependence of the micelle collision rate (eq. 20). The present observations are that the bacterial PLC binds strongly to DPS/lipid mixed micelles with a dissociation constant for solvent mediated binding, . The enzyme binds to the DPS micelle even in the absence of lipids (Fig. A3). A value of zero for the hopping coefficient α implies that the probability of enzyme hopping between micelles is slim. Strong hydrophobic binding is indicated because such a binding would prevent the enzyme from disengaging easily from the original micelle and transferring to the second micelle in an intermicellar collision. The nature of interface binding has not been clearly established. It could be both of non-specific binding via hydrophobic peptide parts and binding of a specific residue to the zwitterionic detergent 7,10,28,36.
5. Summary and Conclusions
We adopted and developed the model of Deems et al. and found that the improved scheme facilitates derivation of microstructural effects from the kinetic data 19,30. Rewriting the original kinetic equations in terms of micellar properties recognizes the activity as an interface phenomenon. Substrate aggregates with proven physicochemical properties permitted design of reliable assays and controlled investigation. The method of viewing and treating the data as in Fig. 2–5, was found to be an eminent approach to investigating aggregate microstructure effects.
The main contributions of this work are the new physical insights into the kinetic model with respect to how the substrate aggregate microstructure is placed vis. à vis. the parameters of the model and the expressions for the thermodynamic and kinetic parameters. The greater structure brought to the original kinetic model was able to describe experimental data on the activity of bacterial phospholipase C on phosphatidylcholine substrates very well. The main findings of this investigation are that the enzyme-lipid binding that occurs at the interface is an activated process with a free energy of activation that depends on the packing structure of the lipid in the micelle because of which the level of activity depends on the lipid chain length; enzyme hopping between micelles is not significant compared to the solvent mediated enzyme-micelle binding. The constants derived from fitting of the data are physically reasonable. Experiments with other phospholipid metabolizing enzymes such as phospholipase A2 and phospholipase D may provide answers on the scope and limitations of the model in describing kinetic profiles of interfacial catalysis. The present experimental data nevertheless support the hypothesis on the role of the interface in the reaction. The newly developed parameter structures in this work quantify that role.
Acknowledgments
This project was supported by the NIH through the grant S06 GM048680. The authors thank Professor Paul Wilson of the Department of Biology for performing the statistical tests on the data.
Appendix
a. Physicochemical Characterization data
The methods used to obtain the microstructural data used in this work are amply described in our previous publications 16, 37–39. Only a brief outline and data are presented here.
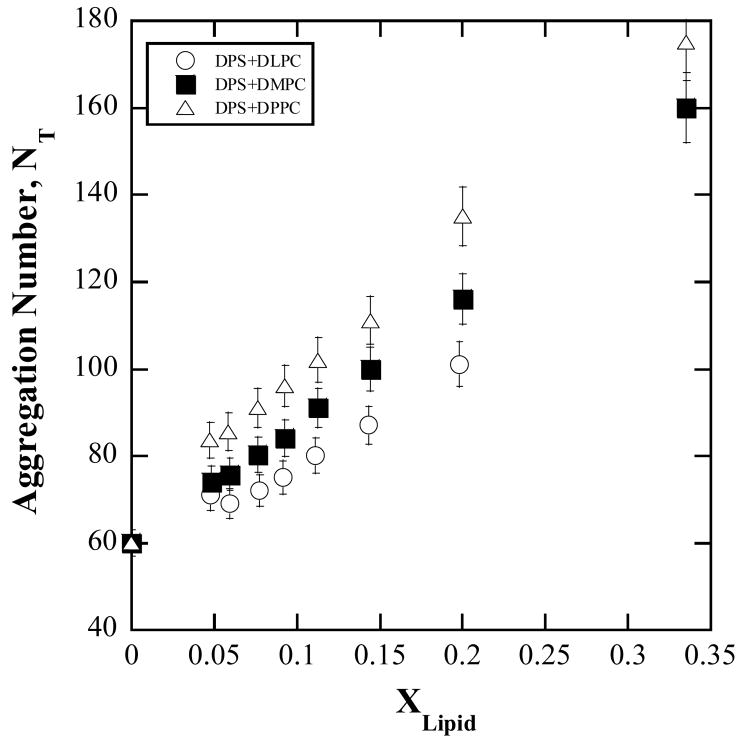
In TRFQ methods, the quenched fluorescence decay of hydrophobic fluorophores solubilized in micelles is measured 40–42. Employing Pyrene as the fluorescence probe and dimethylbenzophenone (DMBP) as the quencher, TRFQ measurements were carried out on several DPS/lipid micellar solutions of various compositions. The micelle concentrations and the aggregation numbers were determined from fits of the decay curves to the Infelta-Tachiya micellar quenching model 43. The composition dependence of the aggregation numbers is given in Fig. A1.
Figure A1.
Composition (molar fraction of lipid in solution) dependence of the total aggregation number, NT = Nlipid + NDPS derived by TRFQ methods. Individual values of Nlipid and NDPS can be easily determined from NT and the composition 16.
Electron Spin Resonance (ESR) methods employ spin probes incorporated into the micelle to determine the micelle hydration index, H, defined by the polarity or the volume fraction of water in the environment of the spin probe and the microviscosity, ηmicro, of the micelle/water interface16,44. Using 5-doxyl stearic acid methyl ester (5DSE), H and ηmicro were determined for the same micellar solutions that were characterized by TRFQ. The composition dependences of H and ηmicro are shown in Fig. A2. The precision errors in H and ηmicro are < 1%.
The geometrical properties of the micelle; including micelle radius, interface thickness and volume, micelle surface area were then determined by model calculations using the experimentally determined aggregation numbers and hydration indices 16,38,45.
b. Enzyme-micelle binding
Any extraneous molecule when solubilized in a micelle or bound to a micelle displaces water from the interface16,38,46. This is seen as a reduction in the measured H in a spin-probe ESR experiment. Thus spin probes can be candidates for measuring binding. In this work we were interested only in the basic report on whether the enzyme bound to the micelle or not. On the premise that the enzyme binding to a micelle causes a reduction in H, we measured H using ESR of 5DSE for DPS micellar solutions without and with enzyme at various concentrations. The results are shown in Fig. A3. Significant reduction in H is observed and is taken as signifying the presence of strong binding to the DPS micelle. The reduction for [DPS] = 50 mM is greater than when [DPS] = 25 mM, where the micelle concentration would be one half that of the former solution. The fraction of bound micelles when [DPS] = 25 mM is less than that for [DPS] = 50 mM for any given fixed enzyme concentration. So the average H per micelle for [DPS] = 25 mM is greater than that for [DPS] = 50 mM. This rationalizes the observed differences in the degree of change in H between [DPS] = 25 mM and 50 mM with enzyme concentration. Such experiments with lipid mixed micelles are not possible because the enzyme would hydrolyze the lipids. Presence of binding even in the absence of lipid is treated as evidence of binding that is not lipid-specific and therefore variation in binding in the presence of lipid is neglected.
References
- 1.Hoffman WJ, Vahey M, Hajdu J. Archives of Biochemistry and Biophysics. 1983;221(2):361. doi: 10.1016/0003-9861(83)90155-8. [DOI] [PubMed] [Google Scholar]
- 2.Martin SF, Follows BC, Hergenrother PJ, Franklin CL. J Org Chem. 2000;65:4509. doi: 10.1021/jo9915731. [DOI] [PubMed] [Google Scholar]
- 3.Dennis EA. The J Biol Chem. 1994;269:13057. [PubMed] [Google Scholar]
- 4.Dennis EA. Trends Biochem Sci. 1997;22:1. doi: 10.1016/s0968-0004(96)20031-3. [DOI] [PubMed] [Google Scholar]
- 5.Dennis EA. Am J Respir Crit Care Med. 2000;161:S32. doi: 10.1164/ajrccm.161.supplement_1.ltta-7. [DOI] [PubMed] [Google Scholar]
- 6.Berg OG, Gelb MH, Tsai MD, Jain MK. Chem Rev. 2001;101(9):2613. doi: 10.1021/cr990139w. [DOI] [PubMed] [Google Scholar]
- 7.Tan CA, Roberts MF. Biochemistry. 1998;37(12):4275. doi: 10.1021/bi972751s. [DOI] [PubMed] [Google Scholar]
- 8.Lewis K, Garigapati VR, Zhou C, Roberts MF. Biochemistry. 1993;32:8836. doi: 10.1021/bi00085a014. [DOI] [PubMed] [Google Scholar]
- 9.Biasutti MA, Abuin EB, Silber JJ, Correa NM, Lissi EA. Advances in Colloid Science. 2008;136:1. doi: 10.1016/j.cis.2007.07.001. [DOI] [PubMed] [Google Scholar]
- 10.Drin G, Scarlata S. Cell Signal. 2007;19:1383. doi: 10.1016/j.cellsig.2007.04.006. [DOI] [PMC free article] [PubMed] [Google Scholar]
- 11.Tatulian SA, Biltonen RL, Tamm LK. Journal of Molecular Biology. 1997;268(5):809. doi: 10.1006/jmbi.1997.1014. [DOI] [PubMed] [Google Scholar]
- 12.Tatulian SA. Biophys J. 2001;80:789. doi: 10.1016/S0006-3495(01)76058-4. [DOI] [PMC free article] [PubMed] [Google Scholar]
- 13.Ray S, Scott JL, Tatulian SA. Biochemistry. 2007;46(45):13089. doi: 10.1021/bi7015102. [DOI] [PubMed] [Google Scholar]
- 14.Ahyayauch H, Villar AVAA, Goni FM. Biochemistry. 2005;44(34):11592. doi: 10.1021/bi050715k. [DOI] [PubMed] [Google Scholar]
- 15.Ranganathan R, Tcacenco CM, Rosseto R, Hajdu J. Biophys Chem. 2006;122:79. doi: 10.1016/j.bpc.2006.02.012. [DOI] [PubMed] [Google Scholar]
- 16.Singh JS, Miller J, Ranganathan R. J Phys Chem B. 2007;111(31):9317. doi: 10.1021/jp0720340. [DOI] [PubMed] [Google Scholar]
- 17.Titball RW. Microbiological Reviews. 1993;52:347. doi: 10.1128/mr.57.2.347-366.1993. [DOI] [PMC free article] [PubMed] [Google Scholar]
- 18.Singh J, Unlu Z, Ranganathan R, Griffiths PC. J Phys Chem B. 2008;112(13):3997. doi: 10.1021/jp077380w. [DOI] [PubMed] [Google Scholar]
- 19.Deems RA, Eaton BR, Dennis EA. J Biol Chem. 1975;250(23):9013. [PubMed] [Google Scholar]
- 20.Quina FH, Nassar PM, Bonilha JBS, Bales BL. J Phys Chem. 1995;99:17028. [Google Scholar]
- 21.Ranganathan R, Okano LT, Yihwa C, Quina FH. Journal of Colloid and Interface Science. 1999;214:238. doi: 10.1006/jcis.1999.6217. [DOI] [PubMed] [Google Scholar]
- 22.Abdel-Rahem R. Adv in Colloid Interface Sci. 2008;114:24. doi: 10.1016/j.cis.2008.02.002. [DOI] [PubMed] [Google Scholar]
- 23.Lowry OH, Rosebrough NJ, Lewis Farr A, Randall RJ. J Biol Chem. 1951;193:265. [PubMed] [Google Scholar]
- 24.Scopes RK. Analytical Biochemistry. 1974;59:277. doi: 10.1016/0003-2697(74)90034-7. [DOI] [PubMed] [Google Scholar]
- 25.Stoscheck CM. Methods in Enzymology. 1990;182:50. doi: 10.1016/0076-6879(90)82008-p. [DOI] [PubMed] [Google Scholar]
- 26.Nieuwenhuizen W, Kunze H, De Haas GH. Methods Enzymol. 1974;32B:147. doi: 10.1016/0076-6879(74)32018-6. [DOI] [PubMed] [Google Scholar]
- 27.Zhou C, Qian X, Roberts MF. Biochemistry. 1997;36:10089. doi: 10.1021/bi970846o. [DOI] [PubMed] [Google Scholar]
- 28.Seetharam B, Tiruppathi C, Alpers D. Archives of Biochemistry and Biophysics. 1987;253:189. doi: 10.1016/0003-9861(87)90651-5. [DOI] [PubMed] [Google Scholar]
- 29.Soltys CE, Bian J, Roberts MF. Biochemistry. 1993;32:9545. doi: 10.1021/bi00088a005. [DOI] [PubMed] [Google Scholar]
- 30.Burns RA, El-Sayed MH, Roberts MF. Proc Natl Acad Sci Biochemistry. 1982;79:4902. doi: 10.1073/pnas.79.16.4902. [DOI] [PMC free article] [PubMed] [Google Scholar]
- 31.Jain MK, Berg O. Biochim et Biophys Acta. 1989;1002:127. doi: 10.1016/0005-2760(89)90281-6. [DOI] [PubMed] [Google Scholar]
- 32.Goldfine H, Johnston N, Knob C. J Bacteriology. 1993;175:4298. doi: 10.1128/jb.175.14.4298-4306.1993. [DOI] [PMC free article] [PubMed] [Google Scholar]
- 33.Boguslavsky V, Rebecchi M, Morris AJ, Jhon DY, Rhee SG, McLaughlin S. Biochemistry. 1994;33:3032. doi: 10.1021/bi00176a036. [DOI] [PubMed] [Google Scholar]
- 34.James SR, Paterson A, Harden TK, Demel RA, Downes CP. Biochemistry. 1997;36:848. doi: 10.1021/bi962108q. [DOI] [PubMed] [Google Scholar]
- 35.Roberts MF, Otnaess AB, Kensil CA, Dennis EA. The Journal Of Biological Chemistry. 1978;253:1252. [PubMed] [Google Scholar]
- 36.Flesch FM, Yu JW, Lemmon MA, Burger KNJ. Biochem J. 2005;389:435. doi: 10.1042/BJ20041721. [DOI] [PMC free article] [PubMed] [Google Scholar]
- 37.Ranganathan R, Tran L, Bales BL. J Phy Chem B. 2000;104:2260. [Google Scholar]
- 38.Bales BL, Ranganathan R, Griffiths PC. J Phys Chem B. 2001;105(31):7465. [Google Scholar]
- 39.Ranganathan R, Giongo C, Bakshi MS, Bales BL, Hajdu J. Chem Phys Lipids. 2005;135:93. doi: 10.1016/j.chemphyslip.2005.02.004. [DOI] [PubMed] [Google Scholar]
- 40.Gehlen MH, De Schryver FC. Chem Rev. 1993;93(1):199. [Google Scholar]
- 41.Almgren M, Löfroth JE. Journal of Colloid and Interface Science. 1981;81:486. [Google Scholar]
- 42.Almgren M. Kinetics of Excited State Processes in Micellar Media. In: Grätzel M, Kalyanasundaram K, editors. Kinetics and Catalysis in Microheterogeneous Systems. Marcel Dekker, Inc.; New York: 1991. p. 63. [Google Scholar]
- 43.Tachiya M. Chem Phys Lett. 1975;33:289. [Google Scholar]
- 44.Bales BL, Messina L, Vidal A, Peric M, Nascimento OR. J Phys Chem. 1998;102:10347. [Google Scholar]
- 45.Ranganathan R, Peric M, Medina R, Garcia U, Bales BL, Almgren M. Langmuir. 2001;17:6765. [Google Scholar]
- 46.Bales BL, Zana R. J Phys Chem B. 2002;106(8):1926. [Google Scholar]


