Abstract
The quality of SPECT images suffers from the effects of photon attenuation and scatter, and from distance-dependent collimator blur, and many researchers have shown the benefit of compensating for these degradations in the inverse problem. For this work, we examined how using an incorrect collimator-blur model affects the detection and localization of 67Ga-avid lymphomas in simulated chest scans. In particular, we considered whether blur-overcompensation can enhance reconstructed images for purposes of localizing tumors. Variations in the correct linear model for medium-energy, parallel-hole collimators were compared by means of LROC studies with human and localizing model observers. Imaging data consisted of Simind projections of the MCAT phantom, and RBI reconstructions were performed. Our results indicate that tumor-detection performance is not improved by using a mismatched RC model. Reconstruction with increased RC requires more iterations, which leads to longer noise correlations. Our results also suggest a substantial observer insensitivity to the accuracy of the RC model.
I. INTRODUCTION
SPECT acquisitions are routinely degraded by the effects of collimator blur and photon attenuation and scatter. In most cases, however, image quality can be improved by compensating for these effects within the reconstruction process. The imaging of 67Ga-avid lymphomas presents an especially challenging testbed for compensation methods, as the small mediastinal tumors undergo substantial nonuniform attenuation. The most-prevalent 67Ga γ-rays are between 93–300 keV, so medium-energy (ME) parallel-hole collimation is required to control penetration effects. The result is scatter-to-primary ratios that exceed 50%, coupled with poor spatial resolution that emphasizes partial-volume effects. In previous localization ROC (LROC) studies with simulated 67Ga images [1–3], we quantified the improvements in tumor-detection efficiency that could be achieved from accurate compensations. This earlier work sequentially analyzed the effects of applying attenuation compensation (AC), resolution compensation (RC), and scatter compensation (SC): with uncompensated iterative reconstruction as a baseline, human-observer performance showed a consistent gain at each stage of the analysis (Table I).
TABLE I.
Improvements in area under the LROC curve (AUC) obtained from sequential application of AC, RC, and SC in iterative reconstruction. The baseline performance is for uncompensated iterative reconstruction.
| AC | RC | SC | Sequential Gain (% AUC) |
|---|---|---|---|
| ✓ | 41% | ||
| ✓ | ✓ | 15% | |
| ✓ | ✓ | ✓ | 12% |
Those same observer studies also investigated fundamental limits on observer performance based on idealized SPECT imaging physics. In [1], we compared AC with noisy and noise-free attenuation coefficients. Reconstruction with accurate RC was compared to imaging with no distance-dependent collimator blur in [2]. Finally, Farncombe et al. [3] compared perfect scatter rejection versus energy-based scatter correction. The efficiency of each real-world compensation model, computed as the ratio of observer performances with the real and ideal compensations, is given in Table II. Based solely on these efficiencies, the greatest potential performance gain appears to lie with RC modeling. For this paper, we investigated whether selected inaccurate (or mismatched) RC models could provide this gain.
TABLE II.
Efficiencies for real-world compensations applied in 67Ga studies.
| Reality | Ideal | Efficiency |
|---|---|---|
| Noisy AC | Noise-free AC | 100% |
| Energy-based SC | Perfect scatter rejection | 89% |
| ME RC | No collimator blur | 78% |
In particular, we are interested in whether overcompensating for collimator blur can raise the RC efficiency for gallium imaging. Wilson and Barrett [4] reported on tests of mismatched collimator models with a 99mTc brain-imaging protocol. Working with local modulation transfer functions (MTFs) and noise power spectra (NPS), they found longer noise correlations as the compensation was increased. This change had minimal effect for the ideal observer, but the impact on human-observer performance was not tested.
Our work compared six RC reconstruction strategies, including no RC, accurate RC, and very heavy (i.e., exaggerated) RC. The noise and resolution properties of the reconstructions were compared in terms of local NPS and MTFs. The LROC detection efficiency with 2D images was assessed with a channelized linear model observer (CNPW) [5] and a human observer.
II. METHODS
A. System resolution
The spatial resolution of a SPECT camera with parallel-hole collimators is given by
| (1) |
with FWHMi the intrinsic camera resolution and
| (2) |
the geometric spatial resolution [6]. In Eq. 2, w is the hole width, le is the effective hole length (corrected for penetration), a is the distance from the crystal to the collimator, and c is the collimator-object separation.
One can easily show that FWHMsys increases linearly with distance c for large c. On that basis, the RC strategies we tested had various combinations of slope m and intercept b in the distance-dependent 2D Gaussian resolution model
| (3) |
for a camera PSF as a function of distance r (in cm) from the crystal face.
B. Simulated data
In lymphoma management, the uses for 67Ga have included staging, detection of residual tumor, predicting response to therapy, and prognosis. This radiotracer has also been utilized as an indicator for sites of infection and inflammation. For our LROC study, we simulated clinical levels of 67Ga-citrate activity within a discretized 3D mathematical cardiac-torso (MCAT) phantom [7]. The phantom dimensions were 2563 and the voxel width was 0.158 cm. Spherical tumors with a 1-cm diameter had tumor-to-soft-tissue relative activities of 25, 27.5, and 30. The tumor locations were restricted to regions about the lymph nodes as specified by a 3D tumor map that was designed in consultation with physicians in our clinic. The actual tumor positions were randomly sampled within the allowable regions of this map.
Our imaging simulation modeled a step-and-shoot acquisition with the Philips Prism 2000XP equipped with medium-energy (ME) parallel-hole collimators. The SIMIND Monte-Carlo package [8] was used to produce 120 high-count MCAT projection images (with dimensions 128 × 128 and a pixel width of 0.416 cm) covering 360°. The projection data consisted of the 93-keV and 185-keV photopeaks and accompanying scatter windows for 67Ga .
Data sets for reconstruction were formed by adding Poisson noise to the SIMIND projections that was consistent with a total of 14.8 × 10⁶ counts in the two photopeak windows. Of this total, approximately 8.5 × 10⁶ were primary photons, which matches the average count levels in thoracic 67Ga-citrate SPECT acquisitions at our institution. The counts in the two windows were summed for reconstruction. Each data set contained at most one tumor.
Transmission imaging for the purpose of attenuation correction is accomplished on the 2000XP by means of a Tc-99m scanning line source in a simultaneous acquisition. Crosstalk between the 67Ga and Tc-99m was not modeled for this study. To simulate the transmission data, a set of noise-free analytical projections was generated from the MCAT density map. Poisson noise was then added based on an assumed blank scan of 6.5 × 10⁸ counts (≈ 330 counts per detector bin).
C. Image reconstruction and RC strategies
The RBI (rescaled block-iterative) iterative algorithm [9] was used to reconstruct the photopeak data. Six RC strategies, based on the linear model of Eq. 3, were implemented within the projection operator in the RBI reconstruction algorithm. Compensation levels ranged from none to “very heavy” as specified in Table III. The accurate RC had m=0.022 and b=0.07 for the FWHM in both camera dimensions. An approximate, stationary-blur model was also evaluated. The magnitude of the fixed compensation was based on the camera resolution for an object at the center of the field of view. Such an RC strategy would offer a modest benefit for reconstruction time. Each strategy was optimized for the tumor-detection task with respect to number of RBI iterations and the postsmoothing FWHM. This was carried out with a combination of model-and human-observer studies. The optimized parameters are also listed in Table III.
TABLE III.
Summary of the RC strategies and the optimal reconstruction parameters for each. The postsmoothing FWHM is in pixels.
| Strategy | m | b | iters | FWHM |
|---|---|---|---|---|
| None | 0 | 0 | 3 | 3 |
| Approximate | 0 | 0.61 | 5 | 2 |
| Light | 0.017 | 0.07 | 3 | 2 |
| Correct | 0.022 | 0.07 | 5 | 2 |
| Heavy | 0.027 | 0.07 | 7 | 2 |
| Very heavy | 0.032 | 0.07 | 10 | 2 |
The RBI reconstructions also invoked accurate AC and SC. The attenuation coefficients were estimated by reconstructing the transmission data with the block-iterative transmission AB (BITAB) algorithm [10]. This BITAB reconstruction used six iterations with a subset size of 4. A 3D Gaussian postfilter with a two-pixel FWHM was also applied. Scatter correction for the emission reconstructions was performed iteratively using a TEW [11] estimate of the scatter.
The dimensions of the reconstructed SPECT volumes were 1283, with a 0.416-cm voxel size. After postfiltering of the volumes, image slices containing the center coordinates of the lesion locations were extracted. An adaptive upper thresholding procedure [12] was then applied separately for each strategy. Observers in our LROC studies are not permitted to alter the image display, and this thresholding was intended to improve the greyscale resolution within the range of tumor activities. The images were then converted to 256 × 256, 8-bit greyscale format (0.208-cm pixel width).
D. Local noise and resolution properties
Local MTFs [4]—the Fourier transform (FT) of the impulse response (IR) at a given position in the reconstruction—were calculated to provide insight into the effects of reconstructing with incorrect models for the ME collimators. For these calculations, we reconstructed a single noise-free data set both with and without a lesion. The IR was defined as the difference of these, and the unnormalized MTF was taken as the average radial profile of the 2D FT of the central slice through the tumor.
To investigate the noise properties of the RC strategies, we calculated local NPS. This analysis made use of 200 noisy, lesion-free data sets to calculate the Wigner spectrum [4] for the same slice as was used for the MTFs. The NPS was taken as the average radial profile through the Wigner spectrum.
E. LROC observer studies
With each RC strategy, the CNPW model observer read two sets of 300 images. The optimal numbers of iterations for the different strategies were investigated by considering the odd-numbered iterations from 1 through 9 (subset size of 4). Integer values from 0 to 4 pixels (inclusive) were considered for the FWHM of a 3D Gaussian postsmoothing filter. A FWHM of 0 denotes no postsmoothing.
With this model observer, the LROC rating and localization data for a given image f̂ were the max and argmax over pixel index of a test statistic. This statistic is calculated as the 2D cross-correlation between a spatially-invariant observer template and the background-subtracted image f̂ – b, where b is the noise-free background image [5]. Performances are reported in terms of area AL under the LROC curve.
For each of the six RC strategies, the first author read 102-image sets selected on the basis of the model-observer results and our previous 67Ga work [3]. The optimized parameters were taken from the results of these readings.
III. RESULTS
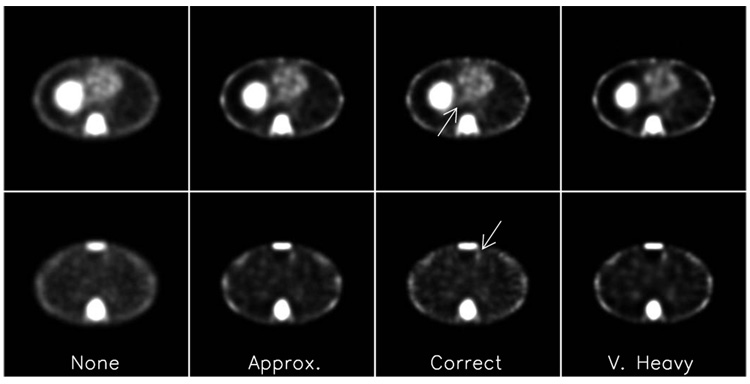
Two sample image slices from four of the optimized reconstruction strategies are shown in Fig. 1. The lesion location in each slice is indicated by the arrow. A blobbier noise texture and some loss of detail near organ boundaries characterize the very-heavy RC strategy. Images from the approximate and correct strategies appear similar.
Fig. 1.
Comparison of sample images. Each row presents a different tumor-present slice, with the tumor location indicated by the arrow.
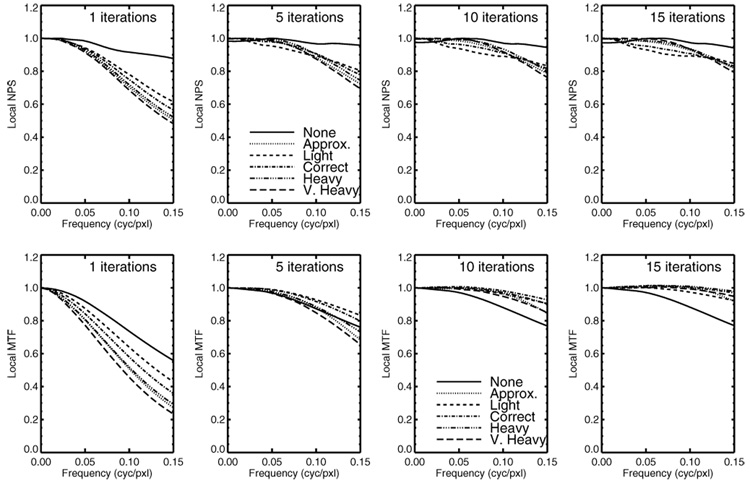
The local NPS and MTFs for iterations 1, 5, 10, and 15 are shown in Fig. 2. The upper row of plots in the figure shows the progression in NPS as the iterations increase. The heavier RC strategies show a reduction in high-frequency noise at the expense of increased low-frequency noise. This tendency towards longer noise correlations corroborates the appearance of the increasingly blobby noise texture seen in Fig. 1 for the very-heavy RC strategy.
Fig. 2.
Local NPS (top row) and MTFs (bottom row) as a function of iteration number.
The bottom row of plots in Fig. 2 shows the progression in MTF for the various strategies as the iterations increase. From this data, we see that heavier RC leads to slower resolution recovery with respect to iteration, as well as exaggerated recovery of low frequencies (ringing). This ringing could explain the loss of edge detail seen in Fig. 1 for the very-heavy RC strategy.
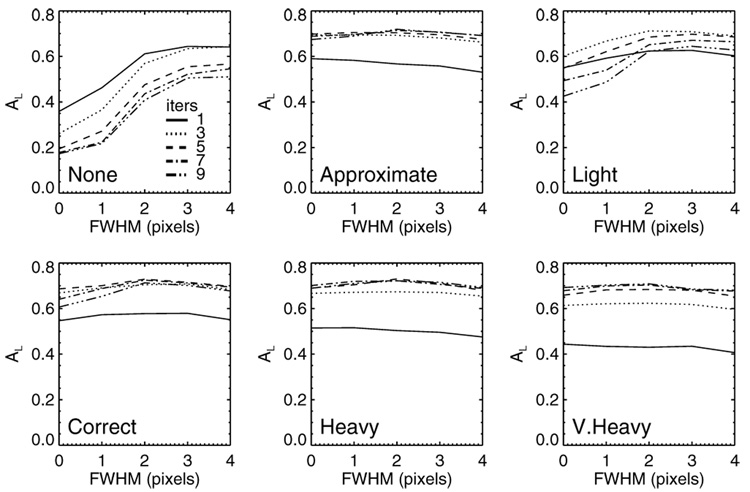
The model-observer LROC results are graphed in Fig. 3. The optimal number of iterations for each strategy increases as the magnitude of the RC strategy increases. As expected, there was a sizable difference in performance between the correct-RC and no-RC strategies. The latter strategy was the worst performer. Nominally, the optimal performance was obtained with the correct-RC strategy, although there were little differences with the light and heavy RC strategies. Overall, the approximate, correct and heavy RC strategies show less variation with parameter choice compared to the other three strategies.
Fig. 3.
CNPW model-observer performances in terms of area under the LROC curve (AL) for the different RC strategies. In each plot, the performance for a fixed iteration number is given as a function of postsmoothing FWHM.
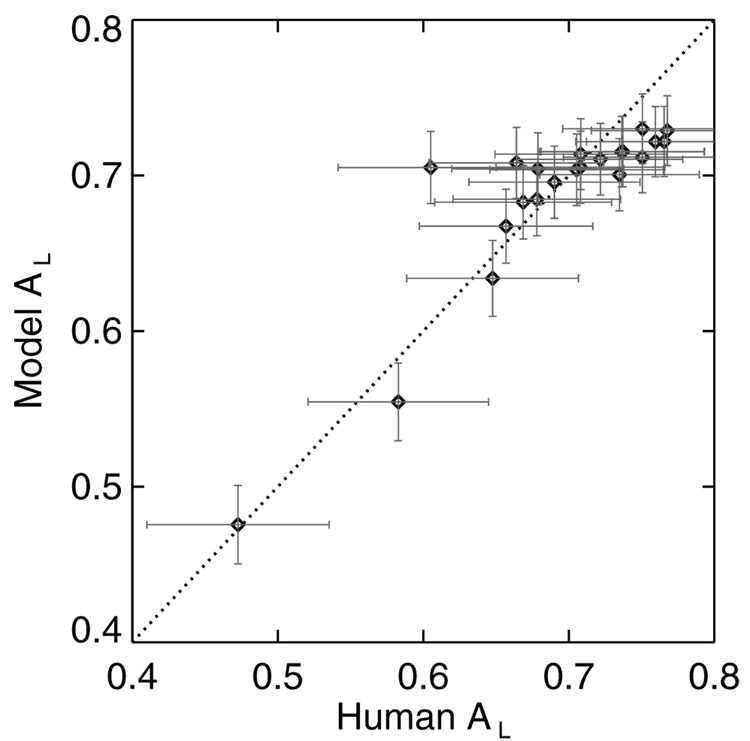
As Fig. 4 make evident, there was good correlation between the human and model observers. This correlation held over a range of detection efficiencies. The human-observer performances for the optimized strategies are listed in Table IV. While there are insufficient statistics to detect any benefit or penalty to having a mismatched RC model, these numbers do suggest that the correct RC is the preferred strategy, although some inaccuracy in the model is permissible.
Fig. 4.
Comparison of human- and model-observer LROC performances. The dotted diagonal line represents equal performance. The error bars indicate the uncertainty in the maximum-likelihood estimate of AL.
TABLE IV.
Summary of human-observer AL for the optimized RC strategies. The uncertainties in AL are ±0.05–0.06.
| Strategies |
||||||
|---|---|---|---|---|---|---|
| None | Approx. | Light | Correct | Heavy | V. Heavy | |
| AUC: | 0.65 | 0.71 | 0.75 | 0.77 | 0.75 | 0.71 |
IV. CONCLUSIONS
Based on the results of our LROC studies, tumor-detection performance is not improved by using a mismatched RC model. Reconstruction strategies with increased RC require more iterations, which leads to longer noise correlations. Our results also suggest a substantial observer insensitivity to the magnitude of the RC mismatch.
Acknowledgments
This work was supported by the National Institute for Biomedical Imaging and Bioengineering (NIBIB) under grant number R01-EB02798. The contents are solely the responsibility of the authors and do not necessarily represent the official views of the NIBIB.
REFERENCES
- 1.Wells RG, Gifford HC, Pretorius PH, Farncombe TH, Narayanan MV, King MA. The impact of noisy and misaligned attenuation maps on human-observer performance at lesion detection in SPECT. IEEE Trans. Nucl. Sci. 2002;vol. 49:753–760. [Google Scholar]
- 2.Gifford HC, King MA, Narayanan MV, Pretorius PH, Smyczynski MS, Wells RG. Effect of block-iterative acceleration on Ga-67 tumor detection in thoracic SPECT. IEEE Trans. Nucl. Sci. 2002;vol. 49:50–55. [Google Scholar]
- 3.Farncombe TH, Gifford HC, Narayanan MV, Pretorius PH, Frey EC, King MA. Assessment of scatter compensation strategies for Ga-67 SPECT using numerical observers and human LROC studies. J. Nucl. Med. 2004;vol. 45:802–812. [PubMed] [Google Scholar]
- 4.Wilson DW, Barrett HH. The effects of incorrect modeling on noise and resolution properties of ML-EM images. IEEE Trans. Nucl. Sci. 2002;vol. 49:768–773. doi: 10.1109/TNS.2002.1039561. [DOI] [PMC free article] [PubMed] [Google Scholar]
- 5.Gifford HC, Pretorius PH, King MA. Comparison of human-and model-observer LROC studies. Proc. SPIE. 2003;vol. 5034:112–122. doi: 10.1109/tmi.2004.839362. [DOI] [PubMed] [Google Scholar]
- 6.Rollo FD, editor. Nuclear Medicine Physics, Instrumentation, and Agents. St. Louis, Missouri: The C.V. Mosby Co.; 1977. [Google Scholar]
- 7.Tsui BMW, Zhao XD, Gregoriou GK, Li J, Lalush DL, Eisner RL. Quantitative cardiac SPECT reconstruction with reduced image degradation due to patient anatomy. IEEE Trans. Nucl. Sci. 1994;vol. 41:2838–2848. [Google Scholar]
- 8.Ljungberg M, Strand SE. A Monte-Carlo program for the simulation of scintillation camera characteristics. Comput. Meth. Prog. Biomed. 1989;vol. 29:257–272. doi: 10.1016/0169-2607(89)90111-9. [DOI] [PubMed] [Google Scholar]
- 9.Byrne CL. Block-iterative methods for image reconstruction from projections. IEEE Transactions on Image Processing. 1996;vol. 5:792–794. doi: 10.1109/83.499919. [DOI] [PubMed] [Google Scholar]
- 10.Narayanan MV, King MA, Pretorius PH, Farncombe TH, Bruyant P. ROC optimization study of Tc-99m cardiac SPECT reconstructions with attenuation, scatter and resolution compensation using hybrid images. J. Nucl. Med. 2001;vol. 42:198P. [Google Scholar]
- 11.Ogawa K, Harata H, Ichihara T, Kubo A, Hashimoto S. A practical method for position dependent Compton-scatter correction in single photon emission CT. IEEE Trans. Nucl. Sci. 1991;vol. 10:408–412. doi: 10.1109/42.97591. [DOI] [PubMed] [Google Scholar]
- 12.Wells RG, et al. Comparing FBP to OSEM SPECT reconstruction using human observers. J. Nucl. Med. 1999;vol. 40:146P–147P. [Google Scholar]


