Abstract
We demonstrate that DiI and Rhodamine B, which are not easily distinguishable to one-photon measurements, can be differentiated and in fact quantified in mixture via tailored two-photon excitation pulses found by a genetic algorithm (GA). A nearly three-fold difference in the ratio of two-photon fluorescence of the two dyes is achieved, without a drop in signal of the favored fluorophore. Implementing an acousto-optic interferometer, we were able to prove that the mechanism of discrimination is second-harmonic tuning by the phase-shaped pulses to the relative maxima and minima of these cross-sections.
Keywords: ultrafast, pulse-shaping, genetic algorithm, two-photon excitation, cross-section
INTRODUCTION
The ability to distinguish different fluorescent species is central to the simultaneous measurement of multiple molecular targets. This capability is the cornerstone of diverse applications of biomedical fluorescence in vitro and in vivo, including determining karyotypes, monitoring gene expression and protein interactions, and identifying metastasis1–6. Algorithms to deconvolve overlapping spectra7,8 are important to the application of novel fluorescent probes9,10, but it remains a challenge to resolve different fluorophores with significant spectral overlap, particularly in high throughput applications. Laser pulse shaping has previously been employed to differentiate spectrally distinct fluorescent species enhancing microscopy and spectroscopy11–14; nevertheless several years have elapsed since the proposal of optimal dynamic discrimination (ODD) using shaped pulses15, with few demonstrated applications16. We demonstrate that DiI and rhodamine B, which are two common dyes not easily distinguishable to one-photon excitation or emission spectral filtering, can be differentiated and quantified in a mixture via tailored17 two-photon excitation pulses enhanced by a genetic learning algorithm. We determine optimal pulse shapes for maximizing the fluorescence of one dye with respect to the other, and achieve a three-fold discrimination without a significant drop in signal of the favored fluorophore, a common side effect of adaptive shaping to control fluorescence. Using an acousto-optic relative two-photon excitation cross-section spectrum measurement, we show that the mechanism of discrimination is second-harmonic tuning to the relative maxima and minima of the two-photon cross-sections. The ability of tailored laser pulse shapes to differentiate and quantify spectrally overlapping dyes holds the key to facilitating many biological applications of fluorescence.
Closed loop learning algorithms18 have become common to coherent control applications that utilize optical or quantum interferences of shaped laser pulses to manipulate processes such as electronic wave packet motion or isomerization. A shaped pulse is generated from a random set of pulses by optimizing a desired experimental output (fitness parameter) through the use of evolutionary improvement processes such as a genetic algorithm (GA).
EXPERIMENTAL SETUP
Ultrashort laser pulses from an amplified laser system were shaped using a Dazzler (Fastlite, Palaiseau, France), which modulates the diffracted output pulse by way of an acousto-optic interaction with an RF wave launched into a TeO2 crystal19,20. A genetic learning algorithm (GA) was used to find the optimal pulse shape, with implementation similar to that already described by Pearson et al.21. Before each experiment, we scanned the incident power to ensure quadratic scaling of all three signals (fluorescence of the two dyes and SHG). This avoids trivial convergences which might hinder or mask discrimination. Photobleaching with a recovery time of several seconds was also noted for repeated measurements anywhere near the saturation region of rhodamine B or DiI.
Samples
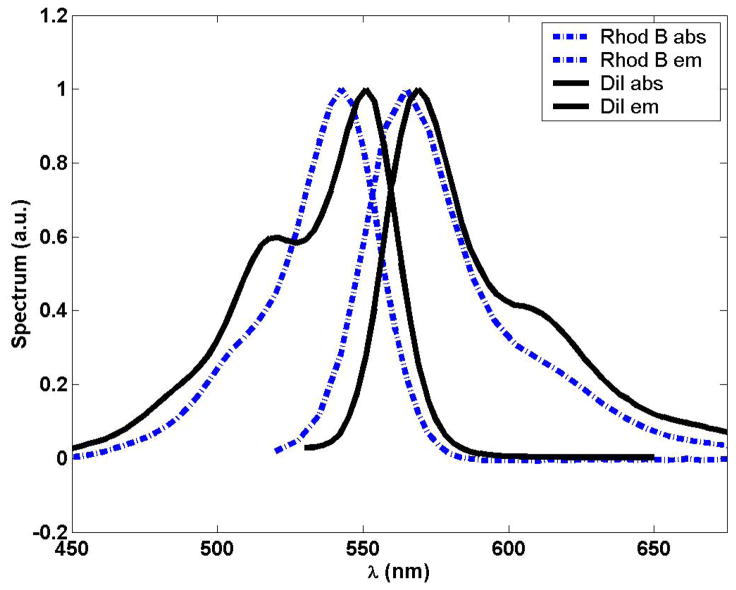
DiI was purchased from Invitrogen Corporation (Carlsbad, CA) and diluted to 20 μM in DMSO solvent. Rhodamine B (rhodamine 610) was purchased from Exciton (Dayton, OH) and mixed to a 1 μM solution in water. The difficulty to distinguish DiI and rhodamine B by one-photon absorption and emission are evident from their spectra22 in Figure 1.
Figure 1.
One-photon absorption and emission spectra for DiI and Rhodamine B.22
Optical layout
The laser system consisted of a regeneratively amplified Ti:sapphire system (RegA, Coherent, Santa Clara, CA) providing up to 4-μJ, 50-fs pulses at 250 kHz with a center wavelength of 800 nm and 27-nm FWHM bandwidth. The controlling electronics of the Dazzler read the diffracted power, center wavelength, bandwidth, and polynomial phase to fourth order from a text file, which in our experiments is automatically generated by the algorithm. Additionally, an amplitude file could be read to spectrally shape the diffracted beam. The phase in different frequency bins could be read from a phase file for complete control of the pulse shape. The Dazzler was triggered by every twelfth RegA pulse for an approximately 20 kHz repetition rate. SHG-FROG measurements confirmed that the approximately 6 shaped pulses falling within the 50% duty cycle of the Dazzler gave precisely the same average two-photon time-frequency characteristics as are obtained when the RegA is operated at 20 kHz. Thus, the effective shaping of all 6 diffracted pulses per launched RF waveform had the same effect in our experiment as if each were synchronized to the center of separate identical acoustic waves in the TeO2 crystal.
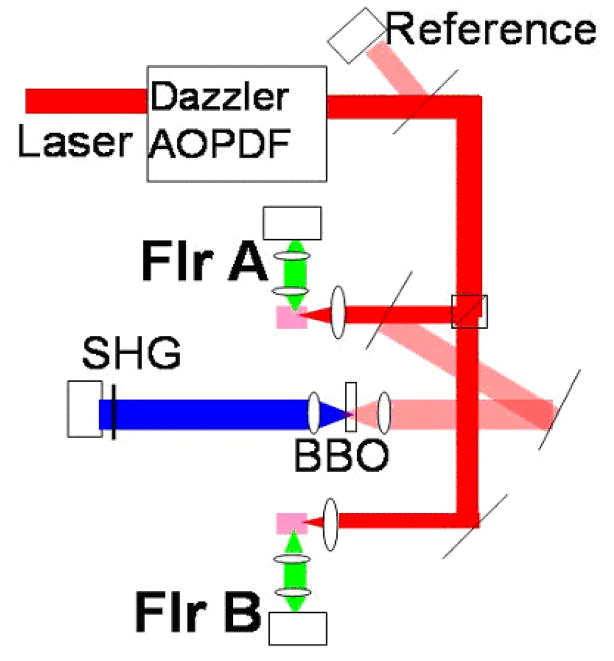
A glass-coverslip beamsplitter enabled a reference reading of incident power Iref by a photodiode (FFD-100, Perkin-Elmer Optoelectronics, Fremont, CA). We defined the efficiency of each two-photon fluorescence signal S as the ratio S/Iref. The excitation beam was then divided into two arms with a beamsplitter, and the relative power in each arm was controlled with a variable reflective attenuator. Each arm was focused into a cuvette holding the dye sample, and the fluorescence signal FlrA or FlrB was collected in the perpendicular direction through an appropriate bandpass filter for detection by a photomultiplier tube (PMT) (H5784-01, Hamamatsu, Bridgewater, NJ). Immediately preceding the lens, the FlrA arm additionally had another glass-coverslip beamsplitter to create a third arm of the experiment. In the third arm, a 500-micron thick beta barium borate (BBO, β-BaB2O4) crystal was used for second-harmonic generation, which was read through a blue absorptive filter by another PMT (R2066, Hamamatsu, Bridgewater, NJ) to give the SHG signal. All four signals Iref, FlrA, FlrB, and SHG were read in parallel as root-mean-square voltage for 2500 samples by a 250 kHz DAQ board (M-series, National Instruments, Austin, TX), which was synchronized by the Dazzler trigger.
Power scaling
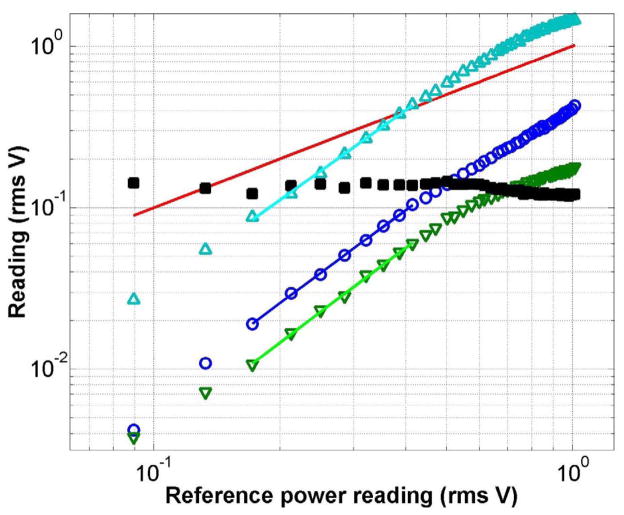
Before each experiment, the incident power was scanned to ensure quadratic scaling of the discriminated two-photon processes, as shown in Figure 3, to ensure that apparent discrimination of dyes is not merely an artifact which would disappear when the laser power is changed. There are three possible causes for subquadratic behavior in the power law scaling of the investigated two-photon signals: saturation of molecular transitions, detector saturation, or scattered excitation light leakage into the detector. Shaped pulse energies after the Dazzler used during experiments were typically on the order of 2 nJ. Assuming a diffraction-limited beam waist, we estimated a typical fluence at the laser focus during experiments on the order of 0.5 mJ/cm2 (peak intensity on the order of a GW/cm2 transform-limited), which is too low to saturate the molecular transitions. Detector saturation was ruled out by an independent calibration demonstrating linearity to much higher signal levels. Scattered light was minimized with bandpass filters and beam dumps. As long as both signals used in the fitness parameter have the same degree of deviation from quadratic scaling, scattered light was not noted to affect the convergence of the algorithm. However, if one dye for example is approaching saturation of the molecular transition while the other is still in the quadratic region, this trivializes the convergence to mere pulse stretching.
Figure 3.
Power scaling of two-photon signals relative to Iref. Blue circles show the SHG signal (typically 0.08 Vrms in the experiments), green downwards triangles show the DiI signal (typically 0.06 Vrms), cyan upwards triangles show the rhodamine B signal (typically 0.37 Vrms), and the red line shows Iref (typically 0.39 Vrms). Axes are in the log scale. Filled black squares show the dependence of the ratio DiI/rhodamine B fluorescent signal on power. Slopes of the shown least-squares linear fit through the center of the data are: 1.92 for SHG, 1.95 for DiI, and 1.85 for rhodamine B.
Pulse search method
The polynomial controls and amplitude and phase file settings to the Dazzler were used as genes of a single circular chromosome to define a specific individual laser pulse. After measuring all four signals for an individual, the adaptive learning algorithm programmed the next individual. Though each measurement of a specific pulse shape lasted only 50 ms, about 500 ms were typically required for the electronics to implement the acoustic wave of a novel pulse shape in the TeO2 crystal of the Dazzler. (Once RF waves for the shapes have been saved for the Dazzler, switching between them is possible in sub-millisecond time.) A random population of 50 individuals was ranked via a fitness parameter, and the best 10 individuals were passed unmodified to the next generation. Remaining individuals of the new generation were created by mating and mutation of fitness-preferenced individuals of the preceding generation. In each generation, signals were also measured for the unshaped pulse, which was obtained by programming the polynomial phase to exactly compensate the dispersion from the Dazzler TeO2 crystal (but not from elsewhere in the optical path). Typically, only polynomial phase was adjusted until generation 30, after which amplitude and phase were adjusted in 20 or more wavelength bins over 60 nm of programmed bandwidth, with the constraint that the acoustic wave cannot be physically longer than the Dazzler crystal.
Pulse retrieval
We characterized pulses with a commercial SHG-FROG23 unit (Grenouille 8–50 from SwampOptics, Atlanta, GA) and software (VideoFrog, MesaPhotonics, Santa Fe, NM). SHG-FROG was performed as soon as possible after the end of the GA experimental run to ensure maximum fidelity of the reproduced pulse to that actually measured in the course of the experiment.
Time-domain two-photon excitation cross-section spectrum measurement
Using the same experimental setup of Figure 2, we acousto-optically implemented a time-domain measurement of the two-photon excitation cross-section spectra of DiI and rhodamine B in the region of interest. The measurement was performed analogously to the description by Ogilvie and colleagues24. However, rather than physically delaying a beam-split replica of the pulse, a virtual Michelson interferometer was programmed into the Dazzler via a changing cosine amplitude mask. In order for the Dazzler to produce delayed replicas of a pulse, we use an amplitude mask cos(ωt0/2) in the frequency domain for 150 intervals in an 80 nm bandwidth, corresponding in the conjugate Fourier domain to a time delay of t0. We only used binary coding of the phase file to be at 0 or corresponding to the sign of the cos function, as absolute and linear phase (absolute time delay) are physically irrelevant when the information is actually contained in the interarrival period of the two pulses25. When the data is Fourier transformed, the two-photon excitation cross-section is extracted with relatively good accuracy in the frequency domain as the divisor of the fluorescent signal by the second-harmonic signal in the region of the2ω0 component. For detailed mathematical proof of this, the reader is referred to Naganuma et al.26 or Trebino’s discussion23.
Figure 2.
Experimental Setup. Dye samples are contained in quartz cuvettes. The incident laser power Iref is measured by a photodiode. After filters to remove the exciting light, the two-photon fluorescence signals A and B are measured in the perpendicular direction by photomultiplier tubes. Second harmonic generation from the BBO crystal is detected by another PMT. Lenses are depicted as ovals.
For maximum concurrence of experimental conditions, as many as four different populations were interleaved into the experimental sequence and tracked with different fitness parameters independently to allow parallel processing of multiple experiments.
RESULTS
Evolutionary search
In our experimental setup (Figure 2), we acquire the fluorescence of two dyes along with measurements of the reference input power and second harmonic generation (SHG, which primarily indicates the proximity of the pulse to its transform-limited duration). Our goal is to discriminate the two dyes, despite the fact that they are indistinguishable by spectral filtering of either the excitation or detection wavelength; hence we attempted to optimize the ratio A/B (or B/A), where A and B are the fluorescence signals normalized to the input reference power. Choosing a fitness parameter of A/B, however, can bias the experiment towards a value of B near zero. At the same time, either increasing A or decreasing B alone should improve the assigned fitness monotonically. This can be accomplished via the multiplicative fitness parameter (A–c)(c−1-B), where values of A and B are normalized to the unshaped pulse measurement (obtained when the Dazzler performs no phase or amplitude shaping beyond compensation of its own dispersion). We have found that setting the constant c to 0.8 yields better convergence in our experimental conditions, relative to the original implementation of unity for c27, as this enables the GA to explore a broader range of signal strengths.
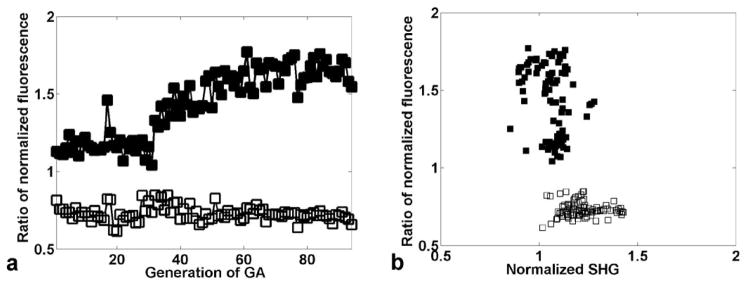
Figure 4a shows the convergence of the GA for parallel experiments maximizing (closed markers) and minimizing (open markers) the ratio of two-photon fluorescence signals as measured by the multiplicative fitness parameter. The highest achieved ratio of DiI to rhodamine B fluorescence is 1.77 (normalized to the unshaped pulse) whereas the minimum in the parallel experiment is 0.61. If we define the numerical discrimination as the divisor of these two ratios, we note discrimination of the two dyes by 2.83 while maintaining the fluorescence of the favored fluorophore at comparable or higher levels than that with the unshaped pulse. This is important for most biological applications where signal-to-noise is a typical limiting factor. For the first 30 generations of the GA, the pulse shaper only varied the polynomial phase up through 4th order and achieves the numerical discrimination of only 1.80. For subsequent generations, arbitrary phase and amplitude modulation were allowed, with typically 20 wavelength bins over 60 nm of programmed bandwidth. The transition from 4th order polynomial to binned spectral control enables a factor of 1.57 improvement in discrimination after generation 30. When the frequency resolution was increased from 20 to 100 frequency bins, a similar level of control (1.77 and 0.65) resulted. Thus, the result is not dependent on high frequency resolution in the pulse shaping. Any possible detector-specific bias of the experiment is excluded by repetition with swapped samples, which again yielded the same level of control (1.68 and 0.68). In addition, when we reduced the search space by excluding amplitude modulation and performing phase-only pulse shaping, the GA converged on a comparable result (1.86 and 0.72).
Figure 4.
Control of the fluorescence ratio of DiI to rhodamine B. (a) Filled black squares show the best individual of the ratio DiI/rhodamine B fluorescence (normalized to the unshaped pulse) for each generation of the genetic algorithm. Open squares show the ratio for the parallel minimization experiment. The discrimination between the dyes is the ratio between the signal obtained using the pulse which maximizes the DiI/rhodamine B ratio to the signal which minimizes the ratio; a maximum discrimination of approximately a factor of three is attained. (b) Normalized fluorescent ratio for the same individuals, plotted against SHG signal.
Mechanism
Insight into the mechanism responsible for the fitness optimization in feedback control can be obtained by examining the correlation with SHG. It is often assumed that presence or absence of correlation is a measure of the complexity of the control problem. For example, optimization of the multiphoton ionization of a molecule might result from maximizing the peak pulse intensity; as SHG is maximized the same way, a strong correlation is seen between multiphoton ionization and SHG in an adaptive search to maximize either28,29. Figure 4b shows this analysis for the DiI/rhodamine B discrimination. No noticeable correlation is evident between the degree of discrimination of the pulse shapes and the SHG efficiency. This demonstrates that the discrimination mechanism does not map directly onto the simple problem of maximizing peak laser intensity.
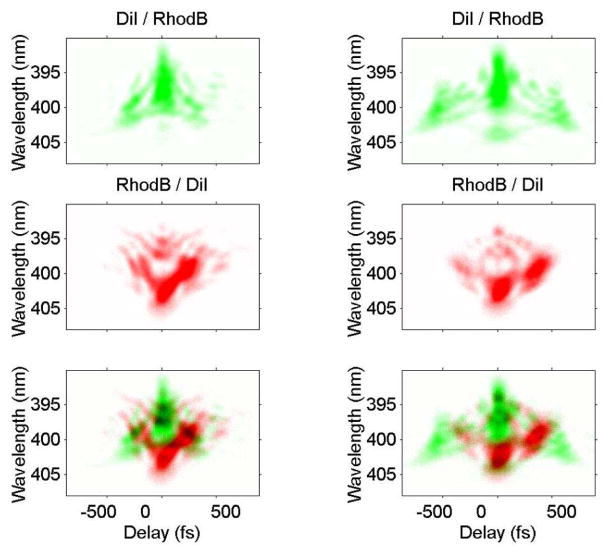
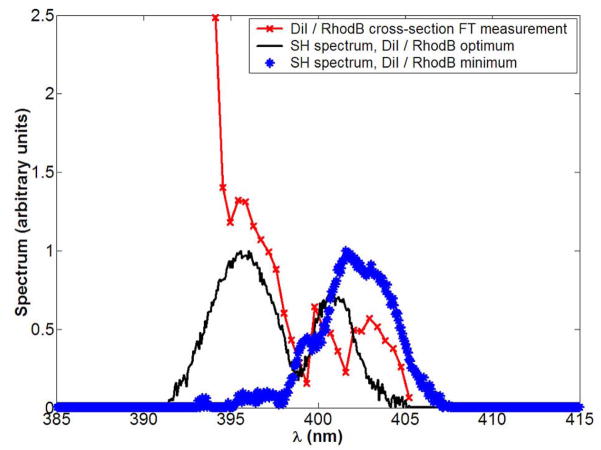
Despite the lack of correlation of the discrimination problem with SHG, second harmonic spectral tuning can account for the effect of optimal pulse shapes. The optimal and anti-optimal pulses to control the DiI to rhodamine B two-photon fluorescence ratio are shown in Figure 5. The complementary nature of pulses converged upon in parallel experiments is consistent with our previous investigations in laser pulse-shaping30. To obtain the second-harmonic spectrum S2(ω) of the shaped pulse, we examine the time-zero delay in these traces and we compare this to the spectrum of the two-photon excitation cross-section σ(2)(ω). Assuming no intermediate resonant levels between the ground and excited state, the two-photon fluorescent signal will be proportional to the overlap integral of σ(2)(ω) and S2(ω). This can be derived in second-order perturbation analysis of a two-level system29, and is in excellent agreement with experimental results24. Using the novel acousto-optic time domain measurement described in the Methods, we obtained the ratio of σ(2)(ω) for DiI/rhodamine B shown in Figure 6. Overlaying the second harmonic spectrum of the optimal pulses for maximization and minimization of the two-photon fluorescence ratio of the two dyes, we see that maximization tunes S2(ω) to regions where the DiI/rhodamine B cross-section ratio is maximal, whereas the minimization algorithm converges in the opposite direction. As the photon-photon interferences for second-harmonic tuning are best accessed with arbitrary, rather than mere 4th order polynomial phase control, it becomes clear why the GA result improves drastically at the algorithmic switch at generation 30 (Figure 5a).
Figure 5.
Experimental pulse shapes measured by SHG-FROG.23 (a,b) are the optimal pulses maximizing the DiI/rhodamine B fluorescence ratio from separate runs of the GA on different days; (c,d) are the pulses obtained by the GA minimizing the ratio. Overlaying the two traces (e,f) shows the complementary nature of the two pulse shapes. Abscissa is delay in fs and ordinate is the second-harmonic wavelength.
Figure 6.
Relation of two-photon cross-section σ(2)(ω) and second harmonic power-spectrum S2(ω). The red line with crosses shows the time-domain measured relative σ(2)(ω) • of DiI versus rhodamine B; S2(ω) for the optimal pulses maximizing (black line) and minimizing (blue asterixes) the two-photon fluorescence ratio are also shown.
The σ(2)(ω) interpretation also explains our finding that the discrimination result closely follows the two-photon fluorescent signal of DiI. Published excitation spectra show a sharp spectral feature in the two-photon excitation cross-section for DiI near 800 nm31, whereas σ(2)(ω) varies little for rhodamine B in this region. Thus, tuning S2(ω) will affect the DiI two-photon fluorescence far more significantly. Indeed, in additional experiments we have observed significantly improved ability to control the ratio of two-photon fluorescence of DiI to SHG when compared to the same experiment in rhodamine B, and we have confirmed this interpretation in a similar series of experiments to differentiate DiI from fluorescein isothiocyanate fluorescence32.
Quantitative measurement
Now consider the optimal discriminating pulses 1 and 2 found by the algorithm. Under pulse 1, let S1DiI be the signal from the pure solution of DiI, and let S1RhodB be the signal from the pure solution of rhodamine B. Similarly, under pulse 2 we have signals S2DiI and S2RhodB. Barring chemical reaction between the dyes, the total signal S1 under pulse 1 or S2 under pulse 2 from a mixture of these two solutions is simply the linear superposition of signals from the unmixed solution, weighted by the concentration in the mixture (measured relative to the pure solution):
| (1) |
This may be rewritten in matrix format:
| (2) |
From this we can extract the concentrations of the dyes by simple matrix inversion:
| (3) |
Thus it is possible to use tailored pulses to perform quantitative measurements by first measuring reference solutions. Note that this analysis can be extended to an arbitrary number of dyes and pulse shapes by using the pseudoinverse rather than the inverse of M. We performed precisely this experiment using the DiI and rhodamine B solutions as the reference. We then repeated eight measurements of a mixture of 75% of the DiI solution and 25% of the rhodamine B solution with each pulse from Figure 6. This indicated a fractional mixture of 0.64 of DiI and 0.27 of rhodamine B, with standard deviations of 0.54 and 0.08, respectively. The standard deviation of the recovered concentrations results from the error amplification of uncertainty in S by the condition number of M.
CONCLUSION
In summary, using feedback control pulse shaping, we have demonstrated the ability to control the relative two-photon fluorescence of rhodamine B and DiI by nearly a factor of three, and thereby distinguish this dye pair which is difficult to discern with traditional one-photon excitation and emission spectroscopy. The result does not map in a correlation analysis to the simple problem of SHG optimization; however the pulse optimization can be understood as the maximization of the overlap of the second harmonic spectrum and the relative two-photon excitation cross section of the dyes. Thus, photon-photon interferences are the predominant mechanism of control, and the evolution of wavepackets on the molecular potential energy surface does not appear to play a fundamental role in the selective two-photon fluorescence excitation of these two dyes.
We have also demonstrated that a search in the minimal parameter space of fourth-order polynomials over thirty generations results in significantly lower discrimination than achieved with the extended algorithm. It is theoretically impossible for polynomial phase less than third order to tune the second harmonic spectrum of the excitation pulse33, and thus in a properly balanced experiment, adjustments to at most two parameters contribute to improvements over this initial search. We have found in previous investigations of our graded search algorithm for SHG maximization that even a few generations are sufficient to discover optimal polynomial coefficients in such a low-dimensional search30. We conclude that a low-order polynomial search is unlikely to ever perform to the level of a spectrally-binned genetic algorithm. It is possible that a reduced search space employing sinusoidal phase functions would have performed better than a polynomial search, but genetic search algorithms such as prime-number-inspired binary phase shaping have been demonstrated to achieve superior second-harmonic spectral tuning relative to sinusoidal phase functions as well33.
The ability to quantify spectrally overlapping dyes in a mixture by pulse shaping is a simple application, but may be expected to provide a powerful tool to address broader problems in multiphoton fluorescence. For example, the need to select fluorescent biomarkers with widely separated spectra may be significantly relaxed, allowing for multiple signal-generating species in complex biological solutions. Endogenous fluorescence, inherent in biological specimens, causes background that could be suppressed to detect the signal from a fluorescent tag. In contrast, the potential for exploiting endogenous fluorescence to monitor biological processes such as cell viability may be enhanced through pulse-shaping-based signal enhancement. The implementation of pulse shaping with an acousto-optic filter as performed here further has the advantage of rapid switching capabilities between optimal pulse forms, which may enable applications in flow cytometry, including in vivo cytometry6.
Acknowledgments
This project was supported in full or in part by the cooperative award ESEI-2900-TR-07 from the Estonian Science Foundation and the United States Civilian Research and Development Foundation. During this investigation, ET was supported initially by the University of Michigan MD/PhD program and then by an NSF Graduate Research Fellowship. The authors would also like to express their gratitude to Daniel Kane and Rick Trebino for stimulating conversations about the FROG technique, as well as to Daniel Kaplan for the suggestion of physically constrained programming in the algorithm.
Footnotes
Publisher's Disclaimer: This is a PDF file of an unedited manuscript that has been accepted for publication. As a service to our customers we are providing this early version of the manuscript. The manuscript will undergo copyediting, typesetting, and review of the resulting proof before it is published in its final citable form. Please note that during the production process errors may be discovered which could affect the content, and all legal disclaimers that apply to the journal pertain.
References
- 1.Speicher MR, Gwyn Ballard S, Ward DC. Nat Genet. 1996;12:368–375. doi: 10.1038/ng0496-368. [DOI] [PubMed] [Google Scholar]
- 2.Gao X, Cui Y, Levenson R, Chung L, Nie S. Nat Biotech. 2004;22:969–976. doi: 10.1038/nbt994. [DOI] [PubMed] [Google Scholar]
- 3.Chattopadhyay P, Price D, Harper T, Betts M, Yu J, Gostick E, Perfetto S, Goepfert P, Koup R, De Rosa S, Bruchez M, Roederer M. Nature Medicine. 2006;12:972–977. doi: 10.1038/nm1371. [DOI] [PubMed] [Google Scholar]
- 4.Hu CD, Kerppola TK. Nat Biotechnol. 2003;21:539–545. doi: 10.1038/nbt816. [DOI] [PMC free article] [PubMed] [Google Scholar]
- 5.Voura EB, Jaiswal JK, Mattoussi H, Simon SM. Nat Med. 2004;10:993–998. doi: 10.1038/nm1096. [DOI] [PubMed] [Google Scholar]
- 6.Tkaczyk ER, Zhong CF, Ye JY, Myc A, Thomas T, Cao Z, Duran-Struuck R, Luker KE, Luker GD, Norris TB, Baker JR., Jr Optics Communications. 2008;281:888–894. doi: 10.1016/j.optcom.2007.10.106. [DOI] [PMC free article] [PubMed] [Google Scholar]
- 7.Tkaczyk E, Laiho L, So PT. Medical Devices and Biosensors. ISSS-MDBS 2007. 4th IEEE/EMBS International Summer School and Symposium on 2007; pp. 36–43. [Google Scholar]
- 8.Malinowski ER. Technometrics. 2003;45:180. [Google Scholar]
- 9.Zhang J, Campbell RE, Ting AY, Tsien RY. Nat Rev Mol Cell Biol. 2002;3:906–918. doi: 10.1038/nrm976. [DOI] [PubMed] [Google Scholar]
- 10.Jaiswal J, Simon S. Trends in Cell Biology. 2004;14:497–504. doi: 10.1016/j.tcb.2004.07.012. [DOI] [PubMed] [Google Scholar]
- 11.Dudovich N, Oron D, Silberberg Y. Nature. 2002;418:512–514. doi: 10.1038/nature00933. [DOI] [PubMed] [Google Scholar]
- 12.Brixner T, Damrauer NH, Niklaus P, Gerber G. Nature. 2001;414:57–60. doi: 10.1038/35102037. [DOI] [PubMed] [Google Scholar]
- 13.Lozovoy V, Pastirk I, Walowicz K, Dantus M. The Journal of Chemical Physics. 2003;118:3187–3196. [Google Scholar]
- 14.Ogilvie JPDD, Solinas X, Martin JL, Beaurepaire E, Joffre M. Optics Express. 2006;14:759–766. doi: 10.1364/opex.14.000759. [DOI] [PubMed] [Google Scholar]
- 15.Li B, Turinici G, Ramakrishna V, Rabitz H. J Phys Chem B. 2002;106:8125–8131. [Google Scholar]
- 16.Courvoisier Fc, Boutou Ve, Wood V, Bartelt A, Roth M, Rabitz H, Wolf J. Applied Physics Letters. 2005:87. [Google Scholar]
- 17.Trebino R, Delong K, Fittinghoff D, Sweetser J, Krumbugel M, Richman B, Kane D. Review of Scientific Instruments. 1997;68:3277–3295. [Google Scholar]
- 18.Judson R, Rabitz H. Physical Review Letters. 1992;68:1500. doi: 10.1103/PhysRevLett.68.1500. [DOI] [PubMed] [Google Scholar]
- 19.Verluise F, Laude V, Huignard JP, Tournois P, Migus A. Journal of the Optical Society of America B Optical Physics. 2000;17:138–145. [Google Scholar]
- 20.Kaplan D, Tournois P. Journal de Physique IV. 2002;12:69–75. [Google Scholar]
- 21.Pearson BJ, White JL, Weinacht TC, Bucksbaum PH. Physical Review A. 2001;63:063412. [Google Scholar]
- 22.Spectra obtained from Invitrogen Corporation
- 23.Trebino R. Frequency-Resolved Optical Gating: The Measurement of Ultrashort Laser Pulses. 2002 [Google Scholar]
- 24.Ogilvie J, Kubarych K, Alexandrou A, Joffre M. Opt Lett. 2005;30:911–913. doi: 10.1364/ol.30.000911. [DOI] [PubMed] [Google Scholar]
- 25.Bellini M, Bartoli A, Hänsch TW. Opt Lett. 1997;22:540–542. doi: 10.1364/ol.22.000540. [DOI] [PubMed] [Google Scholar]
- 26.Naganuma K, Mogi K, Yamada H. Quantum Electronics, IEEE Journal of. 1989;25:1225–1233. [Google Scholar]
- 27.Laarmann T, Shchatsinin I, Singh P, Zhavoronkov N, Gerhards M, Schulz CP, Hertel IV. The Journal of Chemical Physics. 2007:127. doi: 10.1063/1.2806029. [DOI] [PubMed] [Google Scholar]
- 28.Brixner T, Kiefer B, Gerber G. Chemical Physics. 2001;267:241–246. [Google Scholar]
- 29.Brixner T, Damrauer NH, Kiefer B, Gerber G. The Journal of Chemical Physics. 2003;118:3692–3701. [Google Scholar]
- 30.Tkaczyk ER, Mignot A, Ye JY, Majoros I, Baker JR, Norris TB. Multiphoton Microscopy in the Biomedical Sciences VI. In: Periasamy Ammasi, So Peter TC., editors. Proceedings of the SPIE. Vol. 6089. 2006. pp. 165–174. [Google Scholar]
- 31.Xu C, Webb WW. Journal of the Optical Society of America B Optical Physics. 1996;13:481–491. [Google Scholar]
- 32.Tkaczyk ER, Tkaczyk AH, Mauring K, Ye JY, Baker JR, Norris TB. J Fluorescence. 2009;19:517–532. doi: 10.1007/s10895-008-0441-z. [DOI] [PubMed] [Google Scholar]
- 33.Lozovoy VV, Dantus M. Chem Phys Chem. 2005;6:1970–2000. doi: 10.1002/cphc.200400342. [DOI] [PubMed] [Google Scholar]


