

Abstract
Tools for monitoring response to tuberculosis (TB) treatment are time-consuming and resource intensive. Noninvasive biomarkers have the potential to accelerate TB drug development, but to date, little progress has been made in utilizing imaging technologies. Therefore, in this study, we used noninvasive imaging to monitor response to TB treatment. BALB/c and C3HeB/FeJ mice were aerosol infected with Mycobacterium tuberculosis and administered bactericidal (standard and highly active) or bacteriostatic TB drug regimens. Serial pulmonary [18F]-2-fluoro-deoxy-d-glucose (FDG) positron emission tomography (PET) was compared with standard microbiologic methods to monitor the response to treatment. [18F]FDG-PET correctly identified the bactericidal activity of the drug regimens. Imaging required fewer animals; was available in real time, as opposed to having CFU counts 4 weeks later; and could also detect TB relapse in a time frame similar to that of the standard method. Lesion-specific [18F]FDG-PET activity also broadly correlated with TB treatment in C3HeB/FeJ mice that develop caseating lesions. These studies demonstrate the application of noninvasive imaging to monitor TB treatment response. By reducing animal numbers, these biomarkers will allow cost-effective studies of more expensive animal models of TB. Validated markers may also be useful as “point-of-care” methods to monitor TB treatment in humans.
New and shorter drug regimens for tuberculosis (TB) are needed to support global control efforts. However, tools for monitoring TB drug treatment in preclinical studies and clinical trials are time-consuming and resource intensive. For instance, typical phase 3/4 trials entail treating hundreds of patients for at least 6 months and monitoring them for at least 1 year for relapse. Phase 2 studies that monitor patients for 8 weeks for sputum culture conversion are limited because sputum bacterial burdens are not available in real time and do not always correlate closely with overall pulmonary disease. This situation is unlike clinical trials evaluating treatments against human immunodeficiency virus infection, where quantitative viral loads and CD4 counts provide well-validated biomarkers of disease burden and progression of disease, respectively. With the alarming rise of multidrug-resistant and extensively drug-resistant Mycobacterium tuberculosis infections, which account for up to 20% and 2%, respectively, of the global TB disease burden (6), there is significant interest in the use of validated biomarkers to monitor TB treatment in patients. Since clinical indicators can often be misleading, these biomarkers may allow more rapid identification of patients who relapse or respond poorly to TB treatment. The TB Trials Consortium (TBTC) has expressed an urgent need for development of validated biomarkers for monitoring and detecting relapse during and after TB treatment in patients (29). Several biomarker technologies for monitoring TB treatment are under development, though none utilize imaging technologies (24). A recent example of one such biomarker technology is a real-time PCR assay that uses hydrolysis probes to target DNA of the IS6110 insertion element and mRNA for antigen 85B. This study has shown that mRNA real-time PCR assay done on human sputa correlates well with standard mycobacterial cultures in patients on TB treatment (18). Other approaches measure markers of inflammation, such as erythrocyte sedimentation rate, C-reactive protein, β2-microglobin, or procalcitonin, to follow TB and other bacterial diseases in humans. T-cell-based gamma interferon-release assays have also been used to monitor TB treatment. However, findings can vary among different populations, and it is also not clear how long T-cell responses remain elevated in patients who are treated for latent disease (16). Nonetheless, these assays may provide useful biomarkers for evaluating TB treatment in resource-limited settings.
Preclinical animal studies for the development of new TB regimens are also costly and time-consuming. The current standard methods for monitoring disease in animals require significant resources for sacrificing animals at several different time points, harvesting and processing their organs, and finally obtaining CFU counts from the organ homogenates. Due to the slow growth of M. tuberculosis, results are not available for up to 4 weeks after the completion of the study. Moreover, since the entire organ is generally homogenized and different animals are sacrificed at each time point, lesion-specific responses to TB treatment in the same animal can never be assessed. Furthermore, due to the lack of caseation in response to TB—the hallmark of human disease—in the standard mouse model, it may be essential to perform cross-species studies of larger animal models, such as guinea pigs, rabbits, or nonhuman primates, which develop microenvironments that may be more relevant to human TB (12). However, animal-to-animal variability is a more serious concern with these more expensive species, which are generally not available as inbred strains. The need for noninvasive biomarkers to monitor disease and response to treatment in the same group of animals will be essential to conducting cost-effective studies of these larger and more expensive species.
Positron emission tomography (PET) imaging is extensively used for noninvasive and real-time assessment of human disease. It relies on the detection of positrons emitted from radiolabeled tracers that accumulate at the site of the disease (or the biological process being measured). PET imaging is generally combined with computed tomography (CT) imaging, which provides anatomic information about the lesion or organ being evaluated. Both of these imaging methods (CT and PET) provide a comprehensive three-dimensional assessment of the whole organ and therefore generally correlate closely with overall disease. Several different PET tracers are currently in use, and one such tracer, [18F]-2-fluoro-deoxy-d-glucose ([18F]FDG), is used extensively for the diagnosis and staging of malignant disease. It is important to note that FDG is not a cancer-specific agent. FDG is transported into cells by glucose transporters and phosphorylated by hexokinase enzyme to [18F]-2′-FDG-6 phosphate but is not metabolized. Consequently, the degree of cellular FDG uptake is related to the cellular metabolic rate and the number of glucose transporters (4, 23, 32). Increased FDG uptake in inflammatory and tumor cells is at least in part due to an increased number of glucose transporters (17, 19). In addition, under inflammatory conditions, the affinity of glucose transporters for deoxyglucose is increased by various cytokines and growth factors, a phenomenon not observed in tumors (20, 32). Moreover, FDG is known to accumulate in inflammatory cells such as neutrophils and activated macrophages at the site of inflammation (1, 17). These properties make FDG a good radiotracer for monitoring granulomatous inflammatory lesions. It is therefore not surprising that CT (31) and [18F]FDG-PET have been shown to be useful in imaging TB lesions in humans (11, 13, 22). In this study, we have utilized noninvasive imaging with [18F]FDG-PET and high-resolution CT to serially monitor TB disease and response to treatment in real time in live animals infected with M. tuberculosis. Imaging-based outcomes were compared to standard outcome measures of lung CFU counts and culture-positive relapse after treatment completion.
(This study was presented in part as a poster presentation at the Keystone Symposia on Tuberculosis: Biology, Pathology and Treatment [B3], Keystone, CO, January 2009 [9]; as an oral presentation at the 2008 World Molecular Imaging Congress, Nice, France, September 2008 [10]; and as an oral presentation at the 48th Interscience Conference on Antimicrobial Agents and Chemotherapy [ICAAC]/46th Infectious Diseases Society of America [IDSA] Annual Meeting, Washington, DC, October 2008 [7].)
MATERIALS AND METHODS
Aerosol infection.
Five- to six-week-old female BALB/c (Charles River) or C3HeB/FeJ (Jackson Laboratory) mice were aerosol infected with M. tuberculosis H37Rv, using the Middlebrook inhalation exposure system (Glas-Col) with a log-phase broth culture. Three mice were sacrificed 1 day and 2 weeks (BALB/c) or 6 weeks (C3HeB/FeJ) after infection to determine the number of bacilli implanted in the lungs and the bacillary burden at the start of treatment, respectively.
Drug treatment.
Treatment began 2 weeks (BALB/c) or 6 weeks (C3HeB/FeJ) after infection. Three different TB regimens were administered: the first-line TB regimen (RHZ) consisting of rifampin (rifampicin) (R) (10 mg/kg/day), isoniazid (H) (25 mg/kg/day) and pyrazinamide (Z) (150 mg/kg/day); a more bactericidal TB regimen (PMZ) (27) consisting of rifapentine (P) (10 mg/kg/day), moxifloxacin (M) (100 mg/kg/day), and Z (150 mg/kg/day); and a bacteriostatic regimen consisting of monotherapy with ethambutol (E) (100 mg/kg/day). As described previously, drugs were administered by gavage 5 days per week (28). Each regimen was administered for 12 weeks. Z was administered only during the first 8 weeks for the RHZ and PMZ regimens. Three mice were left untreated and served as controls.
Biocontainment and anesthesia.
All live M. tuberculosis-infected animals were imaged within a sealed biocontainment device developed by our laboratory. An unbreakable and transparent 250-ml polycarbonate centrifuge bottle (Nalgene) with a gasket screw cap was used. Two quarter-inch-diameter holes were drilled into the cap and fit with quarter-inch barbed bulkhead fittings (Nalgene) for passage of gases. Two 0.22-μm, 60-mm disc Vacu-Guard (Whatman) filters were used in series at both the inlet and the outlet to contain the bacteria within the device (see the supplemental material). A standard small-animal anesthesia machine was used to deliver a mixture of isoflurane (Henry Schein) and oxygen during transport and imaging. Animals were anesthetized and sealed inside the biocontainment device in the biosafety level 3 facility. The external surface of the biocontainment device was decontaminated and transported to the imaging suite. During prolonged anesthesia (>20 min), an infrared thermometer and a heat lamp were used to measure and maintain ambient air temperature inside the biocontainment device.
[18F]FDG-PET/CT imaging.
The night before each imaging time point, mice were fasted for 12 h. Water was provided ad libitum. On the day of imaging, each mouse was weighed, injected with 250 μCi of [18F]FDG via the tail vein and imaged 45 min postinjection, using the eXplore Vista (General Electric) or Mosaic HP (Philips) small-animal PET imagers with 15-min static acquisition. A CT scan was also performed at the same time using the X-Spect (Gamma Medica) or NanoSPECT/CT (Bioscan) in vivo animal imagers. PET images were reconstructed and coregistered with CT images.
Monitoring response to TB treatment in BALB/c mice.
Three mice per regimen were sacrificed to determine CFU at 2, 4, 8, and 12 weeks after initiation of TB treatment. The entire lungs were homogenized in phosphate-buffered saline and plated onto Middlebrook 7H11 selective plates (Becton Dickinson). All plates were incubated at 37°C for 4 weeks before the colonies were counted. A separate group of identically treated mice were used for imaging studies. For each TB regimen, the same sets of live mice (3 per group) were serially imaged at 2, 4, 8, and 12 weeks after initiation of TB treatment (corresponding to the microbiologic evaluation by CFU). Three uninfected animals were used as controls and imaged at the same time points. Three infected but untreated mice were also used as controls and imaged at 2 weeks after initiation of TB treatment. However, these mice were sacrificed after the imaging time point at 2 weeks (i.e., 4 weeks after infection), as they became moribund due to the infection. Since BALB/c mice develop diffuse lung disease after aerosol infection, for each animal and time point, five spherical (2.5-mm-diameter) regions of interest (ROIs) were randomly traced in the lung images, making sure not to overlap the surrounding PET-active bone marrow or heart, creating 15 ROIs per group for each time point. To estimate the baseline PET background activity, similar ROIs were also traced in the abdomen of each animal, away from the PET-active bones or kidneys. The standard uptake values (SUV) were computed by normalizing the ROI activity for each mouse to the injected dose and animal weight, using Amide version 0.9.1 (http://amide.sourceforge.net). To additionally correct for the specific activity of [18F]FDG at the time of image acquisition, the lung SUVs were also normalized by dividing them by the background SUV (ROI drawn in the abdomen) for each animal. For each treatment group, the mean lung [18F]FDG-PET activity at each time point was calculated by averaging the normalized lung SUV of all the ROIs in that group. Mean lung [18F]FDG-PET activity at each time point was also calculated similarly for the three uninfected animals used as controls and imaged at the same time points. Mean [18F]FDG-PET activities for all treatment groups are shown as a ratio of the mean lung activity in the uninfected controls such that the mean lung activity of the uninfected controls is 1.
Relapse.
Three mice from each of the groups that received 12 weeks of RHZ or PMZ were followed using serial imaging at 18, 24, 28, and 34 weeks (i.e., 6, 12, 16, and 22 weeks after completion of TB treatment) to evaluate relapse. Three uninfected animals were used as controls and imaged at the same time points. Image analysis was done as described above. After completion of the imaging at the last time point, mice were sacrificed to determine culture-positive relapse.
Monitoring lesion-specific [18F]FDG-PET activity.
C3HeB/FeJ mice display lung pathology with well-defined granulomas and central caseous necrosis in response to M. tuberculosis infection. This is due to the lack of expression of Ipr1 within the super-susceptibility to tuberculosis 1 (sst1) locus in the C3HeB/FeJ strain (21). Five- to six-week-old female C3HeB/FeJ mice received a low-dose aerosol infection (target dose of ∼2 log10 CFU implanted in lungs). We serially imaged the same group of live animals by using [18F]FDG-PET/CT at 4, 6, and 8 weeks after infection. Uninfected mice were used as controls. Three mice were used for each group. For each animal and time point, one ROI was drawn manually around the TB granuloma, making sure not to overlap the surrounding PET-active bone marrow or heart. Image analysis was performed as described for the BALB/c mice above. A separate group of identically infected mice were sacrificed to determine the number of CFU in the lung and to perform gross pathological examination and lung histopathology at 1 day (implantation) and 6 and 8 weeks after infection.
Monitoring response to TB treatment in C3HeB/FeJ mice.
Since BALB/c mice develop diffuse lung disease with poorly defined lesions, distinct from what is seen in human TB, we wanted to test whether noninvasive imaging would be able to serially monitor disease in a model (C3HeB/FeJ strain) that developed well-defined granulomas. Three mice per regimen were sacrificed to determine lung CFU counts at 2, 4, and 8 weeks of treatment as described above for the BALB/c mice. Individual mice in the imaging cohort were serially imaged at 2, 4, and 8 weeks after initiation of TB treatment (corresponding to the microbiologic evaluation by CFU counts). For each animal, five ROIs were traced over five TB granulomas selected randomly from the CT images, making sure not to overlap the surrounding PET-active bone marrow or heart, creating 15 ROIs per group for each time point. Since lung disease in the C3HeB/FeJ model is not diffuse but localized to well-defined granulomas, in order to precisely follow the evolution of each TB granuloma across several time points, an ROI corresponding to the same granuloma had to be traced exactly in the same position in each image set acquired for the same animal. This requires correction for any differences in animal orientation and shape of the lung at the different time points measured in the study. To minimize the time required to trace these ROIs manually and also to minimize any observer bias, we used an automated image registration method to align each CT and its corresponding PET to a common reference (30). After registration, a one-to-one correspondence was achieved among all CT and PET images from the same animal that were acquired at different time points in the study, making it possible to trace an ROI in one CT image and immediately extract the PET activity at corresponding locations across all time points. SUV corrections for injected dose, animal weight, and background activity were applied as described previously for the BALB/c mice.
All protocols were approved by the Johns Hopkins Biosafety, Radiation Safety, and Animal Care and Use Committees.
Statistical analysis.
Statistical comparison between groups was performed using the one-tail-distribution, two-sample, unequal-variance t test in Excel 2007 (Microsoft). Data are presented on a linear scale as mean ± standard error for the mean PET activities and on a logarithmic scale as mean ± standard deviation for CFU counts.
RESULTS
[18F]FDG-PET activity correlates with activity of TB treatment in BALB/c mice.
Treatment was started 2 weeks after aerosol infection implanting 3.54 ± 0.03 log10 CFU of M. tuberculosis H37Rv in the lungs. The bacterial burden in the lungs at the initiation of treatment was 6.34 ± 0.02 log10 CFU. Figure 1 shows the mean [18F]FDG-PET activity in the lungs of mice as a function of time (panel A) and the mean lung CFU for the corresponding time points (panel B). As shown previously, PMZ was more bactericidal than was RHZ (27), while E alone was essentially bacteriostatic. [18F]FDG-PET could distinguish between regimens of differing activity as early as 2 weeks after initiation of treatment. PET activities for the mice treated with the bactericidal regimens (PMZ and RHZ) were significantly lower than that for mice treated with the bacteriostatic regimen (E alone) at all time points measured during TB treatment (P < 0.033). Mean lung PET activity for the mice treated with the more bactericidal regimen, PMZ, was also significantly lower than that for RHZ starting at 8 weeks after initiation of TB treatment (P < 0.026).
FIG. 1.

[18F]FDG-PET activity correlates with the activity of TB treatment in BALB/c mice. Two weeks after aerosol infection, BALB/c mice were allocated to treatment groups to receive one of three TB drug regimens: the bactericidal first-line TB regimen (RHZ), a more bactericidal regimen (PMZ), and a bacteriostatic regimen of E alone. Three mice in each treatment group were allocated to the imaging cohort, and the same mice were serially imaged using [18F]FDG-PET/CT during treatment. (A) Mean lung [18F]FDG-PET activity normalized to the uninfected controls is shown. [18F]FDG-PET could distinguish between regimens of differing activity as early as 2 weeks after initiation of treatment. PET activities for the mice treated with the bactericidal regimens (PMZ and RHZ) were significantly lower than that for mice treated with the bacteriostatic regimen (E alone) at all time points measured during TB treatment (P < 0.033). Mean lung PET activity for the mice treated with the more bactericidal regimen, PMZ, was also significantly lower than that for RHZ starting at 8 weeks after initiation of TB treatment (P < 0.026). (B) Three additional mice were sacrificed at each time point to determine the lung CFU counts, which are shown for each corresponding time point. (C) Serial imaging also detected the development of relapse.
Detection of relapse.
One of three mice from the PMZ group and all three mice from the RHZ group relapsed, as measured by lung CFU counts, 22 weeks after cessation of treatment. Serial imaging could detect the development of relapse (Fig. 1C). Mean lung PET activity in mice treated with RHZ exceeded the baseline values in uninfected control mice as early as 16 weeks after cessation of treatment (P = 0.002). Though a trend with increasing lung PET activity was observed for the mice treated with PMZ, these data were not statistically different from the baseline values in uninfected control mice until 22 weeks after cessation of treatment (P = 0.015).
[18F]FDG activity localizes to TB granulomas in C3HeB/FeJ mice.
We utilized the C3HeB/FeJ mouse strain that develops well-defined caseous lung granulomas in response to M. tuberculosis infection (21). Lung CFU counts 1 day after low-dose aerosol infection and 6 weeks after infection were 1.88 ± 0.05 and 7.95 ± 0.40 log10 CFU, respectively. As shown in Fig. 2, 8 weeks after infection, several caseous lesions were observed on gross pathological examination (panel A), while lung histopathology demonstrated well-defined granulomas with central necrosis and abundant acid-fast bacilli (panel B). [18F]FDG activity localized to the lesions (Fig. 3), and mean lung [18F]FDG-PET activity in infected animals was significantly higher than that in uninfected controls at all time points measured (P < 0.031).
FIG. 2.

Mycobacterium tuberculosis-infected C3HeB/FeJ mice develop well-defined caseous granulomas. Unlike the BALB/c mouse model, C3HeB/FeJ mice display lung pathology with well-defined granulomas and central caseous necrosis after low-dose aerosol infection. (A) Formalin-fixed lungs 8 weeks after infection show caseous lesions. Yellow arrows point to the three large granulomas also visualized by [18F]FDG-PET imaging in the same animal at 6 weeks after infection (Fig. 3). (B) Lung histopathology from the same mice 8 weeks after infection, demonstrating well-defined granulomas with central necrosis and abundant acid-fast bacilli (AFB) (inset), is also shown.
FIG. 3.

[18F]FDG localizes to granulomas in C3HeB/FeJ mice. (A) Transverse, coronal, and sagittal sections (CT, PET, and fused PET+CT) from a Mycobacterium tuberculosis H37Rv-infected C3HeB/FeJ mouse 6 weeks after a low-dose aerosol infection. [18F]FDG-PET activity localized to TB granulomas (arrows). Mean lung [18F]FDG-PET activity in infected animals was significantly higher than that in the uninfected controls at 4, 6, and 8 weeks after infection (P < 0.031). (B) Three-dimensional tomography of the fused PET+CT (top) and isosurface representation of coregistered PET and CT images (bottom). The TB lesions are shown in pink (PET), while the bony rib cage is shown in yellow (CT). As expected, the heart (H) takes up FDG and is visible in all sections.
[18F]FDG-PET activity correlates with activity of TB treatment in C3HeB/FeJ mice.
Six weeks after aerosol infection with 1.88 ± 0.03 log10 CFU, the bacterial burden was 7.76 ± 0.07 log10 CFU in the lungs. Figure 4 shows the mean [18F]FDG-PET lesion-specific activity as a function of time (panel A) and the mean lung CFU for the corresponding time points (panel B). Mean lung [18F]FDG-PET activity was again useful in distinguishing the differential activities of the TB regimens. PET activities for the mice treated with both bactericidal regimens (PMZ and RHZ) were significantly lower than that for the mice treated with the bacteriostatic regimen (E alone) starting at 4 weeks after initiation of TB treatment (P < 0.001). Mean lung PET activity for the mice treated with the more bactericidal regimen, PMZ, was also significantly lower than that for RHZ at 8 weeks after initiation of TB treatment (P = 0.045).
FIG. 4.
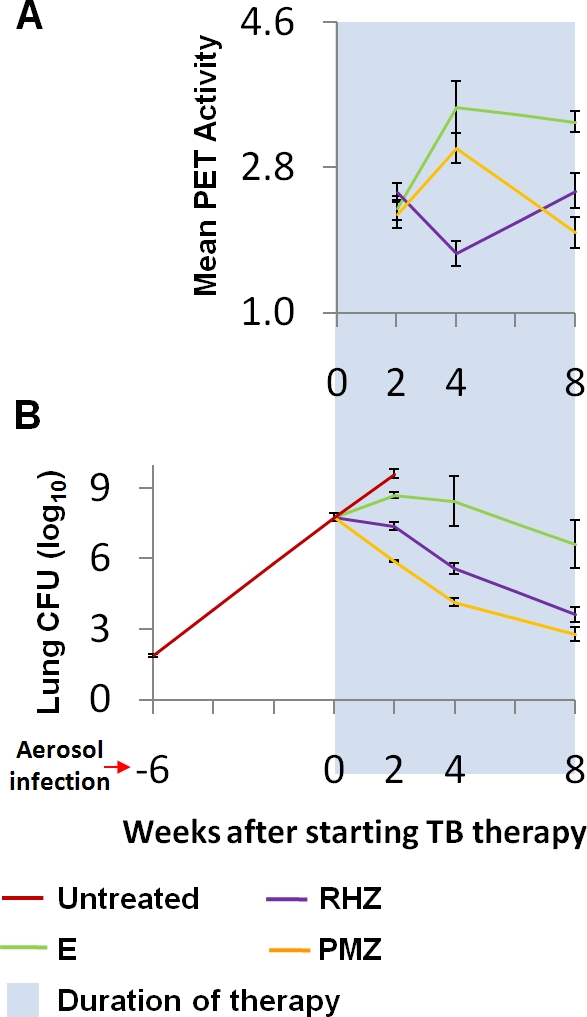
[18F]FDG-PET activity correlates with activity of TB treatment in C3HeB/FeJ mice. Six weeks after low-dose aerosol infection, C3HeB/FeJ mice were allocated to treatment groups to receive one of three TB drug regimens: the bactericidal first-line TB regimen (RHZ), a more bactericidal regimen (PMZ), and a bacteriostatic regimen of E alone. The same live animals were serially imaged using [18F]FDG-PET/CT after initiation of TB treatment. (A) Mean lung [18F]FDG-PET activity was useful in distinguishing the differential activities of the TB regimens. PET activities for the mice treated with both the bactericidal regimens (PMZ and RHZ) were significantly lower than that for those treated with the bacteriostatic regimen (E alone) starting at 4 weeks after initiation of TB treatment (P < 0.001). Mean lung PET activity for the mice treated with the more bactericidal regimen, PMZ, was also significantly lower than that for those treated with RHZ at 8 weeks after initiation of TB treatment (P = 0.045). (B) Three additional mice were sacrificed at each time point to determine the lung CFU counts, which are shown for each corresponding time point. Note that the differences between the bactericidal activities of RHZ and PMZ were more modest in this model.
DISCUSSION
Our overall goal was to evaluate whether noninvasive imaging technologies could be used for serial monitoring of TB disease and response to treatment in real time in live animals infected with M. tuberculosis. Since the same animals would be assessed at the different time points, imaging would utilize significantly fewer animals. In fact, in the current study evaluating four time points during TB treatment (Fig. 1), serial imaging required only one-third of the number of animals required by the standard microbiologic method. The reduction in animals required for studies with additional time points would be even more significant. Noninvasive assessment is especially useful for relapse studies in which the time interval between development of relapse and cessation of TB treatment is often unknown and large numbers of animals must be sacrificed at multiple time points in order to detect differences. We have shown that serial imaging allows assessment at multiple time points and can detect the development of relapse in a time frame similar to that of the standard method. This provides a method to significantly reduce the number of animals required for a relapse study. In this study, imaging correctly identified relapse in the group treated with RHZ, as early as 16 weeks after cessation of treatment. Though a trend with increasing lung PET activity was observed for the mice treated with PMZ, these data were not statistically different from the baseline values in uninfected control mice until 22 weeks after cessation of treatment. This is consistent with only one of the three mice relapsing in the later group. A larger group size for each treatment arm may have allowed more statistical power to better differentiate between the two regimens. Another advantage of imaging was that results were available in real time (on the same day), whereas there was a 4-week delay due to the slow growth of M. tuberculosis with the standard microbiologic method. This may enable more-rapid development of appropriate study protocols for studies dependent on the results of the prior study.
In this study, [18F]FDG-PET could differentiate the bactericidal (RHZ and PMZ) and bacteriostatic (E alone) regimens in a time frame similar to that of the standard method (2 weeks). Although a trend was observed even at 2 weeks after initiation of TB treatment, differences between the two bactericidal regimens, PMZ and RHZ, were significantly different starting only at 8 weeks after initiation of TB treatments. This may represent the limited statistical power of this study, due to the low number of animals used for each group. It could also represent an inherent limitation of [18F]FDG-PET imaging. More-specific PET tracers, such as those measuring lymphoid-associated inflammation (25) or radiopharmaceutical or bioluminescence-based imaging biomarkers that directly label bacteria (5, 8, 14), are anticipated to provide better real-time information about bacterial burdens. However, unlike PET tracers, methods of directly labeling bacteria are currently limited to in vitro systems or experimentally infected animals. Mean [18F]FDG-PET activity for the more bactericidal PMZ regimen was paradoxically higher than that for the RHZ group at 4 weeks after initiation of TB treatment in both the mouse models studied. This may be mediated by the systemic inflammatory cytokine tumor necrosis factor, known to increase shortly after initiation of TB treatment (3) and cause significant tissue damage (26). More-rapid bacterial killing in the PMZ group and release of microbial constituents that stimulate tumor necrosis factor (2) may have led to this paradoxical increase. Additional studies will need to be performed to explain this observation more conclusively.
We also wanted to study whether [18F]FDG-PET activity in caseous TB granulomas would correlate with response to TB treatment. To simulate these lesions, we utilized the C3HeB/FeJ mouse strain that develops caseous necrosis in response to M. tuberculosis infection (21). We demonstrated that [18F]FDG-PET activity localized to these lesions. Mean lung [18F]FDG-PET activity was again useful in distinguishing the differential activities of the TB regimens, though differences between the bactericidal regimens, PMZ and RHZ, were less clear. This is possibly due to the more modest differences between the bactericidal activities of PMZ and RHZ in this model, even as assessed by CFU counts. Interestingly, although on average lesion-specific activity decreased with bactericidal treatment, different TB lesions (granulomas) in the same animal responded differently, with some lesions becoming worse before getting better. These findings are consistent with clinical data (15).
In summary, these studies demonstrate the application of imaging technologies as an efficient and cost-effective means of monitoring treatment response in more expensive animal models, which develop microenvironments more relevant to human TB. Such imaging biomarkers may therefore accelerate TB drug development. Real-time observational capabilities of novel imaging biomarkers may also significantly augment the study of mycobacterial pathogenesis. Moreover, since radiopharmaceutical imaging is extensively used in humans, validated imaging biomarkers could also be used for “point-of-care” monitoring in TB patients in the future.
Supplementary Material
Acknowledgments
This work was supported by the Bill & Melinda Gates Foundation TB Drug Accelerator grant 48793 (S.K.J.). Support from NIH grants and contract AI079590 (W.R.B.), N01 AI30036 (W.R.B.), CA92871 (M.G.P.), Johns Hopkins Fund for Medical Discovery (S.K.J.), and Potts Memorial Foundation (B.J.) is also acknowledged.
We acknowledge James Fox and Gilbert Green for their assistance in image acquisition.
The funders had no role in study design, data collection and analysis, decision to publish, or preparation of the manuscript.
Footnotes
Published ahead of print on 8 September 2009.
Supplemental material for this article may be found at http://aac.asm.org/.
REFERENCES
- 1.Alavi, A., N. Gupta, J. L. Alberini, M. Hickeson, L. E. Adam, P. Bhargava, and H. Zhuang. 2002. Positron emission tomography imaging in nonmalignant thoracic disorders. Semin. Nucl. Med. 32:293-321. [DOI] [PubMed] [Google Scholar]
- 2.Aung, H., Z. Toossi, J. J. Wisnieski, R. S. Wallis, L. A. Culp, N. B. Phillips, M. Phillips, L. E. Averill, T. M. Daniel, and J. J. Ellner. 1996. Induction of monocyte expression of tumor necrosis factor alpha by the 30-kD alpha antigen of Mycobacterium tuberculosis and synergism with fibronectin. J. Clin. Investig. 98:1261-1268. [DOI] [PMC free article] [PubMed] [Google Scholar]
- 3.Bekker, L. G., G. Maartens, L. Steyn, and G. Kaplan. 1998. Selective increase in plasma tumor necrosis factor-alpha and concomitant clinical deterioration after initiating therapy in patients with severe tuberculosis. J. Infect. Dis. 178:580-584. [DOI] [PubMed] [Google Scholar]
- 4.Bell, G. I., C. F. Burant, J. Takeda, and G. W. Gould. 1993. Structure and function of mammalian facilitative sugar transporters. J. Biol. Chem. 268:19161-19164. [PubMed] [Google Scholar]
- 5.Bettegowda, C., C. A. Foss, I. Cheong, Y. Wang, L. Diaz, N. Agrawal, J. Fox, J. Dick, L. H. Dang, S. Zhou, K. W. Kinzler, B. Vogelstein, and M. G. Pomper. 2005. Imaging bacterial infections with radiolabeled 1-(2′-deoxy-2′-fluoro-beta-d-arabinofuranosyl)-5-iodouracil. Proc. Natl. Acad. Sci. USA 102:1145-1150. [DOI] [PMC free article] [PubMed] [Google Scholar]
- 6.CDC. 2006. Emergence of Mycobacterium tuberculosis with extensive resistance to second-line drugs—worldwide, 2000-2004. MMWR Morb. Mortal. Wkly. Rep. 55:301-305. [PubMed] [Google Scholar]
- 7.Davis, S., P. Um, G. Lamichhane, S. Nimmagadda, M. G. Pomper, W. R. Bishai, and S. K. Jain. 2008. Monitoring disease in animal models of TB: the 21st century: non-invasive, real-time, in live animals, abstr. B-874. Abstr. 48th Intersci. Conf. Antimicrob. Agents Chemother./46th Infect. Dis. Soc. Am. Annu. Meet., Washington, DC, October 2008.
- 8.Davis, S. L., N. B. Be, G. Lamichhane, S. Nimmagadda, M. G. Pomper, W. R. Bishai, and S. K. Jain. 2009. Bacterial thymidine kinase as a non-invasive imaging reporter for Mycobacterium tuberculosis in live animals. PLoS ONE 4:e6297. [DOI] [PMC free article] [PubMed] [Google Scholar]
- 9.Davis, S. L., P. Um, G. Lamichane, S. Nimmagadda, M. G. Pomper, W. R. Bishai, and S. K. Jain. 2009. Keystone Symposia on Tuberculosis: Biology, Pathology, and Therapy (B3), abstr. 178. Keystone, CO, 25 to 30 January 2009.
- 10.Davis, S. L., P. Um, G. Lamichane, S. Nimmagadda, M. G. Pomper, W. R. Bishai, and S. K. Jain. 2008. Abstr. World Mol. Imaging Congr., abstr. 294. Nice, France, 10 to 13 September 2008.
- 11.Demura, Y., T. Tsuchida, D. Uesaka, Y. Umeda, M. Morikawa, S. Ameshima, T. Ishizaki, Y. Fujibayashi, and H. Okazawa. 2009. Usefulness of 18F-fluorodeoxyglucose positron emission tomography for diagnosing disease activity and monitoring therapeutic response in patients with pulmonary mycobacteriosis. Eur. J. Nucl. Med. Mol. Imaging 36:632-639. [DOI] [PubMed] [Google Scholar]
- 12.Flynn, J. L. 2006. Lessons from experimental Mycobacterium tuberculosis infections. Microbes Infect. 8:1179-1188. [DOI] [PubMed] [Google Scholar]
- 13.Goo, J. M., J. G. Im, K. H. Do, J. S. Yeo, J. B. Seo, H. Y. Kim, and J. K. Chung. 2000. Pulmonary tuberculoma evaluated by means of FDG PET: findings in 10 cases. Radiology 216:117-121. [DOI] [PubMed] [Google Scholar]
- 14.Hutchens, M., and G. D. Luker. 2007. Applications of bioluminescence imaging to the study of infectious diseases. Cell. Microbiol. 9:2315-2322. [DOI] [PubMed] [Google Scholar]
- 15.Jain, S. K., P. Kwon, and W. J. Moss. 2005. Management and outcomes of intracranial tuberculomas developing during antituberculous therapy: case report and review. Clin. Pediatr. (Philadelphia) 44:443-450. [DOI] [PubMed] [Google Scholar]
- 16.Jain, S. K., G. Lamichhane, S. Nimmagadda, M. G. Pomper, and W. R. Bishai. 2008. Antibiotic treatment of tuberculosis: old problems, new solutions. Microbe 3:285-292. [Google Scholar]
- 17.Kubota, R., S. Yamada, K. Kubota, K. Ishiwata, N. Tamahashi, and T. Ido. 1992. Intratumoral distribution of fluorine-18-fluorodeoxyglucose in vivo: high accumulation in macrophages and granulation tissues studied by microautoradiography. J. Nucl. Med. 33:1972-1980. [PubMed] [Google Scholar]
- 18.Mdivani, N., H. Li, M. Akhalaia, M. Gegia, L. Goginashvili, D. S. Kernodle, G. Khechinashvili, and Y. W. Tang. 2009. Monitoring therapeutic efficacy by real-time detection of Mycobacterium tuberculosis mRNA in sputum. Clin. Chem. 55:1694-1700. [DOI] [PMC free article] [PubMed] [Google Scholar]
- 19.Mochizuki, T., E. Tsukamoto, Y. Kuge, K. Kanegae, S. Zhao, K. Hikosaka, M. Hosokawa, M. Kohanawa, and N. Tamaki. 2001. FDG uptake and glucose transporter subtype expressions in experimental tumor and inflammation models. J. Nucl. Med. 42:1551-1555. [PubMed] [Google Scholar]
- 20.Paik, J. Y., K. H. Lee, Y. S. Choe, Y. Choi, and B. T. Kim. 2004. Augmented 18F-FDG uptake in activated monocytes occurs during the priming process and involves tyrosine kinases and protein kinase C. J. Nucl. Med. 45:124-128. [PubMed] [Google Scholar]
- 21.Pan, H., B. S. Yan, M. Rojas, Y. V. Shebzukhov, H. Zhou, L. Kobzik, D. E. Higgins, M. J. Daly, B. R. Bloom, and I. Kramnik. 2005. Ipr1 gene mediates innate immunity to tuberculosis. Nature 434:767-772. [DOI] [PMC free article] [PubMed] [Google Scholar]
- 22.Park, I. N., J. S. Ryu, and T. S. Shim. 2008. Evaluation of therapeutic response of tuberculoma using F-18 FDG positron emission tomography. Clin. Nucl. Med. 33:1-3. [DOI] [PubMed] [Google Scholar]
- 23.Pauwels, E. K., M. J. Ribeiro, J. H. Stoot, V. R. McCready, M. Bourguignon, and B. Maziere. 1998. FDG accumulation and tumor biology. Nucl. Med. Biol. 25:317-322. [DOI] [PubMed] [Google Scholar]
- 24.Perrin, F. M., M. C. Lipman, T. D. McHugh, and S. H. Gillespie. 2007. Biomarkers of treatment response in clinical trials of novel antituberculosis agents. Lancet Infect. Dis. 7:481-490. [DOI] [PubMed] [Google Scholar]
- 25.Radu, C. G., C. J. Shu, E. Nair-Gill, S. M. Shelly, J. R. Barrio, N. Satyamurthy, M. E. Phelps, and O. N. Witte. 2008. Molecular imaging of lymphoid organs and immune activation by positron emission tomography with a new [18F]-labeled 2′-deoxycytidine analog. Nat. Med. 14:783-788. [DOI] [PMC free article] [PubMed] [Google Scholar]
- 26.Rook, G. A., J. Taverne, C. Leveton, and J. Steele. 1987. The role of gamma-interferon, vitamin D3 metabolites and tumour necrosis factor in the pathogenesis of tuberculosis. Immunology 62:229-234. [PMC free article] [PubMed] [Google Scholar]
- 27.Rosenthal, I. M., K. Williams, S. Tyagi, A. A. Vernon, C. A. Peloquin, W. R. Bishai, J. H. Grosset, and E. L. Nuermberger. 2005. Weekly moxifloxacin and rifapentine is more active than the denver regimen in murine tuberculosis. Am. J. Respir. Crit. Care Med. 172:1457-1462. [DOI] [PMC free article] [PubMed] [Google Scholar]
- 28.Rosenthal, I. M., M. Zhang, K. N. Williams, C. A. Peloquin, S. Tyagi, A. A. Vernon, W. R. Bishai, R. E. Chaisson, J. H. Grosset, and E. L. Nuermberger. 2007. Daily dosing of rifapentine cures tuberculosis in three months or less in the murine model. PLoS Med. 4:e344. [DOI] [PMC free article] [PubMed] [Google Scholar]
- 29.Schluger, N. W. 2007. Keystone Symposia on Tuberculosis: from Lab Research to Field Trials (C6), abstr. 041, Vancouver, British Columbia, Canada, 20 to 25 March 2007.
- 30.Vidal, C., J. Hewitt, S. Davis, L. Younes, S. Jain, and B. Jedynak. 2009. Template registration with missing parts: application to the segmentation of tuberculosis infected lungs, p. 718-721. Proceedings of the IEEE International Symposium on Biomedical Imaging, Boston, MA. [DOI] [PMC free article] [PubMed]
- 31.Yanardag, H., C. Tetikkurt, S. Tetikkurt, S. Demirci, and T. Karayel. 2003. Computed tomography and bronchoscopy in endobronchial tuberculosis. Can. Respir. J. 10:445-448. [DOI] [PubMed] [Google Scholar]
- 32.Zhuang, H., and A. Alavi. 2002. 18-Fluorodeoxyglucose positron emission tomographic imaging in the detection and monitoring of infection and inflammation. Semin. Nucl. Med. 32:47-59. [DOI] [PubMed] [Google Scholar]
Associated Data
This section collects any data citations, data availability statements, or supplementary materials included in this article.