

Abstract
To evaluate the impact of immunodominance on CD8 T-cell properties, we compared the functional properties of dominant and subdominant populations in the response to lymphocytic choriomeningitis virus (LCMV). To improve functional discrimination, in addition to the usual tests of phenotype and function, we used a sensitive technique that allows the screening of all CD8 effector genes simultaneously in single cells. Surprisingly, these methods failed to reveal a major impact of clonal dominance in CD8 properties throughout the response. Aiming to increase clonal dominance, we examined high-frequency transferred P14 T-cell receptor transgenic (TCR Tg) cells. Under these conditions LCMV is cleared faster, and accordingly we found an accelerated response. However, when Tg and endogenous cells were studied in the same mice, where they should be subjected to the same antigen load, they showed overlapping properties, and the presence of P14 cells did not modify endogenous responses to other LCMV epitopes or a perturbed immunodominance hierarchy in the memory phase. Using allotype-labeled Tg cells, we found that during acute infection up to 80% downregulated their TCR and were undetectable by tetramer binding, and that tetramer-negative and tetramer-positive cells had very different features. Since Tg cells are not available to evaluate immune responses in humans and, in many cases, are not available from the mouse, the tetramer-based evaluation of early immune responses in most situations of high viremia may be incomplete and biased.
The lymphocytic choriomeningitis virus (LCMV)-induced immune cell response in mice is particularly impressive in its breadth, since at the peak of the response ∼90% of activated splenic CD8+ T cells are directed against 28 defined epitopes in H-2b mice (23, 24, 27). The immunodominance hierarchy then observed may be determined by a variety of parameters, including epitope prevalence, antigen processing and/or its binding affinity to major histocompatibility complex (MHC), T-cell precursor frequency and/or recruitment, and T-cell receptor (TCR) affinity and avidity (55). However, the extent to which this immunodominance guides functional performance still is unknown. Related to this issue is the question of whether the information generated from studies involving artificially induced immunodominance by the adoptive transfer of TCR transgenic (Tg) cells at a high precursor frequency can be generalized to endogenous cells, which are present in small numbers (10−4 to 10−5) and consist of polyclonal T-cell subpopulations with different avidities. It was suggested recently that CD8+ TCR Tg cells originating from precursors introduced at unnaturally high frequencies exhibit altered differentiation during infection, as they were shown to reexpress CD62L and interleukin-7R (IL-7R) much sooner than endogenous cells (2, 26). However, it remains controversial whether these findings reflect, as suggested, major differences in differentiation pathways (2, 26) or whether the observed dissimilarities are due to differences in differentiation kinetics (35).
Cytotoxic effector CD8+ T cells generated in various infectious models traditionally were regarded as uniform populations that could secrete gamma interferon (IFN-γ) and tumor necrosis factor alpha (TNF-α) upon in vitro restimulation and exert cytotoxic effects (12). However, the current methods used to study CD8 function during immune responses have several limitations. Cells producing cytokines usually are not detected directly ex vivo, because these proteins, once produced, are immediately secreted into the environment and do not accumulate inside the cell in amounts sufficient to be visualized by intracellular staining. Therefore, cytokine production currently is detected after in vitro restimulation, but under these conditions antigen-experienced cells from a normal response (where cells are not tolerized) all score very similarly, i.e., it is no longer possible to distinguish the expansion phase, effector peak, or memory cells’ cytokine expression capacities; these tests similarly identify all antigen-specific cells throughout the response (29). Concerns were raised that the in vitro restimulation necessary for revealing many functional traits could result in the erroneous overestimation of the number and quality of effector cells present in situ at any given time. Indeed, it was shown that in vitro restimulation could induce major alterations in ex vivo readouts: IFN-γ mRNA expression frequencies of 10% evaluated ex vivo were shown to increase to 90% (47), and TNF-α expression increased from <1 to 100% after a 4-h peptide stimulation (31). These differences may be due to the organ's three-dimensional structure, which significantly modifies CD8 responses (38). In addition, cytokine secretion greatly depends on the strength of stimulation (16, 37). Therefore, the in vitro environment may fail to reproduce the in vivo cell interactions, the peculiar inflammatory environment induced by the infection, and the local amount of pathogen-derived peptides.
To monitor CD8 differentiation as it unfolds in vivo, we recently developed a sensitive reverse transcription-PCR (RT-PCR) method capable of measuring the expression of up to 20 genes simultaneously in the same cell without further in vitro manipulation. We showed that this method allows a much better discrimination of cell properties throughout the immune response compared to that of more conventional approaches (28, 32, 33). We could discriminate very different cytokine mRNA expression profiles at different phases of the response. These and other gene expression profiles predicted very different functional properties of CD8 T cells in early expansion, response peak, or memory phase that were confirmed by in vivo functional tests. Notably, we also found that the coexpression frequency of mRNAs coding for perforin and granzyme B in the same cell directly predicted CD8 T cells’ cytotoxic capacity (32).
As the approach described above provided us with a more detailed analysis of the behavior of CD8+ T cells during immune responses, we applied it together with other more conventional approaches to study the influence of clonal dominance in the behavior of CD8 T cells after infection. We studied endogenous cells responding to immunodominant (NP396 and GP33) and subdominant (GP276) LCMV epitopes and found they had similar properties, suggesting that the infectious environment rather than TCR specificity or relative clonal abundance had the major influence in shaping T-cell properties. To amplify differences in relative clonal abundance, we further compared high-frequency transferred TCR Tg cells specific for the GP33 epitope (P14) to the endogenous cells recognizing the same or other LCMV peptides. Surprisingly, we found that previously reported differences in Tg behavior (2) could be fully explained by differences in the response kinetics, since they were not found when Tg and endogenous cells were studied in the same mouse. Moreover, P14 transfers did not modify the endogenous response to other LCMV epitopes or the immunodominance hierarchy in the memory phase. Finally, in these adoptive transfer studies we could monitor the transferred Tg population by both allotype labeling and GP33 tetramer binding. We found that during the expansion phase, a substantial fraction of allotype-positive Tg cells downregulated TCR expression and could not be recognized by tetramer binding, and that tetramer-negative (tetneg) and tetramer-positive (tetpos) cells had very different properties. These results reveal that the evaluation of the early immune response in normal individuals by tetramer binding is incomplete and may be very biased. Thus, TCR Tg cells, because of their ease of detection by allotype markers, may provide the only means of accurately characterizing the entire spectrum of activated CD8 T cells in the early stages of the immune response.
MATERIALS AND METHODS
Mice.
CD45.2 Rag2−/− P14 TCR Tg mice (P14) expressing a TCR specific for LCMV epitope GP33-41 (GP33) and backcrossed onto the C57BL/6 (B6) background were bred at the Centre de Distribution, Typage et Archivage (CDTA, Orléans, France). B6.CD45.1 and B6.CD45.2 mice were purchased from Charles River (Margate, United Kingdom) and the Jackson Laboratory (Bar Harbor, ME). Animal studies were carried out according to United Kingdom Home Office regulations or the University of Massachusetts Medical School, Department of Animal Medicine, regulations and were approved by the site ethical review committee.
Antibodies, MHC class I (MHC-I) tetramers, and other reagents.
Labeled antibodies to CD8, CD45.2, CD45.1, TCRαβ, CD69, CD3, Ly6C, CD25, CD27, CD127, CD44, CD122, KLRG1, IFN-γ, TNF-α, and IL-2 and isotype-matched control antibodies were from either BD Biosciences (San Jose, CA) or eBioscience (San Diego, CA). Granzyme B was from Caltag. GP33-41 H-2Db (GP33), NP396-404 H-2Db (NP396), and GP276-286 H-2Db (GP276) tetramers were obtained from Beckmann Coulter (Marseille, France). 5-(6)-Carboxyfluorescein diacetate succinimidyl ester (CFSE) was obtained from Molecular Probes (Eugene, OR).
Viral growth and titration and infection of mice.
LCMV strain Armstrong (clone 5.3b) was grown in BHK-21 cells, and infectious LCMV was quantitated by plaque assay on Vero cell monolayers as previously described (9). B6 mice were infected intraperitoneally with 2 × 10⁵ PFU of LCMV Armstrong. Some animals were inoculated with 5 × 10³ or 5 × 10⁵ TCR Tg cells (prepared from the lymph nodes of P14 mice) 1 day prior to infection.
CFSE labeling, intracellular staining, and in vivo cytotoxicity assays.
CFSE labeling was done by incubating cells for 10 min at 37°C with 1 μM CFSE in RPMI medium. Cells were labeled with CFSE by incubation for 10 min at 37°C with 1 μM CFSE in RPMI. For intracellular cytokine staining, splenocytes from LCMV-infected mice were incubated without peptide or with 0.2 to 0.4 μg/ml NP396, GP33, or GP276 peptide for 5 h in the presence of 10 μg/ml of brefeldin A, and then cytokine levels were determined. Granzyme B staining was performed without restimulation. Intracellular staining was performed using the Cytofix/Cytoperm kit (BD Biosciences, San Jose, CA) according to the manufacturer's instructions. In vivo cytotoxicity assays were performed as previously described (4). Briefly, a mixture of 107 GP33 or NP396 peptide-pulsed (1 μM) CFSE-labeled and 107 nonpulsed nonlabeled splenocytes was injected intravenously into LCMV-infected or control mice at 8 and 60 days postinfection. Peptide-specific cytotoxicity was determined in the spleen 12 h later and was calculated using the following formula: 100 − {100 × [(% peptide pulsed infected/% peptide nonpulsed infected)/(% peptide pulsed control/% peptide nonpulsed control)]}.
Single-cell purification and gene expression analysis.
The purification and single-cell sorting of CD8 T cells was described previously (32). P14 cells were distinguished from endogenous GP33-specific cells by the expression of a congenic marker. Each individual cell was analyzed for the coexpression of mRNAs coding for TGF-β (Tgfb1), TNF-α (Tnf), IL-2 (Il2), IFN-γ (Ifng), perforin (Prf1), granzyme A (Gzma), granzyme B (Gzmb), FasL (Fasl), and CD3ɛ (Cd3ɛ), the latter to ensure CD8 sorting specificity. The accuracy and efficiency of the method were described previously (33).
Immunosuppression protocol.
Two months after LCMV infection, mice were depleted of T cells by the intraperitoneal injection of 500 μg of anti-CD8α antibody (clone 53.6.7) and 500 μg of anti-Thy1.2 antibody (clone 30H12) twice per week for five consecutive weeks, and lung, lymph nodes, spleen, kidney, testes, brain, liver, and bone marrow were harvested for the determination of virus titers. Virus titers in spleen, serum, or other tissues were determined by plaque forming (49).
Statistical analysis.
Associations or dissociations between the pattern of expression of different genes and differences in the expression of individual genes between different populations of cells were analyzed using a two-tailed Fisher's exact test. A P value of <0.05 was considered statistically significant.
Gene nomenclature.
Abbreviations used for mRNAs were those recommended by the International Committee on Standardized Genetic Nomenclature for Mice.
RESULTS
Endogenous CD8+ T cells with different epitope specificities exhibit similar differentiation patterns after LCMV infection.
Although a reproducible response hierarchy is found during LCMV infection in mice (15, 29), it still is unclear whether dominant and subdominant T cells are functionally distinct and/or whether their differentiation kinetics differ. To address this, first we screened responding cells for the expression of 14 effector genes known to be expressed by T lymphocytes (32). We found that during LCMV infection, only eight of these genes were expressed. We evaluated the pattern of these genes’ expression in CD8+ T-cell populations specific for two dominant LCMV epitopes (NP396 and GP33) and one subdominant epitope (GP276) following the infection of mice with LCMV Armstrong, which should cover all effector mediators during this response. The ratio between the most and the least abundant populations (NP396 and GP276 specific) was approximately 1:3 to 1:4, and the size of the GP33-specific population was between these levels (Fig. 1A), which is consistent with observations made in previous studies (29). At days 4 to 5 postinfection, ex vivo cytokine gene expression was identical between cells responding to all three epitopes, and approximately half of screened cells expressed Ifng and Tgfb1 (although they were not always coexpressed), while Tnf was expressed in only a minority of cells (Fig. 1B). The frequency of cells expressing effector molecules with direct cytotoxic potential (Gzma, Gzmb, and Prf1) was indistinguishable between GP33- and NP396-specific populations. The only statistically significant difference between the two dominant and the subdominant population was that the latter expressed less Gzma (Fisher's exact test; P = 0.0236 for NP396 versus GP276 and P = 0.0172 for GP33 versus GP276). However, at day 8 the differences were abolished and all populations expressed the individual genes with a similar frequency (Fig. 1B). At the same time, all of the cytotoxic effector genes (Prf1, Fasl, Gzma, and Gzmb) reached the peak of their expression. Due to a lack of suitably optimized antibodies to evaluate native perforin, we could quantitate protein levels of only granzyme B at the single-cell level. Intracellular staining for granzyme B demonstrated that mRNAs were actively translated into large amounts of protein, as the percentages of cells expressing granzyme B mRNA and protein were approximately equal (Fig. 1C). To simplify the analysis of gene coexpression (and to provide an estimate of the cytotoxic potential of the cells in each population), we determined the number of cells that coexpressed cytotoxic genes (Prf1, Gzmb, Gzma, and Fasl) and calculated the cumulative proportion of cells expressing all four of these mRNAs, ≥3, ≥2, or ≥1 (Fig. 1D). On day 8 postinfection, approximately 90% of all cells expressed at least one of these cytotoxic effector genes, while 40 to 50% coexpressed three or more.
FIG. 1.

Differentiation patterns of CD8 cells recognizing dominant and subdominant LCMV epitopes show marked similarity. B6 mice were infected with 2 × 10⁵ PFU of LCMV Armstrong. (A) The number of NP396-tet+, GP33-tet+, and GP276-tet+ cells in the spleen was analyzed at different time points after infection. The results shown are the means of values from three to six mice tested in two separate experiments, and the error bars indicate one standard error above the means (SEM). (B) Individual cells of each epitope specificity were recovered at the indicated times (days) postinfection from six individual mice in two independent experiments and were tested directly ex vivo for the coexpression of the indicated effector mRNAs. Forty-five to 90 cells of each specificity were evaluated per time point. Only wells that were positive for CD3ɛ (indicating that they contained a cell) were included in the analysis. Since we did not find significant variation between mice and between experiments, the data were pooled. Each horizontal row represents the pattern of gene expression in the same single cell; representative results from 40 cells are shown. Gene expression is indicated in black, and negative results are shown in white. Cells are ordered by the number of cytotoxic effector genes they expressed. The percentages at the bottom of each column represent the frequency at which the indicated gene was expressed in the whole population analyzed. (C) On day 8 postinfection, NP396-, GP33-, and GP276-reactive cells were identified by tetramer staining, and granzyme B expression in each population was analyzed directly ex vivo by intracellular staining. The filled histograms represent granzyme B staining, and the white histograms show the staining of the same populations with an isotype-matched control antibody. (D) The number of mRNAs for cytotoxic effector genes (Prf1, Gzma, Gzmb, and FasL) coexpressed by each cell was calculated (0 to 4). The results are expressed cumulatively as the percentage of cells specific for a given epitope that coexpressed mRNAs for ≥1, ≥2, ≥3, or 4 of these genes at the indicated times postinfection (a cell expressing two genes would be included in both the ≥2 and ≥1 categories. Statistically significant differences (as determined using Fisher's exact test) are marked (*, P < 0.05). (E) Phenotypes of LCMV- specific T cells at day 8 after infection. Graphs are from one individual mouse out of six mice studied in two independent experiments showing overlapping results. (F) Phenotypes of LCMV-specific memory cells. Results are from one mouse out of seven studied in three independent experiments. We found considerable variation in the expression of CD62L.
We have shown previously that during maturation from the effector to the memory phase, OT-1 and HY TCR Tg cells markedly reduced effector gene expression and coexpression (32). These findings were confirmed in all three endogenous populations analyzed here. At day 60, the frequency of the expression of the majority of effector genes was much lower than that at the peak of cell expansion, and the cells showed a low level of gene coexpression (less than 30% of cells expressed two or more genes together) (Fig. 1B and D). While a similar proportion of NP396- and GP33-specific cells expressed at least one of the cytotoxic effector genes, a slightly higher proportion of GP276-specific did so (Fig. 1D). Importantly, however, the percentage of cells expressing each individual gene was not significantly different in memory populations of different immunodominance. Overall, these results show that dominant and subdominant populations do not show major differences in effector gene expression patterns. Besides, cytokine expression after T-cell activation previously failed to discriminate between differences of cell populations recognizing different LCMV peptides (29).
We next determined if differences in immunodominance have an impact on the expression of cell surface markers associated with CD8 differentiation. At the peak of the response, LCMV-specific T cells had fully downregulated CCR7, CD62L, and IL-7R and upregulated CD27 and KLRG1 (Fig. 1E). While dominant NP396- and GP33-specific cells scored similarly for all of these parameters, GP276-specific cells showed a slight decrease in CD27 expression and an increase in KLRG1 expression. This difference could be due to the delayed kinetics of GP276-specific cells we already detected in our gene expression analysis and that disappeared in the memory phase. As described previously, LCMV-specific memory cells reexpressed CCR7, CD62L, and IL-7R, further upregulated CD27, and downregulated KLRG1 (Fig. 1F) (41, 50). Since, in contrast to what is found in human T cells, CCR7 and CD62L are not necessarily coexpressed in mouse memory cells (42), we evaluated the coexpression of these two markers. Indeed, we found a significant fraction of CCR7+ CD62Llow/− cells in all LCMV-specific memory populations, i.e., these cells could not be classified as either T-cell central memory (TCM) or T-cell effector memory (TEM) (Fig. 1F). Besides, both CCR7− and KLRG1+ cells expressed IL-7R, in contrast to what is found in human cells. Therefore, the overall phenotype of LCMV-specific mouse memory cells contrasts to that found in human populations, where TCM CCR7+ cells express CD62L and the loss of CCR7 and KLRG1 correlates with IL-7R downregulation. It also must be noted that human TCM and TEM populations have very different functional properties and gene expression profiles even when studied using our single-cell strategy (25, 28), while the gene expression of the NP396-specific cell cohort, which had more CCR7− and CD62Llow cells, was similar to that found in other cell types (Fig. 1B). These results indicate that TCM and TEM human memory populations have no direct equivalent in the mouse.
The comparison of memory cell phenotypes showed variations both between individual mice studied in the same experiment and between experiments (see below). However, the NP396-specific cohort frequently had higher frequencies of CCR7− CD62L− cells and a slight reduction of CD27high representation than cells with other LCMV specificities, but other phenotypes were equivalent. These results confirm that cells recognizing the NP396 epitope have a slower kinetics of CD62L upregulation (35). However, the reduced expression of CD62L in the dominant NP396-specific population contradicts the notion that more abundant clones preferentially upregulate CD62L (30).
Long-term gene expression at the memory stage is not due to viral latency.
As CD8+ T-cell differentiation during LCMV Armstrong infection resulted in the generation of a substantial fraction of memory cells expressing mRNAs for at least one cytotoxic effector component, we considered the possibility that viral clearance is incomplete, and that although it is undetectable by plaque-forming assays, virus may be persisting at low levels, as has been found to occur with more pathogenic LCMV strains such as LCMV WE (7). CD8-deficient or CD8-depleted mice are unable to contain the virus (11), so we reasoned that if virus was latent, it would reappear if T cells were depleted. We thus rendered a group of mice that had resolved an acute LCMV infection immunodeficient by depleting them of T cells and tested them for the reemergence of virus. Plaque-forming assays carried out on lymphoid tissues and various peripheral organs (brain, kidney, testis, liver, and lung) of T-cell-depleted animals were all negative (data not shown), strongly arguing against the possibility that chronic low-level stimulation by LCMV was provoking long-term gene expression.
We have noted previously that the quantity of mRNA expression for each memory CD8 T cell was significantly below the levels found at the peak of the response (32). Moreover, memory cells did not express measurable levels of granzyme B protein (Fig. 2A) and did not secrete IFN-γ without restimulation (data not shown), confirming previous findings (51). Nevertheless, in contrast to naïve cells, they were capable of performing peptide-pulsed target elimination after 12 h, which was remarkably similar to target elimination by effector cells (Fig. 2B). This analysis confirmed our previous findings that mRNA profiles constitute sensitive means of predicting the cytotoxic potential of CD8 cells (32).
FIG. 2.
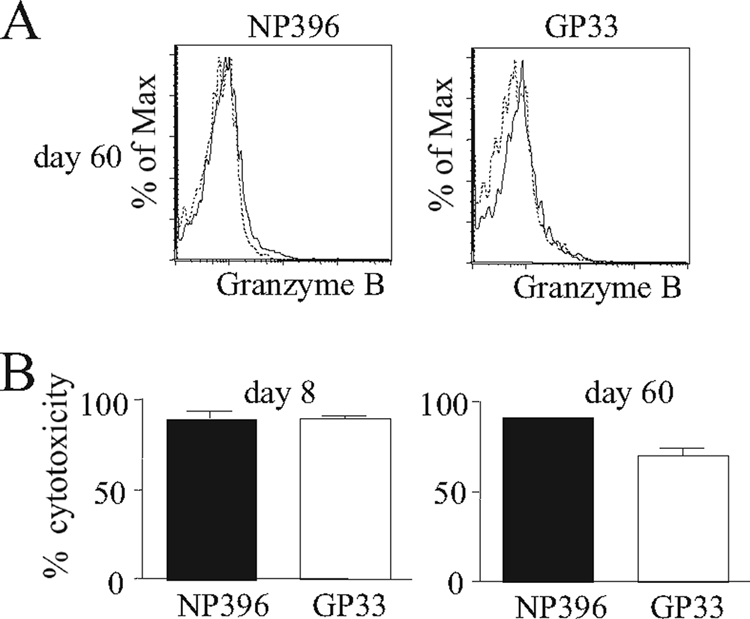
Long-term gene expression in memory cells is not due to viral latency. B6 mice were infected with 2 × 10⁵ PFU of LCMV Armstrong. (A) Intracellular granzyme B expression was analyzed on days 8 and 60 postinfection for the indicated epitope-restricted populations (black line). The isotype control staining of the same cell populations also is shown (dashed line). The profile shown is representative of results obtained from three individual mice. (B) An in vivo cytotoxicity assay also was performed on days 8 and 60 postinfection, and specific cytotoxicity is depicted; the results shown are the mean of data from three individual mice, and the error bars indicate standard errors of the means.
Monoclonal TCR Tg cells and the endogenous cells of the same specificity have identical differentiation patterns.
As we did not observe any striking differences in the expression profiles of several cytokine and cytotoxic effector molecules between the dominant and subdominant populations, we asked if a more robust immunodominance hierarchy established upon the adoptive transfer of high numbers of TCR Tg cells, in which the latter would dominate the endogenous repertoire, would reveal the differences in effector and memory cell generation. We initially compared the functional properties of LCMV-specific memory cells generated after the adoptive transfer of large (5 × 10⁵) and small (5 × 10³) numbers of P14 cells. Given an estimated engraftment level of 10% (5), the low-dose adoptive transfer likely would have resulted in a precursor frequency approaching that of the endogenous GP33-specific precursors, while the high dose likely exceeded it by more than 100-fold (5, 24, 30). Importantly, memory P14 cells originating from large and small cell numbers had similar IFN-γ and TNF-α secretion potential upon in vitro restimulation (Fig. 3A), arguing against the previously suggested idea that a shifted CD8+ T-cell maturation at the beginning of the response has a long-term effect on memory T-cell functions (2).
FIG. 3.

Differentiation patterns of adoptively transferred TCR Tg cells and endogenous cells recognizing the same epitope in the same mice. (A) B6.Ly5.1 mice were injected with 5 × 10⁵ or 5 × 10³ P14 Tg cells (Ly5.2+) and infected with 2 × 10⁵ PFU of LCMV Armstrong. At day 90 postinfection, splenocytes were removed and restimulated in vitro with the GP33 peptide, and the proportion of P14 cells producing IFN-γ and TNF-α was analyzed by intracellular cytokine staining. The dot plots show representative results from one animal in each group and are gated on P14+ cells. The percentage of P14+ cells secreting each cytokine is indicated within the dot plots. (B to E) B6.Ly5.1 mice were injected with 5 × 10⁵ P14 Tg cells (Ly5.2+) and infected with 2 × 10⁵ PFU of LCMV Armstrong. (B) The proportion of P14 and endogenous GP33-specific cells in the spleen was analyzed over time in the same mice. The mean results from three individual mice are shown, and the error bars indicate standard errors of the means. The inset shows a magnification of the endogenous cell graph. (C) Gene expression in individually sorted P14 and endogenous GP33-specific cells was analyzed; the results are presented as described for Fig. 1B. (D) The pattern of the coexpression of cytotoxic effector mRNAs also was analyzed and is presented as described for Fig. 1D. (E) The percentage of cells on day 60 expressing each of the indicated genes (cytotoxic effector genes as shown in Fig. 3B) was analyzed and is shown for 90 individually sorted P14 and 70 endogenous GP33-specific cells. The cells were obtained from three individual mice.
We next compared the early phases of the response. The differentiation of CD8+ T cells initially present at either high or low precursor numbers was analyzed previously in the different animals. However, adoptive transfers of >105 TCR Tg cells accelerate the speed of viral clearance (10, 56). It therefore was possible that the observed differences in T-cell differentiation kinetics (2, 26, 45) were attributable to the differences in the antigen clearance between mice left uninjected or injected with high frequencies of naïve cells. We therefore restricted our investigation to the comparison of P14 cells transferred at high precursor frequencies to endogenous cells present in the same mice to allow both populations to have an equal exposure to the infectious environment. The gene expression analysis of naïve P14 cells showed that rare cells expressed either Tgfb1 or Prf1 but none of the other effector genes (data not shown). At days 4 to 8 of the response, TCR Tg cells outnumbered endogenous GP33-specific cells by up to 30-fold (Fig. 3B), but the cytokine and cytotoxic effector genes transcribed in both populations were similarly represented. The resemblance between those populations also was apparent on the analysis of cytotoxic gene coexpression (Fig. 3D). Most importantly, memory TCR Tg and endogenous GP33-specific cells had the same expression frequencies for all screened genes (Fig. 3C and E). In summary, once putative differences in antigen loads are avoided, both effector and memory GP33-specific cells developing in the same mice from precursors initially present at widely disparate numbers had equivalent expression profiles for all genes tested.
It also was reported that high-dose naïve TCR Tg cell transfers induced the precocious upregulation of CD62L and IL-7R compared to that of equivalent populations injected at a low frequency (2). To determine if these differences also were due to accelerated response kinetics due to the faster resolution of the infectious stimuli, we compared the expression of these markers in normal mice and in P14-transferred mice infected simultaneously with LCMV. One week after infection, the endogenous populations in normal mice had fully downregulated IL-7R and CD62L expression, while P14 Tg cells expressed higher levels of CD62L and IL-7R (Fig. 4A). However, this upregulation was not peculiar to populations present in high frequencies. In P14-injected mice, all LCMV-specific populations (either Tg or endogenous) also upregulated these markers. The abundant P14 and the rare GP33-specific endogenous populations of P14-injected mice expressed similar levels of IL-7R. Endogenous NP396- and GP276-specific cells also upregulated IL-7R expression, although they did so at slightly lower levels than those found in GP33-specific T cells. The CD62L expression was upregulated to equivalent levels in both Tg and endogenous cells of all peptide specificities. These results indicate that the precocious upregulation of these markers described after high-frequency adoptive transfers is not a property of dominant clones. Rather, it appears to be the consequence of accelerated response kinetics that are known to occur in these circumstances, since it affects all LCMV-specific populations present in the same mouse. In addition, we also failed to confirm that Tg memory cells expressed a predominantly CD62Lhi phenotype (Fig. 4B). Rather, we found a significant variation in different mice studied in the same experiment and between experiments.
FIG. 4.

Impact of high-dose naïve Tg transfers on the endogenous response. B6.Ly5.1 mice left untreated or were injected with 5 × 10⁵ P14 Tg cells (Ly5.2+) and were infected simultaneously with 2 × 10⁵ PFU of LCMV Armstrong and studied at days 8 and 60 after infection. (A) CD62L and IL-7R expression in cells of with different peptide specificities at day 8 after infection. Histograms compare CD62L and IL-7R expression levels of CD8 cells with the indicated peptide specificities in 1 P14 injected (inj.) (open graphs) and 1 noninjected B6 mouse (gray) of 12 mice studied in two independent experiments. On the far left, P14 cells (open histogram) are compared to GP33-specific noninjected mice. (B) Variation of CD62L expression in GP33-specific cells 2 months after infection. Graphs compare Tg cells (upper) to endogenous cells present in the same mouse (middle). The lower graphs show endogenous cells in the mice that were not injected with P14 cells. (C) Absolute numbers of cells of different peptide specificity at day 8 (left) and 2 months (right) after infection. Results show individual mice from one experiment out of two with equivalent results. (D) IFN-γ expression after in vitro stimulation with NP396 and GP276 peptides at day 8 (left) and 2 months (right) after infection.
Finally, we evaluated the impact of high-dose P14 adoptive transfers on endogenous response. As reported previously (5) and shown in Fig. 1, the absolute number of endogenous GP33-specific cells was reduced in P14-injected mice compared to that found in normal mice infected simultaneously (Fig. 4C). Surprisingly, P14 adoptive transfers did not substantially affect the T-cell responses to other LCMV epitopes (Fig. 4C and D). At both the response peak and at the memory phase, the number of NP396- and GP276-specific cells determined either by tetramer staining or their capacity to secrete cytokines after in vitro stimulation (Fig. 4D) was similar in P14-injected and normal mice. We conclude that the injection of P14 cells accelerates response kinetics, as shown by the modifications of IL-7R and CD62L in all cells responding to LCMV in P14 injected mice. Otherwise, it does not affect the properties of LCMV-specific cells or influence the endogenous responses to other LCMV epitopes.
TCR downregulation at the early stages of the response masks the detection of Ag-specific cells.
A potential drawback to the use of tetramer staining to identify epitope-specific T cells for functional profiling is the TCR downregulation that follows T-cell activation. We tested whether tetramer staining is a reliable marker of Ag-specific cells during the immune response. The Tg cells that can be identified by an allotype marker showed a substantial loss of surface tetramer labeling during the expansion period. This effect was not immediate, sparing the first 2 days of the response, when TCR-Tg cells were activated but most had not divided (not shown). At day 3 of the LCMV response, we saw considerable mouse-to-mouse variability, with 30 to 70% of P14 cells being undetectable by tetramer labeling. By day 5, less mouse-to-mouse variation was observed, yet 25% of P14 cells did not label with tetramers (Fig. 5A). The comparison of tetneg and highly tetramer-positive (tethi) populations showed that the former did not express CD3, confirming that the loss of tetramer binding was caused by TCR downregulation (Fig. 5B, upper row). We further tested if TCR downregulation could bias the evaluation of the properties of antigen-specific cells during the response. Indeed, tetneg and tethi cells on day 3 of infection differed in CD69, CD27, CD25, and Ly6C expression levels (Fig. 5B, lower row), while IL-7R, CD122, and CD44 were expressed similarly (data not shown). To investigate if such downregulation was just an artifact induced by high-frequency transfers or could occur when antigen-specific naïve cells were present at a physiologic number, we studied Tg cells injected at low frequency. As expected, the kinetics of the Tg cell response was much slower. At day 4, TCR downmodulation was evident but Tg cells were very rare. We found a considerable TCR downmodulation even at day 5 of the response, when more than half of the Tg pool was failing to bind tetramers (Fig. 5C).
FIG. 5.

MHC-I tetramer labeling during the expansion phase. B6.Ly5.1 mice left untreated or receiving Ly5.2+ P14 Tg cells were infected with 2 × 10⁵ PFU of LCMV Armstrong and studied at different time points after infection. (A and B) Mice were injected with 5 × 10⁵ Tg cells. (A) Results compare GP33 tetramer (tet) binding in Ly5.2+ P14 naïve cells and in P14 cells at on day 3 (top) and day 5 (bottom) after infection. Staining is from individual mice representative of four experiments with two to three mice per time point. (B) On day three after infection, P14 cells were arbitrarily subdivided into tetneg (gray) and tethi (white) subsets, and each population was tested for the expression of the indicated cell surface molecules. Gates for tetneg cells were established in noninfected B6 mice and for tethi in naïve Tg cells. (C) B6 mice were injected with either 5 × 10⁵ or 104 Ly5.2+ P14 Tg cells and studied at days 4 and 5 after infection. Results are for GP33 tetramer binding in P14 Tg cells. Naïve mice (upper left), cells from mice injected with 5 × 10⁵ naïve cells (upper right), and cells from three individual mice injected with 104 naïve cells (lower graphs) are shown. At day 4, very few Tg cells were detected in the latter mice. (D) Granzyme B expression in cells expressing different tet binding intensity in normal mice. CD8 cells were recovered 5 days after infection, labeled with GP276 tetramers, and subdivided into tetint and tethi populations. Results show the gates used for such subdivision and intracellular granzyme B staining for tetint (gray) and tethi (white) populations; the dashed lines represent the staining of the same cells with an isotype control antibody.
We aimed to investigate if TCR downregulation also could bias the evaluation of the normal endogenous response. Since tetneg endogenous cells cannot be visualized, we compared tethi and tetramer-intermediate (tetint) cells in normal mice (Fig. 5D). Importantly, tetint cells had substantially higher granzyme B expression than tethi cells (Fig. 5D), directly linking the activation status measured by TCR downmodulation to a different effector profile. Thus, although we lack the means to test for the endogenous cells that are completely tetneg (since these cells do not express TCR they also should not score as IFN-γ producers after in vitro stimulation), our results strongly suggest that our current methods of detection fail to identify a substantial fraction of antigen-specific cells during the expansion phase, and moreover, they introduce bias in the evaluation of the properties of antigen-specific cells from normal mice.
Cytokine and cytotoxic effector gene expression are not synchronized.
As T cells do not reach lymphoid organs synchronously and are exposed to highly varied microenvironmental stimuli, cells at various differentiation stages are found at any given time. Having established that TCR Tg cells allow us to fully assess the early dynamics of the CD8 differentiation, we further subdivided their progression steps by a combination of CFSE and CD69 labeling. CFSE labeling allowed us to focus on the majority of P14 cells (>95%) that have divided four or more times by day 3 (Fig. 6A). The CFSE-low P14 population was further subdivided into more recently and less recently activated subsets on the basis of the differential expression of an early and transient T-cell activation marker, CD69 (34); less advanced CD69+ and more advanced CD69− cells were sorted. When gene expression patterns were analyzed, cytokine gene expression was found to differ from the expression of cytotoxic effector genes, and in general, cytotoxic effector genes were transcribed longer than cytokine genes (Fig. 6B). Cytokine expression consistently peaked early (on day 3 or before), there was no difference between CD69+ and CD69− cells (Fig. 6B), and a highly significant drop of expression occurred during the next day (Fig. 6C). On the other hand, the transcription of cytotoxic effector genes varied: Gzmb and Prf1 peaked early, while Gzma and Fasl were present only in a minority of CD69+ cells, and a significant rise in their expression occurred as they progressed to the CD69− stage (for Gzma, P = 0.0001; for Fasl, P = 0.002). Notably, the generation of Il2 mRNA was found rarely in ex vivo P14 cells (less than 5% of total cells; data not shown) at any of the stages tested (days 3, 4, 8, 15, 30, and 60). The latter finding casts doubt on the physiological significance of reports that TCR Tg effector CD8 cells arising from high precursor frequencies are more likely to secrete IL-2 upon in vitro stimulation (2). Il7r downregulation (Fig. 6C) followed the kinetics previously described on a protein level (19). Furthermore, we observed that Ccr7 expression rapidly dropped between days 3 and 4, most likely participating in the release of more mature Ccr7− cells from T-cell-restricted areas of secondary lymphoid tissues. As we have demonstrated that gene expression in LCMV-specific cells evolves very fast over short periods of time and at defined differentiation milestones (such as the CD69+→CD69− transition), the analysis of other markers of cell progression/fath (17) is expected to provide us with an even richer picture of gene differentiation dynamics and cell heterogeneity.
FIG. 6.
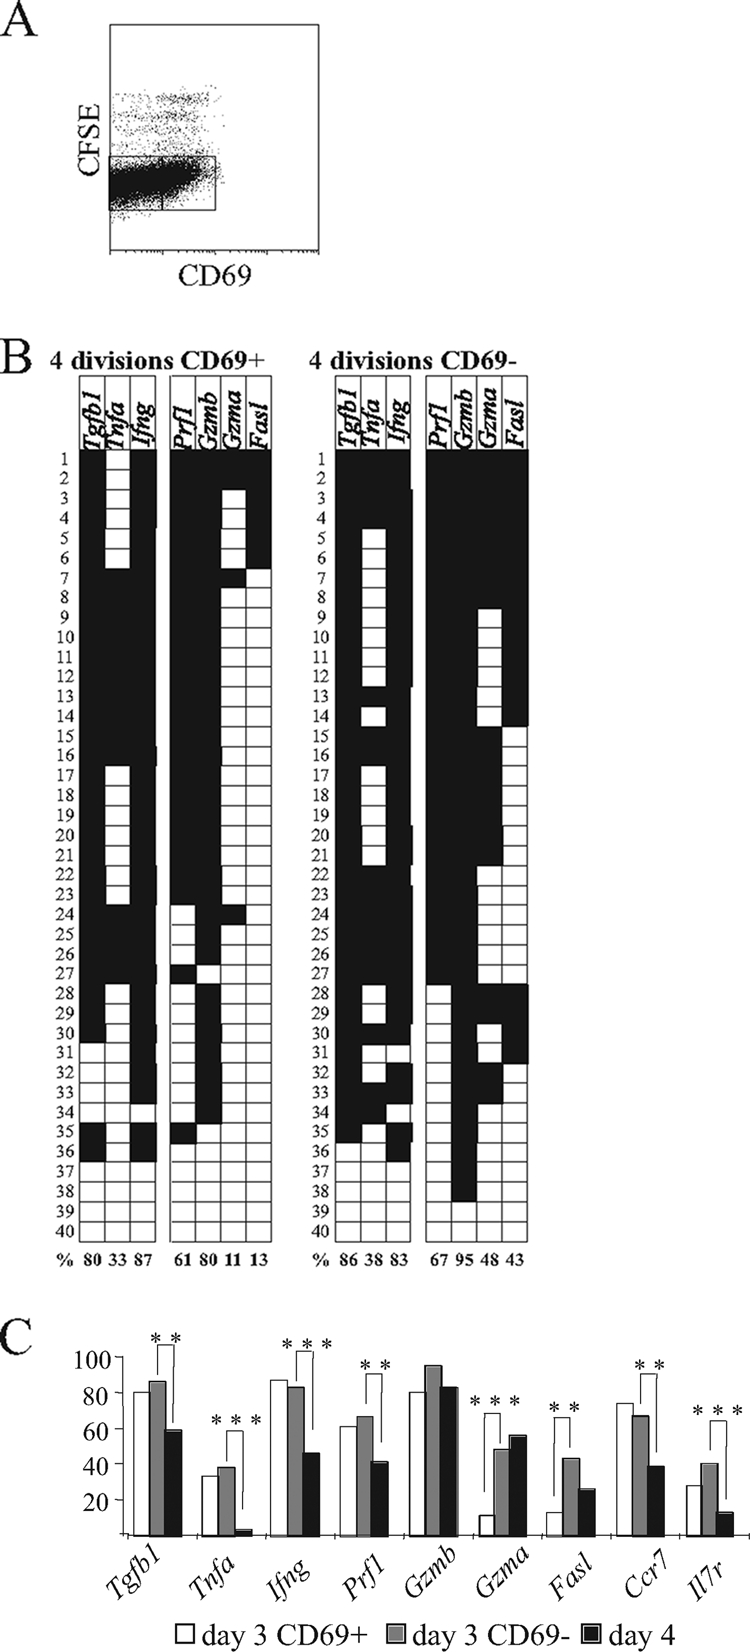
Rapid progress of CD8+ T-cell differentiation during early infection can be monitored using a combination of TCR Tg cells, CFSE division profiles, and CD69 expression. B6.Ly5.1 mice were injected with 5 × 10⁵ P14 Tg cells (Ly5.2+) and infected with 2 × 10⁵ PFU of LCMV Armstrong. (A) At day 3 postinfection, splenocytes were stained with CD69, and division profiles were analyzed by the evaluation of CFSE expression. Cells that had divided four or more times were sorted into two subpopulations (CD69+ and CD69−) based on the indicated gates. (B) Gene expression in individually sorted CD69+ and CD69− P14 cells was analyzed on day 3 postinfection; the results are presented in the same format as that used for Fig. 1B. (C) The progression of gene expression in individually sorted P14 cells was analyzed as the linear maturation of cells occurred (i.e., in the following sequence: day 3 CD69+ cells [white]→ day 3 CD69− cells [grey]→ day 4 [black]). Statistically significant differences between progressive differentiation stages are marked (** and ***, P < 0.01 and P < 0.001, respectively.
DISCUSSION
TCR Tg cells commonly are used in the assessment of the properties of T cells. They are easy to manipulate and to visualize. Their defined TCR expression allows one to monitor the same clone throughout the immune response (39, 40). This characteristic is fundamental to determine if the changes in population properties throughout the response are due to the selection of particular clones of antigen-specific cells. However, it was suggested recently that when TCR Tg cells are present at high precursor frequencies, their intraclonal competition for antigen leads to their suboptimal activation and abnormal differentiation (2, 26, 45). Several reasons prompted us to reexamine this claim in greater detail. First, several studies showed that a short-term contact with an antigen is sufficient to trigger a complete CD8 differentiation program (18, 46), and that extensive CD8 expansion is not a prerequisite for efficient memory generation (3). Second, in other studies effector CD8 numbers seem to hit a similar ceiling regardless of initial variability in precursor numbers or specificity (22), arguing for stimulation-tailored rather than T-cell-intrinsic differentiation pathways. Finally, other data suggested alternative explanations to the different behavior of high- and low-density TCR Tg cell transfers. The adoptive transfers of >105 TCR Tg cells have been shown to alter the kinetics of pathogen clearance and the timing of peak CD8+ T-cell expansion (10, 35, 56). Since high- and low-dose transferred populations were studied systematically in different recipients where antigen loads and antigen clearance are known to be different, alterations in the course of infection could account for the different population properties in mice that received different numbers of TCR Tg cells.
Competition for antigen and clonal competition also occur in normal immune responses and contribute to the immunodominance hierarchy observed. A partial or complete compensation for a loss of a particular epitope by other specificities has been known to occur (1, 21, 24, 36, 44). In some circumstances it has been suggested that the cytokine-mediated active suppression of dominant clones over subdominant ones (immunodomination) occurs (48, 52), but the existence of such active immunosuppression still is disputed (24). Besides, although immunodominance has been studied widely in many infectious models, it still is unclear whether dominant and subdominant populations diverge in their functional capacities and protection capabilities (6, 20, 48). To address these issues, in addition to conventional tests, we performed a powerful single-cell multigene expression study of several antigen-specific populations during the course of LCMV infection in mice. When studied in the same infectious context in the same mice at the same time point of the response, the T-cell populations of different specificities and present at different frequencies showed remarkably similar features. Thus, except at the earliest stages of infection (days 4 to 5) when GP276-specific cells expressed less granzyme A mRNA than NP396- and GP33-specific cells, dominant and subdominant cell effector and memory had remarkably similar cytokine (Ifng, Tnf, and Tgfb1) and cytotoxic gene expression (Prf1, Gzmb, Gzma, and Fasl) and coexpression profiles. Previous comparisons of cytokine profiles after in vitro stimulation also failed to reveal major differences (49), and we found that cell surface markers’ expression most frequently was overlapping. As an exception, the subdominant GP276-specific population showed some delay in CD27 upregulation and KLRG1 downregulation at day 8, but these differences disappeared in the memory phase, when these cells’ phenotypes were equivalent to those found in GP33-specific cells. Conversely, the NP396-specific memory cohort usually had a larger fraction of CCR7− CD62Llow cells than cell populations with other peptide specificities, but otherwise they expressed the same KLRG1 and IL-7R labeling, and it was reported previously that this cell type eventually also upregulates the expression of both of these ligands. Overall, these data directly argue against the hypothesis that dominant and subdominant populations follow disparate differentiation pathways. These findings were confirmed even when major differences in clonal abundance were introduced artificially by the adoptive transfer of Tg cells.
The differentiation profiles of monoclonal T-cell populations recently have fallen under scrutiny, since several reports suggested that the artificial introduction of TCR Tg CD8 cells in numbers exceeding those of endogenous cells of similar epitope specificity (5, 24, 30) resulted in the inadequate differentiation of TCR Tg cells (2, 26, 45). These reports, however, focused mainly on CD62L and IL-7R expression analysis, and functional assays were performed only at a single time point of the infection. These studies also did not take into consideration possible differences in response kinetics that could result from the introduction of a large cohort of naïve Tg cells. Indeed, abundant and rare clone behavior always was studied in different mice, where Tg cells could be submitted to different antigen loads and abundant and rare clone accumulation peaked at different time points (2). Supporting the notion that previously reported differences between high- and low-dose transfers can be explained by a different response kinetics, adoptive transfers of >105 precursors were shown to accelerate the kinetics of pathogen clearance and CD8 expansion (10, 35, 56).
Contrary to those studies, we compared TCR Tg and endogenous cells of the same epitope specificity from the same animals, where both faced exactly the same antigen exposure and showed similar response kinetics. Moreover, when Tg cells are present, the endogenous GP33-specific population expands very little, which should prevent any TCR downregulation early in the response. We found that under these conditions, Tg and endogenous GP33-specific CD8 cells retrieved from the same mice always were remarkably similar. They not only had initiated IL-7R and CD62L upregulation precociously at day 8 but also showed similar phenotypes and gene expression profiles at the response peak. The analysis of CD8 T cells with other specificities in these transferred mice also supported the notion that high-dose transfers only accelerate response kinetics. Indeed, we found that in P14-injected mice both NP396- and GP276-specific populations also had initiated IL-7R and CD62L upregulation at day 8 after infection. Surprisingly, these cells appeared to be otherwise unaffected by the presence of high frequencies of TCR Tg cells. Their frequency and their capacity to produce IFN-γ was similar in mice left untreated or receiving P14 Tg cells. These results demonstrate that high-frequency adoptive transfers do not inhibit overall endogenous responses but only influence the expansion of T-cell populations with the same TCR specificity.
Our results also do not support the notion that high-frequency transfers induce major modifications in the properties of memory cells. We demonstrated that memory cells on day 90 that arose from 5 × 10³ and 5 × 10⁵ P14 cells did not differ in functional capacities such as stimulation-induced cytokine secretion. We did not find evidence for the predominant generation of CD62L+ Tg memory cells in high-frequency transfers. In our hands, the GP33-specific endogenous memory cells frequently expressed more CD62L than the Tg memory cells. Differences between the present and previously published results (2, 26) could be due to mouse-to-mouse variability, as we found in our experiments, or to the fact that we always evaluated endogenous and Tg cells present in the same mouse. Our results suggest that studies showing a preferential expression of CD62L in high-frequency cells were not exhaustive, and that the conclusion that these cells only generate CD62L+ TCM (a major argument to suggest abnormal differentiation) is unreliable.
Overall, these data suggests that high-frequency adoptive transfers just accelerate response kinetics, and that Tg cells only compete with the endogenous cells that share the same TCR specificity. It is likely that such competition is greatly influenced by the relative avidity/cross-reactivity of the TCR Tg cells with respect to the average avidity/cross-reactivity of the endogenous antigen-specific cells. Different Tg CD8s populations were classified according to these parameters in the hierarchy OT1 > P14 > anti-HY (13), which appears to correlate directly with their inhibitory effect on endogenous responses. Indeed, the transfer of the high-avidity/cross-reactive OT-1 clone virtually abrogates endogenous responses, while P14 transfers have a smaller effect (2). In contrast, in high-frequency anti-HY Tg transfers to normal mice, the endogenous cells partially outcompete the Tg population. Both Tg and endogenous responses show reduced amplitude and become similarly represented in the overall anti-HY response (47).
TCR downregulation is a rapid and dose-dependent corollary of T-cell activation in vitro (43) but is rather transitory, lasting for about 24 h. TCR downregulation also was detected in acute infections in vivo (8, 54), but due to the lack of other markers to identify antigen-specific cells, these previous studies could not evaluate fully the extent of this phenomenon. Here, we established that Tg cells identified by an allogeneic marker, even when present at physiologic frequencies, downregulated TCR expression, and a major fraction fully lost TCR cell surface expression and failed to bind tetramers. This behavior is likely a common feature of CD8 immune responses, since we also found it in other infectious models and in other TCR Tg cells (P14 or OT-1 cells immunized with Listeria-expressing GP33 [LM-GP33] or LM-OVA, respectively; unpublished data).
Several aspects of this phenomenon must be emphasized. In contrast to the transient loss of TCR after in vitro activation, in vivo responding populations could remain TCR negative throughout a long time period during the expansion phase; activation status and tetramer binding were inversely correlated, allowing for the possibility that more activated cells could be rendered completely invisible by prominent TCR downregulation.
To summarize, the detailed analysis of CD8 T cells responding to different LCMV epitopes in the same infectious environment showed that relative clone abundance or TCR specificity did not alter substantially the properties of effector and memory cells. From this perspective, the current notion that high-frequency transfers of naïve Tg cells induce abnormal T-cell differentiation must be toned down. We found that differences in Tg behavior can be explained by a different response kinetics, that abundant Tg and rare endogenous cells with the same peptide specificity had overlapping properties, and that Tg cells did not affect the amplitude or the quality of the endogenous response to other LCMV peptides. It also was demonstrated recently that high-frequency transfers did not affect the quality of the memory responses (53). In contrast, the use of TCR Tg cells that can be recognized by allotype markers revealed that during acute infection, when high viral loads are present, a substantial fraction of responding cells downregulate their TCR and fail to bind MHC tetramers, and that tetpos and tetneg cells have different properties. Therefore, TCR-Tg mice may be fundamental for the evaluation of the entirety of the early immune response.
Finally, the important and long-lasting loss of TCR expression we found to occur during the expansion phase has major implications for our capacity to study early events in the vast majority of acute infections in the mouse (when Tg cells are not available) and, more importantly, in humans. Studies based on the tetramer binding identification and/or magnetic bead purification of antigen-specific cells likely are incomplete and biased (14, 30), since they select subpopulations with peculiar properties that do not represent the overall characteristics of the responding peptide-specific cohort. Moreover, it is at present unclear if any of the methods currently used to identify responding cells will be able to do so and in which circumstances. The failure to bind tetramers is due to TCR downregulation. It therefore is possible that the vast majority of tetneg cells also are undetected through cytokine expression after in vitro stimulation with specific peptides, since these responses depend on the cell surface expression of the peptide-specific TCR. Moreover, we found that TCR downregulation increased when higher doses of virus were injected, suggesting that the higher the viremia the more incomplete will be our assessment of the acute response. This important pitfall must be taken into consideration: we may fail to detect a major cohort of responding cells when high virus loads are present.
Acknowledgments
We thank J. D. Ashwell, C. Tanchot, S. Ezine, and A. Freitas for critical reviews of the manuscript and M. Ashton and A. Legrand for expert assistance.
This work initially was supported by grants from l'Agence Nationale de la Recherche and DC-Thera EU Network and now is supported by a grant from the European Research Council and the core funding from the INSERM. I.M. was funded by a Marie Curie Fellowship, H.D. by a CIHR/CAAIF/Bayer fellowship, C.E. (PGDB student) by POCI 2010/FSE (Portugal) and FRM (France), S.L. by the FCT (Portugal), M.W. by Ligue pour la Recherche sur le Cancer, and A.L.B. by the Jenner Institute. P.B. is an Edward Jenner Institute for Vaccine Research Investigator.
Footnotes
Published ahead of print on 2 September 2009.
REFERENCES
- 1.Andreansky, S. S., J. Stambas, P. G. Thomas, W. Xie, R. J. Webby, and P. C. Doherty. 2005. Consequences of immunodominant epitope deletion for minor influenza virus-specific CD8+-T-cell responses. J. Virol. 79:4329-4339. [DOI] [PMC free article] [PubMed] [Google Scholar]
- 2.Badovinac, V. P., J. S. Haring, and J. T. Harty. 2007. Initial T cell receptor transgenic cell precursor frequency dictates critical aspects of the CD8+ T cell response to infection. Immunity 26:827-841. [DOI] [PMC free article] [PubMed] [Google Scholar]
- 3.Badovinac, V. P., B. B. Porter, and J. T. Harty. 2004. CD8+ T cell contraction is controlled by early inflammation. Nat. Immunol. 5:809-817. [DOI] [PubMed] [Google Scholar]
- 4.Barber, D. L., E. J. Wherry, and R. Ahmed. 2003. Cutting edge: rapid in vivo killing by memory CD8 T cells. J. Immunol. 171:27-31. [DOI] [PubMed] [Google Scholar]
- 5.Blattman, J. N., R. Antia, D. J. Sourdive, X. Wang, S. M. Kaech, K. Murali-Krishna, J. D. Altman, and R. Ahmed. 2002. Estimating the precursor frequency of naive antigen-specific CD8 T cells. J. Exp. Med. 195:657-664. [DOI] [PMC free article] [PubMed] [Google Scholar]
- 6.Busch, D. H., I. M. Pilip, S. Vijh, and E. G. Pamer. 1998. Coordinate regulation of complex T cell populations responding to bacterial infection. Immunity 8:353-362. [DOI] [PubMed] [Google Scholar]
- 7.Ciurea, A., P. Klenerman, L. Hunziker, E. Horvath, B. Odermatt, A. F. Ochsenbein, H. Hengartner, and R. M. Zinkernagel. 1999. Persistence of lymphocytic choriomeningitis virus at very low levels in immune mice. Proc. Natl. Acad. Sci. USA 96:11964-11969. [DOI] [PMC free article] [PubMed] [Google Scholar]
- 8.Drake, D. R. R., R. M. Ream, C. W. Lawrence, and T. J. Braciale. 2005. Transient loss of MHC class I tetramer binding after CD8+ T cell activation reflects altered T cell effector function. J. Immunol. 175:1507-1515. [DOI] [PubMed] [Google Scholar]
- 9.Dutko, F. J., and M. B. Oldstone. 1983. Genomic and biological variation among commonly used lymphocytic choriomeningitis virus strains. J. Gen. Virol. 64:1689-1698. [DOI] [PubMed] [Google Scholar]
- 10.Ehl, S., P. Klenerman, R. M. Zinkernagel, and G. Bocharov. 1998. The impact of variation in the number of CD8+ T-cell precursors on the outcome of virus infection. Cell Immunol. 189:67-73. [DOI] [PubMed] [Google Scholar]
- 11.Fung-Leung, W. P., T. M. Kundig, R. M. Zinkernagel, and T. W. Mak. 1991. Immune response against lymphocytic choriomeningitis virus infection in mice without CD8 expression. J. Exp. Med. 174:1425-1429. [DOI] [PMC free article] [PubMed] [Google Scholar]
- 12.Glimcher, L. H., M. J. Townsend, B. M. Sullivan, and G. M. Lord. 2004. Recent developments in the transcriptional regulation of cytolytic effector cells. Nat. Rev. Immunol. 4:900-911. [DOI] [PubMed] [Google Scholar]
- 13.Hao, Y., N. Legrand, and A. A. Freitas. 2006. The clone size of peripheral CD8 T cells is regulated by TCR promiscuity. J. Exp. Med. 203:1643-1649. [DOI] [PMC free article] [PubMed] [Google Scholar]
- 14.Hataye, J., J. J. Moon, A. Khoruts, C. Reilly, and M. K. Jenkins. 2006. Naive and memory CD4+ T cell survival controlled by clonal abundance. Science 312:114-116. [DOI] [PubMed] [Google Scholar]
- 15.Homann, D., L. Teyton, and M. B. Oldstone. 2001. Differential regulation of antiviral T-cell immunity results in stable CD8+ but declining CD4+ T-cell memory. Nat. Med. 7:913-919. [DOI] [PubMed] [Google Scholar]
- 16.Itoh, Y., and R. N. Germain. 1997. Single cell analysis reveals regulated hierarchical T cell antigen receptor signaling thresholds and intraclonal heterogeneity for individual cytokine responses of CD4+ T cells. J. Exp. Med. 186:757-766. [DOI] [PMC free article] [PubMed] [Google Scholar]
- 17.Joshi, N. S., W. Cui, A. Chandele, H. K. Lee, D. R. Urso, J. Hagman, L. Gapin, and S. M. Kaech. 2007. Inflammation directs memory precursor and short-lived effector CD8+ T cell fates via the graded expression of T-bet transcription factor. Immunity 27:281-295. [DOI] [PMC free article] [PubMed] [Google Scholar]
- 18.Kaech, S. M., and R. Ahmed. 2001. Memory CD8+ T cell differentiation: initial antigen encounter triggers a developmental program in naive cells. Nat. Immunol. 2:415-422. [DOI] [PMC free article] [PubMed] [Google Scholar]
- 19.Kaech, S. M., J. T. Tan, E. J. Wherry, B. T. Konieczny, C. D. Surh, and R. Ahmed. 2003. Selective expression of the interleukin 7 receptor identifies effector CD8 T cells that give rise to long-lived memory cells. Nat. Immunol. 4:1191-1198. [DOI] [PubMed] [Google Scholar]
- 20.Kedl, R. M., W. A. Rees, D. A. Hildeman, B. Schaefer, T. Mitchell, J. Kappler, and P. Marrack. 2000. T cells compete for access to antigen-bearing antigen-presenting cells. J. Exp. Med. 192:1105-1113. [DOI] [PMC free article] [PubMed] [Google Scholar]
- 21.Kedzierska, K., C. Guillonneau, S. Gras, L. A. Hatton, R. Webby, A. W. Purcell, J. Rossjohn, P. C. Doherty, and S. J. Turner. 2008. Complete modification of TCR specificity and repertoire selection does not perturb a CD8+ T cell immunodominance hierarchy. Proc. Natl. Acad. Sci. USA 105:19408-19413. [DOI] [PMC free article] [PubMed] [Google Scholar]
- 22.Kemp, R. A., T. J. Powell, D. W. Dwyer, and R. W. Dutton. 2004. Cutting edge: regulation of CD8+ T cell effector population size. J. Immunol. 173:2923-2927. [DOI] [PubMed] [Google Scholar]
- 23.Kotturi, M. F., B. Peters, F. J. Buendia-Laysa, J. Sidney, C. Oseroff, J. Botten, H. Grey, M. J. Buchmeier, and A. Sette. 2007. The CD8+ T-cell response to lymphocytic choriomeningitis virus involves the L antigen: uncovering new tricks for an old virus. J. Virol. 81:4928-4940. [DOI] [PMC free article] [PubMed] [Google Scholar]
- 24.Kotturi, M. F., I. Scott, T. Wolfe, B. Peters, J. Sidney, H. Cheroutre, M. G. von Herrath, M. J. Buchmeier, H. Grey, and A. Sette. 2008. Naive precursor frequencies and MHC binding rather than the degree of epitope diversity shape CD8+ T cell immunodominance. J. Immunol. 181:2124-2133. [DOI] [PMC free article] [PubMed] [Google Scholar]
- 25.Lanzavecchia, A., and F. Sallusto. 2000. Dynamics of T lymphocyte responses: intermediates, effectors, and memory cells. Science 290:92-97. [DOI] [PubMed] [Google Scholar]
- 26.Marzo, A. L., K. D. Klonowski, A. Le Bon, P. Borrow, D. F. Tough, and L. Lefrancois. 2005. Initial T cell frequency dictates memory CD8+ T cell lineage commitment. Nat. Immunol. 6:793-799. [DOI] [PMC free article] [PubMed] [Google Scholar]
- 27.Masopust, D., K. Murali-Krishna, and R. Ahmed. 2007. Quantitating the magnitude of the lymphocytic choriomeningitis virus-specific CD8 T-cell response: it is even bigger than we thought. J. Virol. 81:2002-2011. [DOI] [PMC free article] [PubMed] [Google Scholar]
- 28.Monteiro, M., C. Evaristo, A. Legrand, A. Nicoletti, and B. Rocha. 2007. Cartography of gene expression in CD8 single cells: novel CCR7 subsets suggest differentiation independent of CD45RA expression. Blood 109:2863-2870. [DOI] [PubMed] [Google Scholar]
- 29.Murali-Krishna, K., J. D. Altman, M. Suresh, D. J. Sourdive, A. J. Zajac, J. D. Miller, J. Slansky, and R. Ahmed. 1998. Counting antigen-specific CD8 T cells: a reevaluation of bystander activation during viral infection. Immunity 8:177-187. [DOI] [PubMed] [Google Scholar]
- 30.Obar, J. J., K. M. Khanna, and L. Lefrancois. 2008. Endogenous naive CD8+ T cell precursor frequency regulates primary and memory responses to infection. Immunity 28:859-869. [DOI] [PMC free article] [PubMed] [Google Scholar]
- 31.Panus, J. F., L. J. McHeyzer-Williams, and M. G. McHeyzer-Williams. 2000. Antigen-specific T helper cell function: differential cytokine expression in primary and memory responses. J. Exp. Med. 192:1301-1316. [DOI] [PMC free article] [PubMed] [Google Scholar]
- 32.Peixoto, A., C. Evaristo, I. Munitic, M. Monteiro, A. Charbit, B. Rocha, and H. Veiga-Fernandes. 2007. CD8 single-cell gene coexpression reveals three different effector types present at distinct phases of the immune response. J. Exp. Med. 204:1193-1205. [DOI] [PMC free article] [PubMed] [Google Scholar]
- 33.Peixoto, A., M. Monteiro, B. Rocha, and H. Veiga-Fernandes. 2004. Quantification of multiple gene expression in individual cells. Genome Res. 14:1938-1947. [DOI] [PMC free article] [PubMed] [Google Scholar]
- 34.Sancho, D., M. Gomez, and F. Sanchez-Madrid. 2005. CD69 is an immunoregulatory molecule induced following activation. Trends Immunol. 26:136-140. [DOI] [PubMed] [Google Scholar]
- 35.Sarkar, S., V. Teichgraber, V. Kalia, A. Polley, D. Masopust, L. E. Harrington, R. Ahmed, and E. J. Wherry. 2007. Strength of stimulus and clonal competition impact the rate of memory CD8 T cell differentiation. J. Immunol. 179:6704-6714. [DOI] [PubMed] [Google Scholar]
- 36.Slifka, M. K., J. N. Blattman, D. J. Sourdive, F. Liu, D. L. Huffman, T. Wolfe, A. Hughes, M. B. Oldstone, R. Ahmed, and M. G. Von Herrath. 2003. Preferential escape of subdominant CD8+ T cells during negative selection results in an altered antiviral T cell hierarchy. J. Immunol. 170:1231-1239. [DOI] [PubMed] [Google Scholar]
- 37.Slifka, M. K., and J. L. Whitton. 2001. Functional avidity maturation of CD8+ T cells without selection of higher affinity TCR. Nat. Immunol. 2:711-717. [DOI] [PubMed] [Google Scholar]
- 38.Surh, C. D., O. Boyman, J. F. Purton, and J. Sprent. 2006. Homeostasis of memory T cells. Immunol. Rev. 211:154-163. [DOI] [PubMed] [Google Scholar]
- 39.Tanchot, C., S. Guillaume, J. Delon, C. Bourgeois, A. Franzke, A. Sarukhan, A. Trautmann, and B. Rocha. 1998. Modifications of CD8+ T cell function during in vivo memory or tolerance induction. Immunity 8:581-590. [DOI] [PubMed] [Google Scholar]
- 40.Tanchot, C., F. A. Lemonnier, B. Perarnau, A. A. Freitas, and B. Rocha. 1997. Differential requirements for survival and proliferation of CD8 naive or memory T cells. Science 276:2057-2062. [DOI] [PubMed] [Google Scholar]
- 41.Unsoeld, H., S. Krautwald, D. Voehringer, U. Kunzendorf, and H. Pircher. 2002. Cutting edge: CCR7+ and CCR7− memory T cells do not differ in immediate effector cell function. J. Immunol. 169:638-641. [DOI] [PubMed] [Google Scholar]
- 42.Unsoeld, H., and H. Pircher. 2005. Complex memory T-cell phenotypes revealed by coexpression of CD62L and CCR7. J. Virol. 79:4510-4513. [DOI] [PMC free article] [PubMed] [Google Scholar]
- 43.Valitutti, S., S. Muller, M. Cella, E. Padovan, and A. Lanzavecchia. 1995. Serial triggering of many T-cell receptors by a few peptide-MHC complexes. Nature 375:148-151. [DOI] [PubMed] [Google Scholar]
- 44.van der Most, R. G., K. Murali-Krishna, J. G. Lanier, E. J. Wherry, M. T. Puglielli, J. N. Blattman, A. Sette, and R. Ahmed. 2003. Changing immunodominance patterns in antiviral CD8 T-cell responses after loss of epitope presentation or chronic antigenic stimulation. Virology 315:93-102. [DOI] [PubMed] [Google Scholar]
- 45.van Faassen, H., M. Saldanha, D. Gilbertson, R. Dudani, L. Krishnan, and S. Sad. 2005. Reducing the stimulation of CD8+ T cells during infection with intracellular bacteria promotes differentiation primarily into a central (CD62LhighCD44high) subset. J. Immunol. 174:5341-5350. [DOI] [PubMed] [Google Scholar]
- 46.van Stipdonk, M. J., E. E. Lemmens, and S. P. Schoenberger. 2001. Naive CTLs require a single brief period of antigenic stimulation for clonal expansion and differentiation. Nat. Immunol. 2:423-429. [DOI] [PubMed] [Google Scholar]
- 47.Veiga-Fernandes, H., U. Walter, C. Bourgeois, A. McLean, and B. Rocha. 2000. Response of naive and memory CD8+ T cells to antigen stimulation in vivo. Nat. Immunol. 1:47-53. [DOI] [PubMed] [Google Scholar]
- 48.Von Herrath, M. G., B. Coon, and M. B. Oldstone. 1997. Low-affinity cytotoxic T-lymphocytes require IFN-gamma to clear an acute viral infection. Virology 229:349-359. [DOI] [PubMed] [Google Scholar]
- 49.Wherry, E. J., J. N. Blattman, K. Murali-Krishna, R. van der Most, and R. Ahmed. 2003. Viral persistence alters CD8 T-cell immunodominance and tissue distribution and results in distinct stages of functional impairment. J. Virol. 77:4911-4927. [DOI] [PMC free article] [PubMed] [Google Scholar]
- 50.Wherry, E. J., S. J. Ha, S. M. Kaech, W. N. Haining, S. Sarkar, V. Kalia, S. Subramaniam, J. N. Blattman, D. L. Barber, and R. Ahmed. 2007. Molecular signature of CD8+ T cell exhaustion during chronic viral infection. Immunity 27:670-684. [DOI] [PubMed] [Google Scholar]
- 51.Wherry, E. J., V. Teichgraber, T. C. Becker, D. Masopust, S. M. Kaech, R. Antia, U. H. von Andrian, and R. Ahmed. 2003. Lineage relationship and protective immunity of memory CD8 T cell subsets. Nat. Immunol. 4:225-234. [DOI] [PubMed] [Google Scholar]
- 52.Whitmire, J. K., J. T. Tan, and J. L. Whitton. 2005. Interferon-gamma acts directly on CD8+ T cells to increase their abundance during virus infection. J. Exp. Med. 201:1053-1059. [DOI] [PMC free article] [PubMed] [Google Scholar]
- 53.Wirth, T. C., N. L. Pham, J. T. Harty, and V. P. Badovinac. 5 February 2009, posting date. High initial frequency of TCR-transgenic CD8 T cells alters inflammation and pathogen clearance without affecting memory T cell function. Mol. Immunol. doi: 10.1016/j.molimm.2008.12.018. [DOI] [PubMed]
- 54.Xiao, Z., M. F. Mescher, and S. C. Jameson. 2007. Detuning CD8 T cells: down-regulation of CD8 expression, tetramer binding, and response during CTL activation. J. Exp. Med. 204:2667-2677. [DOI] [PMC free article] [PubMed] [Google Scholar]
- 55.Yewdell, J. W., and J. R. Bennink. 1999. Immunodominance in major histocompatibility complex class I-restricted T lymphocyte responses. Annu. Rev. Immunol. 17:51-88. [DOI] [PubMed] [Google Scholar]
- 56.Zimmermann, C., A. Prevost-Blondel, C. Blaser, and H. Pircher. 1999. Kinetics of the response of naive and memory CD8 T cells to antigen: similarities and differences. Eur. J. Immunol. 29:284-290. [DOI] [PubMed] [Google Scholar]