Figure 1.
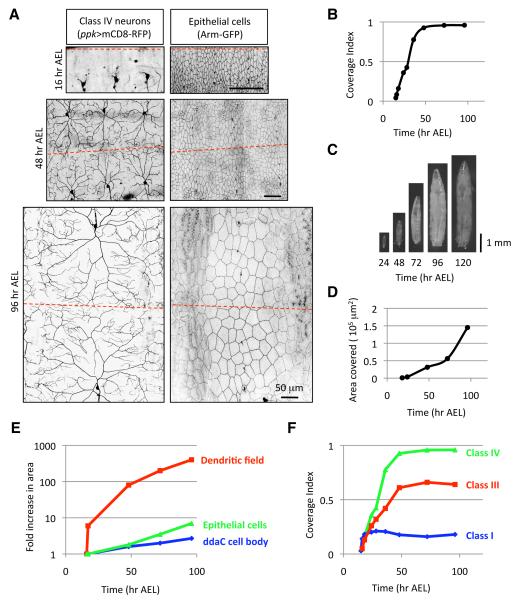
Dendrites of da neurons grow rapidly to establish receptive field coverage then grow in proportion to larval growth to maintain this coverage.
(A) Live images of class IV neurons (ppk>mCD8-RFP) and epithelial cells (Arm-GFP) at 16, 48, and 96 hr AEL. The hatched red line denotes the dorsal midline in (A) and in subsequent images. Dorsal is up, anterior is left and scale bars are 50 μm.
(B) Quantification of the coverage index of an individual ddaC class IV neuron over a developmental time course. n > 10 for each time point.
(C) Live images of Drosophila larvae over the course of larval development.
(D) Quantification of the area covered by an individual ddaC class IV neuron over a developmental time course. n > 5 for each time point.
(E) Time course showing the fold-increase in area of an individual ddaC dendritic field (red), an individual epithelial cell (green), and the ddaC cell body (blue) relative to the area of each at 16 hr AEL, shortly after dendrite outgrowth begins. n > 10 for each time point.
(F) Time course of dendrite coverage for different classes of da neurons. Class IV neurons (green) were visualized with ppk-eGFP, class III neurons (red) were visualized with ss-Gal4, UAS-mCD8-GFP (M. Kim, personal communication) and class I neurons were visualized with 2-21-Gal4, UAS-mCD8-GFP (Grueber et al., 2003a). n > 10 for each time point.

