Abstract
Conformationally constrained analogue synthesis was undertaken to aid in pharmacophore mapping and 3D QSAR analysis of nitrobenzylmercaptopurine riboside (NBMPR) congeners as equilibriative nucleoside transporter 1 (ENT1) inhibitors. In our previous study (Zhu et al., J. Med. Chem. 46, 831–837, 2003), novel regioisomeric nitro-1, 2, 3, 4-tetrahydroisoquinoline conformationally constrained analogues of NBMPR were synthesized and evaluated as ENT1 ligands. 7-NO2-1, 2, 3, 4-tetrahydroisoquino-2-yl purine riboside was identified as the analogue with the nitro group in the best orientation at the NBMPR binding site of ENT1. In the present study, further conformational constraining was introduced by synthesizing 5′-O, 8-cyclo derivatives. The flow cytometrically determined binding affinities indicated that the additional 5′-O, 8-cyclo constraining was unfavorable for binding to the ENT1 transporter. The structure-activity relationship (SAR) acquired was applied to pharmacophore mapping using the PHASE program. The best pharmacophore hypothesis obtained embodied an anti-conformation with three H-bond acceptors, one hydrophobic center, and two aromatic rings involving the 3′-OH, 4′-oxygen, the NO2 group, the benzyl phenyl and the imidazole and pyrimidine portions of the purine ring, respectively. A PHASE 3D-QSAR model derived with this pharmacophore yielded an r2 of 0.916 for four (4) PLS components, and an excellent external test set predictive r2 of 0.78 for 39 compounds. This pharmacophore was used for molecular alignment in a comparative molecular field analysis (CoMFA) 3D-QSAR study that also afforded a predictive model with external test set validation predictive r2 of 0.73. Thus, although limited, this study suggests that the bioactive conformation for NBMPR at the ENT1 transporter could be anti. The study has also suggested an ENT1 inhibitory pharmacophore, and established a predictive CoMFA 3D-QSAR model that might be useful for novel ENT1 inhibitor discovery and optimization.
Introduction
Nucleoside transport inhibitors (NTIs) have been shown to have potential therapeutic applications in heart disease, 2,3,4,5,6 inflammatory disease,7 viral infections,8,9 and cancer chemotherapy.10,11,12,13,14,15 The ENT1 transporter, which is the focus of this research, is the major nucleoside transporter in most mammalian tissues, especially heart tissue,16,17 and appears to be the most relevant NT target for therapeutic exploitation. Several chemical classes have been shown to inhibit the ENT1,18 the most potent and selective of which are NBMPR and its congeners, which inhibit it at low nanomolar to subnanomolar concentrations.19 Unfortunately, attempts at therapeutic application of current ENT1 inhibitors have been largely disappointing due to their poor pharmacological profiles with regard to toxicity, selectivity, and poor in vivo efficacy.18 Thus, there is a need for novel inhibitors.
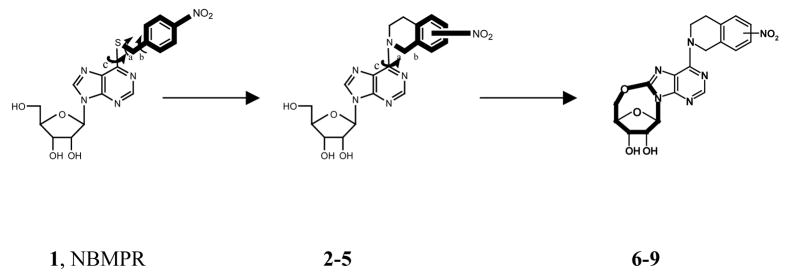
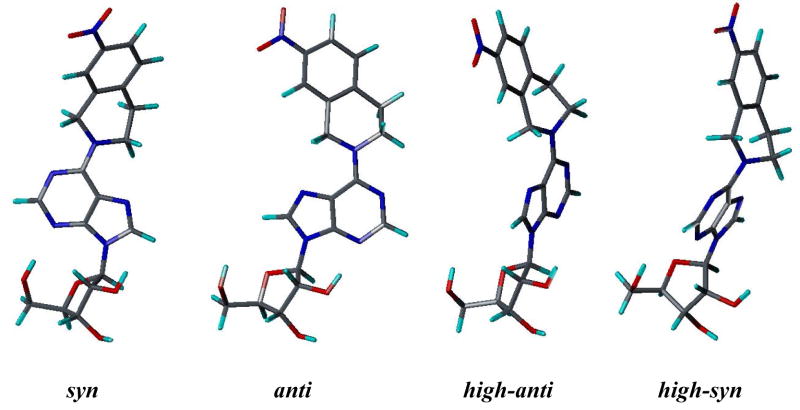
Since there are no 3D structures of mammalian nucleoside transporters nor their complexes with inhibitors, knowledge of the 3D pharmacophore of the most potent and selective inhibitors will be useful for rational design of new NT inhibitors.20 To that end, the objective of this study was to continue our probe the bioactive conformation of NBMPR and its analogues as ENT1 nucleoside transporter inhibitors through a combination of conformationally constrained analogues synthesis1, pharmacophore mapping, and 3D-QSAR modeling. Current structure-activity relationship (SAR) studies on ENT1 nucleoside transport inhibitors18 demonstrate that for NBMPR analogues, the nitrobenzyl moiety is critical for high affinity binding to the transporter. Therefore, in our previous study, a series of conformationally constrained analogues of NBMPR was synthesized by replacing the purine 6-position nitrobenzyl group with nitro-1, 2, 3, 4-tetrahydroisoquinolines, thereby locking two of the rotatable bonds in the flexible nitrobenzyl moiety into a tetrahydroisoquinoline ring. The most suitable substitution position of the nitro group was explored by varying its position on the aromatic ring of the tetrahydroisoquinoline moiety, as shown in compounds 2–5 (see Figure 1). The results indicated that compound 4 with the nitro substituent at the 7-position of tetrahydroisoquinoline ring most captures the bioactive orientation of the nitrobenzyl moiety of NBMPR.1 However, compounds 2–5, are still flexible; there are three major rotatable bonds, the N9-C1′ glycosidic bound, the C6-N6 bond, and the C4′-C5′ bond in the molecules. For NBMPR analogues and other nucleosides, the base moiety can adopt two main orientations relative to the sugar moiety about the N9-C1′ glycosidic bond, termed syn and anti.21 In the syn orientation, the bulky portion of the base, such as the pyrimidino ring in purine nucleosides or O2 in pyrimidine nucleosides, is orientated over the sugar ring; and in the anti-conformation it is oriented away from the sugar ring. The intermediate conformations between syn and anti are referred to as high-anti and high-syn, respectively (see Figure 2). These different conformations might greatly influence the binding affinities of the molecules at the transporter. In continuation of our probing of the bioactive conformation of NBMPR in this study, another series of further conformationally constrained analogues. In this series, the free rotation of the glycosidic bond was blocked by forming an O5′-C8 linkage. In doing so, the rotation about the C4′-C5′ bond was also blocked. The most suitable position of the nitro group was again explored by varying its position on the aromatic ring of the tetrahydroisoquinoline moiety, as shown in Figure 1 (compounds 6–9), where the nitro substituent is in the 5-, 6-, 7-, or 8-position of the 1, 2, 3, 4-tetrahydroisoquinoline ring, respectively. The most active NBMPR analogues including the conformationally constrained analogue, compound 4, were used to develop a common pharmacophore hypothesis using the PHASE program (Schrödinger), which was subsequently used for CoMFA 3D-QSAR modeling in attempts to validate the suggested conformation.
Figure 1.
Design of conformationally constrained analogues of NBMPR.
Figure 2.
Different conformations of Compound 4 generated by rotation of the N9-C1′ glycosidic bond.
Chemistry
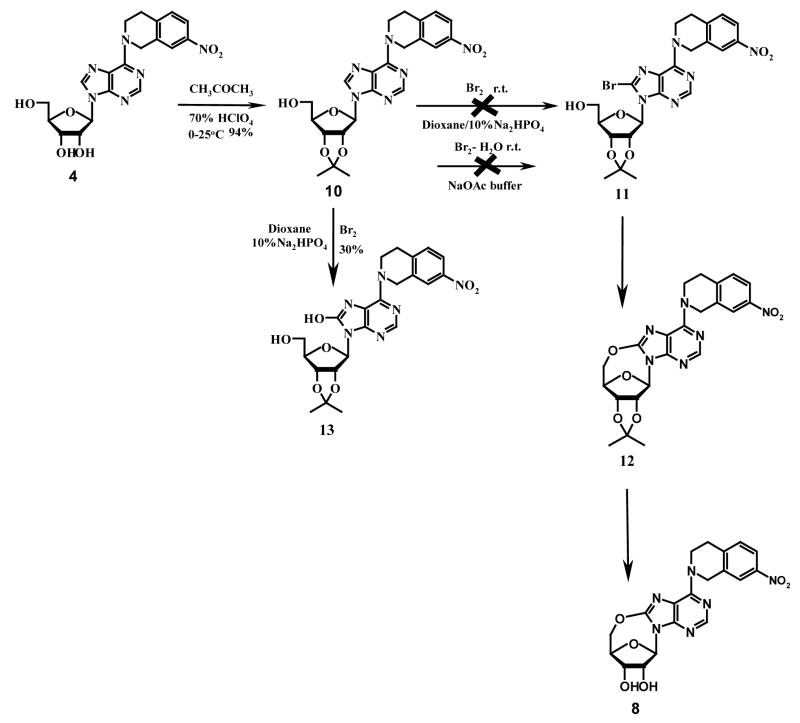
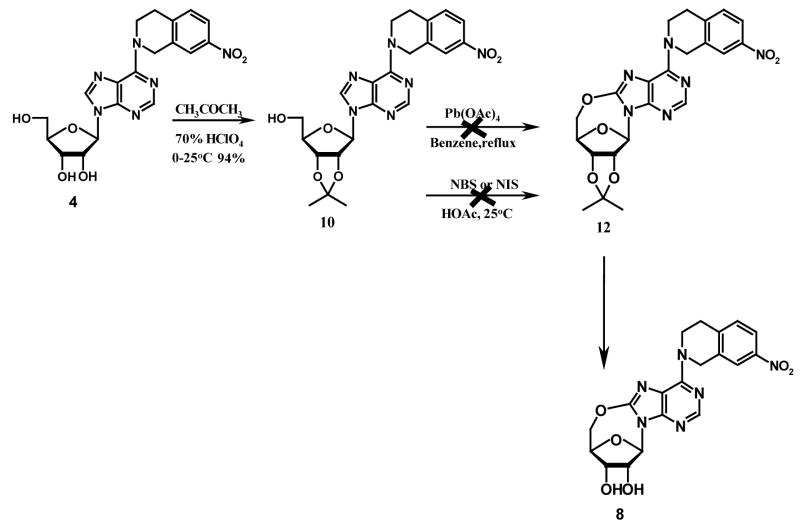
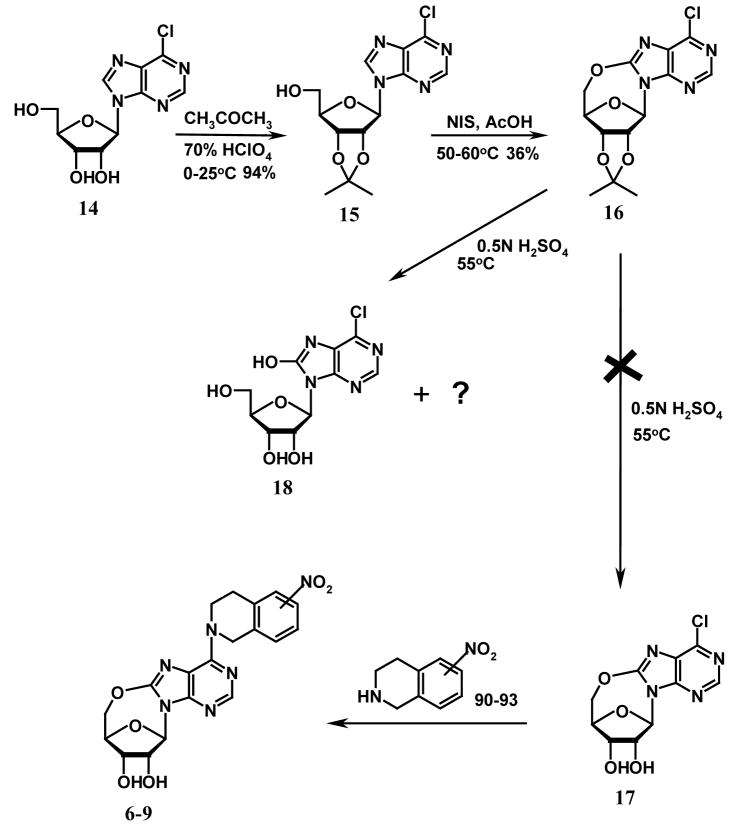
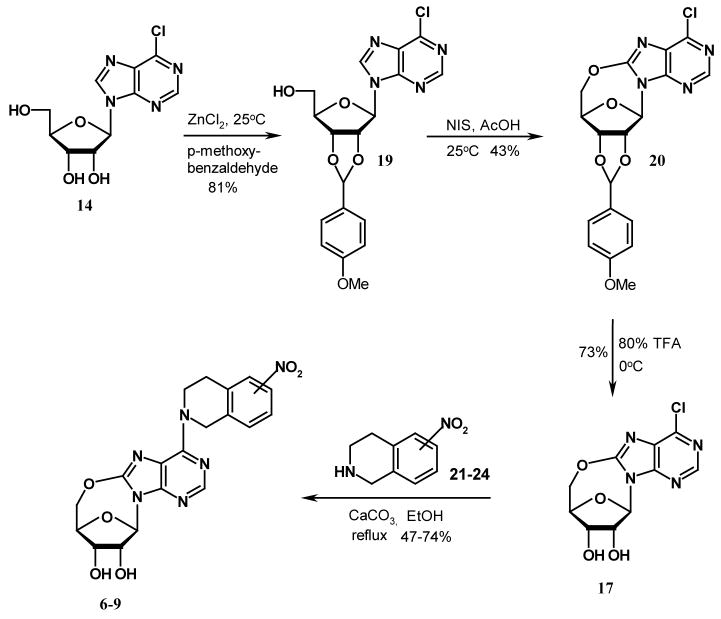
A limited number of studies have reported the intramolecular cyclization of purine nucleosides. Ikehara et al. once reported that by activating the 5′-OH group with sodium hydride in dioxane, the resulting nucleophilic –O− species would attack the electron-deficient carbon at position 8 of 8-bromo-2′, 3′-O-isopropyllideneadenosine to give 5′-O, 8-cyclo-2′, 3′-O-isoprpylideneadenosine.22 However, when we tried to follow this method to prepare compound 12 (see Scheme 1), we found we could not obtain compound 11 by bromination of compound 10 (which was prepared from compound 4) using bromine in the mixture of dioxane and 10% Na2HPO4 (1:1) or bromine water in NaOAc buffer as reported in the literature for the synthesis of 8-bromo-2′, 3′-O-isopropylideneadenosine.23,24,25 Instead, the product was identified to be compound 13 when bromine in dioxane/Na2HPO4 (1:1) was used. No products were obtained when bromine water in NaOAc buffer was used. An alternative strategy employing direct oxidative cyclization of compound 10 to yield 12, using lead tetraacetate in dry benzene or N-halosuccinimide in acetic acid as shown in Scheme 2, which has been previously used to synthesize 5′-O, 8-cycloadenosines26 and 5′-O, 8-cycloguanosines27, also failed. This led to the conclusion that the nitrotetrahydroisoquinoline substituent at the purine C6-position was hindering the 5′-O, C-8-cyclization. Therefore, some other reaction schemes with an appropriate substrate other than compound 4 were considered. As shown in Scheme 3, 6-chloropurine riboside (14), which does not have a bulky substituent at the 6-position and is commercially available, was chosen. 2′, 3′-O-isopropylidene-6-chloropurine riboside (15) was prepared by treating compound 14 with acetone in the presence of a catalytic amount of hydroperchloric acid (70%). 5′-O, 8-cyclo-2′, 3′-O-isopropylidene-6-chloropurine riboside (16) was successfully prepared by treating compound 15 with N-iodosuccinimide (NIS) in acetic acid. Unfortunately, the deprotection of the 2′, 3′-hydroxyl groups in compound 16 became another problem. When compound 16 was treated with 0.5 N H2SO4 at 55 °C for deprotection, a complicated mixture of products was obtained, with the major product being compound 18 instead of the desired compound 17. No reaction occurred when the temperature was lowered, which led to our trying several other deprotecting reagents such as 80 % CH3COOH and 80 % CF3COOH, but none was able to selectively remove the isopropylidene group without cleaving the newly formed 5′-O, C-8-cyclo bond in compound 16. Therefore, other protecting groups that can be removed under milder conditions were sought, and p-anisaldehyde was considered. The final synthetic methods are shown in Scheme 4, whereby the 2′, 3′-hydroxyl groups of compound 14 were protected with p-anisaldehyde catalyzed by zinc chloride to afford compound 19, which was then subjected to intramolecular cyclization in the presence of NIS in acetic acid at ambient temperature to obtain compound 20. The 2′,3′-O-p-anisylidene group in compound 20 was selectively removed in 80 % trifluoroacetic acid at 0 °C to give the desired compound 17 with the 5′-O, 8-cyclo bond intact. Coupling of compound 17 with compounds 21–24 in the presence of calcium chloride in refluxing ethanol afforded the target products compounds 6–9, respectively, according to methods reported in our previous study.1 The compounds were then tested as ligands of the ENT1 transporter by our reported flow cytometric method.1,30,31
Scheme 1.
Scheme 2.
Scheme 3.
Scheme 4.
Pharmacophore Mapping and 3D QSAR Studies
Materials and Methods
Data Sets
Three highly potent and selective ENT1 nucleoside transporter inhibitors, NBMPR, compounds 4, and 25 (see Figure 3), were chosen as the active compound set for generating common pharmacophore hypotheses using the PHASE 1.0 program (Schrödinger Inc. San Diego, CA). The training set used for developing 3D-QSAR models included 77 compounds and comprised a series of compounds with a high diversity in structure and a wide range of ENT1 inhibitory potencies as reported by Paul et al.,28 a series of tetrahydroisoquinoline conformationally constrained ENT1 inhibitors reported by us,1 and a series of 5′-O, 8-cyclo conformationally constrained ENT1 inhibitors, reported in this study (see Table 1). The test set included 39 compounds with biological data taken from the literature.29,30,31 All the biological data were normalized to the flow cytometrically-determined data for comparison using NBMPR as the standard since it was evaluated by both methods.
Figure 3.
Active compounds used to generate common pharmacophore hypotheses in the PHASE program.
Table 1.
Structures and inhibitory activities of compounds in the training set.
 | ||||||||||
|---|---|---|---|---|---|---|---|---|---|---|
| Compd | Type | R | R1 | R2 | R3 | R4 | X | Y | Z | pIC50 |
| 1, NBMPR | C | -S- (4-nitrobenzyl) | H | 8.07a | ||||||
| 2 | A | 5-NO2 | 5.520a | |||||||
| 3 | A | 6-NO2 | 6.740a | |||||||
| 4 | A | 7-NO2 | 8.264a | |||||||
| 5 | A | 8-NO2 | 5.440a | |||||||
| 6 | B | 5-NO2 | 2.130a | |||||||
| 7 | B | 6-NO2 | 3.610a | |||||||
| 8 | B | 7-NO2 | 6.480a | |||||||
| 9 | B | 8-NO2 | 2.76a | |||||||
| 26 | A | H | 5.740a | |||||||
| 27 | C | -S- (4-nitrobenzyl) | NH2 | 7.670b | ||||||
| 28 | C | -NH-n-amyl | H | 4.870b | ||||||
| 29 | C | -NH-benzyl | H | 4.970b | ||||||
| 30 | C | NH-2-ethoxyethyladenosine | H | 3.04b | ||||||
| 31 | C | -NH-furfuryl | H | 4.44b | ||||||
| 32 | -NH-isopropyl | H | 3.59b | |||||||
| 33 | C | -N(CH3)-(4-nitrobenzyl) | H | 6.51b | ||||||
| 34 | C | - NH- (4-nitrobenzyl) | H | 7.56b | ||||||
| 35 | C | -NH-phenyl | H | 4.49b | ||||||
| 36 | C | -NH-2-thenyl | H | 4.75b | ||||||
| 37 | C | -O-benzyl | H | 5.68b | ||||||
| 38 | C | -S-allyl | H | 4.86b | ||||||
| 39 | C | -S-benzyl | H | 5.77b | ||||||
| 40 | C | -S-cyclohexylmethyl | H | 5.81b | ||||||
| 41 | C | -S-cyclohexyl | H | 5.20b | ||||||
| 42 | C | -S-α, α-dimethylbenzyl | H | 4.67b | ||||||
| 43 | C | -S-ethyl | H | 4.24b | ||||||
| 44 | C | -S- (2-hydroxy-5-nitro-benzyl) | H | 7.48b | ||||||
| 45 | C | -S- (4-isopropylbenzyl) | H | 5.32b | ||||||
| 46 | C | -S- [(2-methyl-1-naphthyl)-methyl] | H | 3.94b | ||||||
| 47 | C | -S-methyl | H | 3.64b | ||||||
| 48 | D | -S-methyl | H | tetrahydropyran-2-yl | N | C | N | 3.56b | ||
| 49 | C | -S-phenylpropyl | H | 5.87b | ||||||
| 50 | C | -S-phenyl | H | 4.04b | ||||||
| 51 | C | -S-2-methylbenzyl | H | 5.20b | ||||||
| 52 | C | -S-3-methylbenzyl | H | 4.92b | ||||||
| 53 | C | -S-4-methylbenzyl | H | 6.34b | ||||||
| 54 | C | -S-benzyl | NH2 | 5.28b | ||||||
| 55 | C | -S- (3-bromo-benzyl) | NH2 | 5.54b | ||||||
| 56 | C | -S- (4-bromo-benzyl) | NH2 | 6.09b | ||||||
| 57 | D | -S-isopropyl | NH2 | butyl | N | C | N | 3.92b | ||
| 58 | D | -S-methyl | NH2 | butyl | N | C | N | 3.66b | ||
| 59 | D | -S- (2-pyridylmethyl) | NH2 | butyl | N | C | N | 4.28b | ||
| 60 | C | -S- butyl | NH2 | 4.92b | ||||||
| 61 | C | -S- sec-butyl | NH2 | 4.20b | ||||||
| 62 | C | -S- (2-chloro-benzyl) | NH2 | 4.87b | ||||||
| 63 | C | -S- ethyl | NH2 | 3.79b | ||||||
| 64 | C | -S- (2-fluoro-benzyl) | NH2 | 5.32b | ||||||
| 65 | C | -S- (4-fluoro-benzyl) | NH2 | 5.94b | ||||||
| 66 | C | -S- (2-hydroxy-5-nitrobenzyl) | NH2 | 8.56b | ||||||
| 67 | C | -S- iodo | NH2 | 4.09b | ||||||
| 68 | D | -S-propyl | NH2 | isobutyl | N | C | N | 4.2b | ||
| 69 | C | -S- isobutyl | NH2 | 5.06b | ||||||
| 70 | D | -S-isopropyl | NH2 | propyl | N | C | N | 3.84b | ||
| 71 | C | -S- isopropyl | NH2 | 3.72b | ||||||
| 72 | D | -S- (2-pyridylmethyl) | NH2 | 2-methylbutyl | N | C | N | 4.38b | ||
| 73 | C | -S- (1-methyl-4-nitroimidazol-5-yl) | NH2 | 3.24b | ||||||
| 74 | C | -S- (6-methyl-2-pyridylmethyl) | NH2 | 1.94b | ||||||
| 75 | C | -S- methyl | NH2 | 3.69b | ||||||
| 76 | C | -S- 2-nitrobenzyl | NH2 | 5.34b | ||||||
| 77 | C | -S- 3-nitrobenzyl | NH2 | 6.75b | ||||||
| 78 | C | -S- phenethyl | NH2 | 4.79b | ||||||
| 79 | D | -S- (2-pyridylmethyl) | NH2 | propyl | N | C | N | 4.04b | ||
| 80 | C | -S- propyl | NH2 | 4.49b | ||||||
| 81 | C | -S- (2-pyridyl-methyl) | NH2 | 4.46b | ||||||
| 82 | C | -S- (3-pyridyl-methyl) | NH2 | 4.83b | ||||||
| 83 | C | -S- (2-acetophenone) | NH2 | 3.35b | ||||||
| 84 | C | -S- (4′-chloro-2-acetophenone) | NH2 | 4.84b | ||||||
| 85 | D | -NH- isopentyl | H | H | H | C | N | N | 3.63b | |
| 86 | D | -NH- phenethyl | H | H | H | C | N | N | 4.00b | |
| 87 | D | -NH2 | H | -β-D-ribofuranosyl | I | C | C | N | 3.64b | |
| 88 | D | -S- benzyl | H | -β-D-ribofuranosyl | H | C | C | N | 5.28b | |
| 89 | D | -S- methyl | H | -β-D-ribofuranosyl | Br | C | C | N | 3.94b | |
| 90 | D | -chloro | H | -β-D-ribofuranosyl | I | C | C | N | 4.11b | |
| 91 | D | -methoxy | H | -β-D-ribofuranosyl | H | C | C | N | 3.47b | |
| 92 | D | -piperidino | H | -β-D-ribofuranosyl | H | C | C | N | 3.71b | |
| 93 | D | -SH | H | -β-D-ribofuranosyl | H | C | C | N | 3.41b | |
Molecular Modeling
Three-dimensional structure building, pharmacophore mapping and CoMFA 3D-QSAR studies were carried out on a Silicon Graphics Octane (R12000) workstation with the IRIX 6.5 operating system running the SYBYL program package, version 7.2 (Tripos Associates, St. Louis, MO) and the PHASE 1.0 program (Shrodinger Inc., San Diego). Molecular energy minimizations were performed using the Tripos force field with a distance-dependent dielectric constant and the Powell conjugate gradient algorithm with an energy change convergence criterion of 0.001 kcal/mol Å. Partial atomic charges were calculated using the Gaisteiger-Huckel program in SYBYL. All the molecules in the present study were aligned to the best-generated pharmacophore hypothesis (Pharm_A) obtained from the PHASE pharmacophore mapping exercise.
Generation of Pharmacophore Models
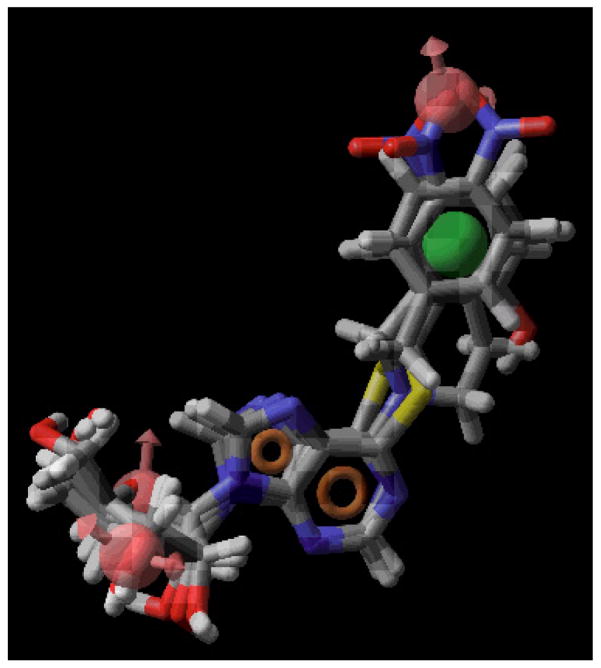
PHASE 1.0 implemented in the Maestro 7.0 modeling package (Schrödinger Inc. San Diego, CA) was used to generate pharmacophore models for ENT1 inhibitors. The 3D structures of all the molecules used in PHASE were built in, and imported from SYBYL. Conformers of each molecule were generated using the MMFFs forcefield in the PHASE program. Pharmacophore feature sites for the molecules were assigned using a set of features defined in PHASE as: hydrogen bond acceptor (A), hydrogen bond donor (D), hydrophobic group (H), negatively charged group (N), positively charged group (P), and aromatic ring (R). Three highly active compounds, NBMPR, compounds 4, and 25 were selected for generating the pharmacophore hypotheses (see Figure 3). Common pharmacophore hypotheses were identified using conformational analysis and a tree-based partitioning technique. The resulting pharmacophores were then scored and ranked. Pharmacophores with high-ranking scores were validated by a partial least square (PLS) regression-based PHASE 3D-QSAR cross validation, and the best pharmacophore hypothesis identified was further validated by CoMFA 3D-QSAR modeling. All the molecules used for QSAR studies were aligned to the pharmacophore hypothesis obtained in PHASE (see Figure 5).
Figure 5.
The best-generated pharmacophore model (Pharm_A) obtained from PHASE. Pharmacophore features are red vectors for hydrogen bond acceptors (A), orange rings for aromatic groups (R), and green balls for hydrophobic functions (H). NBMPR, compound 4, and compound 25 were aligned to the pharmacophore. For the molecules, blue indicates nitrogen, red indicates oxygen, yellow refers to sulfur, gray indicates carbon, and white indicates hydrogen.
Development of a CoMFA 3D QSAR Model
The PHASE-generated 3D pharmacophore was used as the alignment template for the CoMFA 3D-QSAR model. CoMFA descriptors were calculated using a sp3 hybridized carbon probe atom with a van der Waals radius of 1.52 Å and a charge of +1.0 on a 2 or 1 Å spaced 3D cubic lattice with an extension of 4 Å units in all directions to encompass the aligned molecules. Steric (Lennard-Jones 6–12 potential) field energies and electrostatic (Coulombic potential) fields at each lattice point were generated and scaled by the CoMFA-STD method in SYBYL. The SYBYL default energy cut-off of 30 kcal/mol was used to ensure that there would be no extreme energy terms to distort the CoMFA models.
In deriving CoMFA 3D-QSAR models PLS regression analysis was used to correlate the CoMFA descriptors with biological activities. The CoMFA descriptors were used as independent variables, and biological activities (pIC50 values) were used as dependent variables. The predictive value of the models was evaluated first by leave-one-out (LOO) cross-validation. The cross-validated coefficient, q2, was calculated using Eq.1 as follows:
| Eq. 1 |
where Ypredicted, Yobserved, and Ymean are the predicted, observed, and mean values of the target property (pIC50), respectively. Σ(Ypredicted − Yobserved)2 is the predictive error sum of squares (PRESS). The number of components corresponding to the lowest PRESS value was selected for deriving the final PLS regression models to minimize the tendency to overfit the data. In addition to the q2, the number of components, the conventional correlation coefficient r2 and its standard error s were also computed. CoMFA coefficient maps were generated by interpolation of the pair-wise products between the PLS coefficients and the standard deviations of the corresponding CoMFA descriptor values. Robustness of the CoMFA models was checked by group cross validation and randomization of activity values (Table 8).
Table 8.
Results of group cross-validation and randomization exercise for the CoMFA 3D-QSAR model.
| Exercise | PLS Statistics | CoMFA |
|---|---|---|
| Group validation (20 runs) | Average q2 (STDEV) | 0.572 (0.032) |
| Randomization (20 runs) | Rand q2 | 0.0005 |
Results and Discussion
ENT1 inhibitory activity of novel 5′-O, 8-linkage constrained nitrotetrahydroisoquinoline NBMPR analogues
The solid-state conformation of NBMPR has been determined by X-ray diffraction,32 and a solution conformation has been proposed using NMR.33 The X-ray structure reveals the preponderance of a syn orientation of the purine ring relative to the sugar moiety, whereas the NMR structure reveals a high-anti orientation. However, the orientation about the glycosidic bond in the bioactive conformation remains unknown. The objective of this study was to probe the bioactive orientation of the purine ring relative to the sugar moiety about the glycosidic linkage in NBMPR and its analogues when bound to the ENT1 nucleoside transporter.
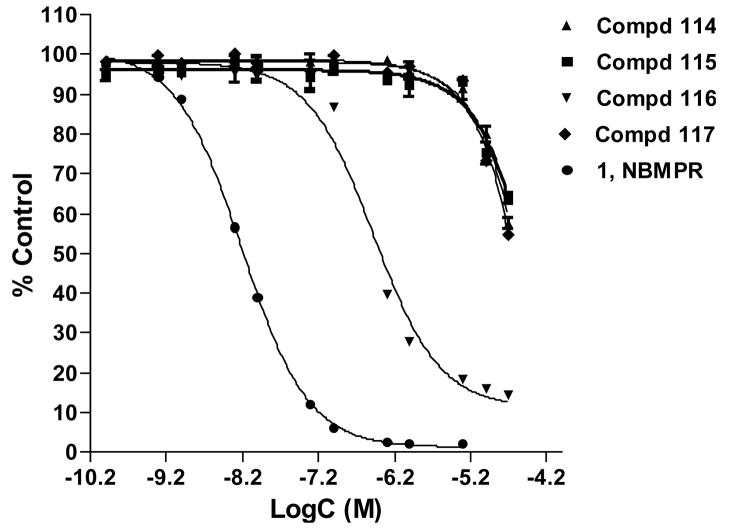
The new constrained analogues of NBMPR, compounds 6–9, in which the 5′-O, 8-linkage blocks the rotation about both the glycosidic bond and C4′-C5′ bond, were synthesized as detailed in the chemistry section and evaluated as ENT1 transporter ligands by a flow cytometric binding assay using the K562 chronic myelogenous leukemia cell line as previously described.1 The concentration-dependent inhibitory curves are depicted in Figure 4 and Ki values are presented in Table 3. These analogues exhibited a broad range of binding affinities at the ENT1 nucleoside transporter. Three of them, compounds 6, 7 and 9 exhibited low binding affinities, with Ki values in the micromolar range, whereas compound 8, the cyclonucleoside analogue corresponding to compound 4, the most tightly bound compound of the previous tetrahydrisquinoline series1, bound tightly to the transporter with a nanomolar Ki value of approximately 19 nM. The differences emphasize the remarkable regioselectivity of ENT1 among these tetrahydroisoquinoline NBMPR analogues with respect to the NO2 substituent.28,34 Compared to their less constrained counterparts compounds 2–5, the binding affinities of compounds 6–9 were significantly lower (see Table 4, Ki values increased from the nanomolar range to the micromolar range except for compound 8). These results are interesting since compounds 6–9 were obtained by just forming a 5′-O, 8-linkage to block the free rotation of the N9-C1′ glycosidic bond in compounds 2–5, respectively. The significant loss in binding affinities in going from compounds 2–5 to compounds 6–9 indicates that not only is the NBMPR binding site regioselective with respect to the nitro substituent, but it is also is very sensitive to the orientation of the purine ring about the glycosidic linkage. The 5′-O, 8-cyclo analogues appear not to present a favorable conformation for binding to ENT1, supposing other factors are not in play. However, the fact that compound 8 still exhibited good binding affinity at the transporter implies that the conformation of compound 8 does not deviate too far from the binding mode of NBMPR. These results shed more light on the bioactive conformation of NBMPR. On the other hand, it might be that moving C5′ and O5′ up to join with C8 creates unfavorable interactions at the transporter that were absent in the non-cyclo compounds 2–5, where the O5′ is in a free hydroxyl group (5′-OH) which could participate in both H-bond donor and acceptor interactions. Previous studies, however, suggest that H-bond interactions do not appear to be critical at the 5′-postion,29, 35 and thus it might be the loss of flexibility (lower entropy) imposed by cyclization that accounts for the low activity.
Figure 4.
Equilibrium displacement of SAENTA-fluorescein by compounds 6–9, the 5′-O, 8-cyclo highly conformationally constrained analogues of NBMPR, in K562 cells.
Table 3.
Flow cytometrically-determined Ki values of 5′-O, 8-cyclo compounds.
| 5′-O, 8-cyclo series | Ki (nM) |
|---|---|
| 6 | > 1000 |
| 7 | > 1000 |
| 8 | 18.89 |
| 9 | > 1000 |
| NBMPRa | 0.70 |
NBMPR was added as a standard.
Table 4.
Comparison of the Ki values of the two series of conformationally constrained analogues of NBMPRa.
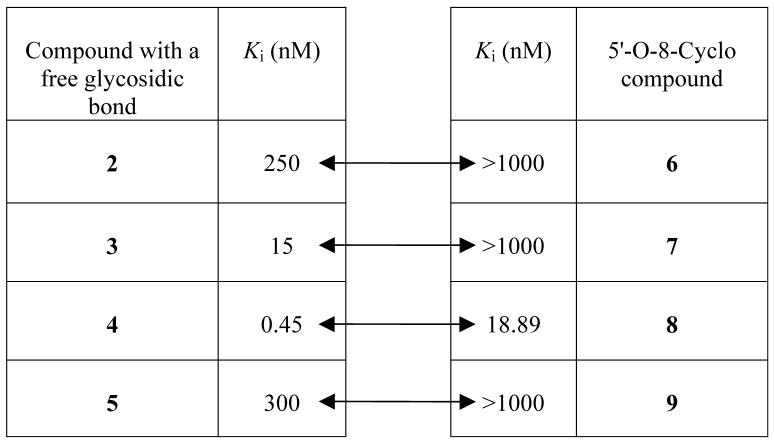 |
Two-way arrows are showing corresponding Ki values
We continued to carry out pharmacophore mapping and 3D QSAR studies to explore the possible bioactive conformation(s). Pharmacophore modeling is used to propose the 3D spatial arrangement of chemical features that are essential for biological activity of molecules with respect to a biological target. Three-dimensional quantitative structure-activity relationship (3D QSAR) techniques such as comparative molecular field analysis (CoMFA),36 have been successfully applied in many aspects regarding drug design and discovery.37 The CoMFA technique uses both statistical techniques and molecular graphics to determine correlations between structural properties of molecules and their biological activity. The bioactive conformation of each molecule is chosen and superimposed in a manner supposed to be the interacting mode with the target receptor. The steric and electrostatic fields around the molecules are then correlated with biological activity. The potent ENT1 inhibitors, NBMPR, compound 4, and compound 25 (see Figure 3) were used for pharmacophore generation with the PHASE program (Schrodinger). The inclusion of compound 4, which is a very potent constrained analogue of NBMPR, markedly reduced the conformational space that the program had to sample, thereby cutting down on analysis time and reducing the number of potential pharmacophore hypothesis to be evaluated. This is a significant advantage over using only flexible NBMPR analogues. The top five ranking pharmacophore hypotheses generated were validated by PHASE 3D-QSAR analysis involving a test set validation. The resulting best pharmacophore model from that analysis was further validated by CoMFA 3D-QSAR modeling.
For CoMFA 3D-QSAR modeling, an alignment rule for superposition of the 3D structures of the molecules in a “bioactive” conformation is required. In the absence of a crystal structure of the target or a complex of target and ligands, a pharmacophore-based alignment rule is the accepted norm. Thus we employed the PHASE pharmacophore hypothesis generation and validation to obtain an alignment template for the compounds. All the features defined in PHASE: hydrogen bond acceptor (A), hydrogen bond donor (D), hydrophobic group (H), negatively charged group (N), positively charged group (P), and an aromatic ring (A) were considered for the pharmacophore generation. All the novel conformationally constrained analogues of NBMPR synthesized in our previous study1 and this study, were included in the training set. All the 77 compounds shown in Table 1 were used to develop the PHASE 3D-QSAR models. All the 39 compounds in Table 2 were used as an external test set for PHASE 3D-QSAR model validations for predictive ability. The top five ranking pharmacophore hypotheses and their feature compositions are shown in Table 5. The PLS results of the five PHASE 3D-QSAR models developed from them and the corresponding prediction results of test set data are listed in Table 6.
Table 2.
Structures and inhibitory activities of compounds in the test set.
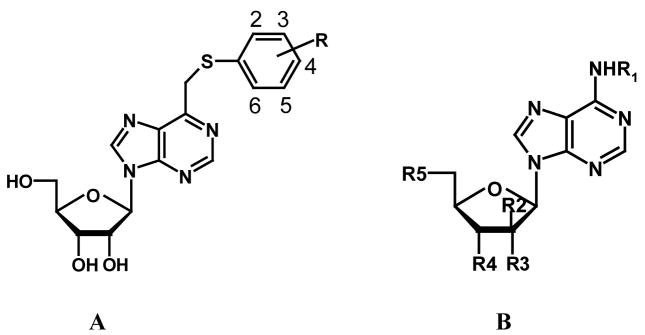 | ||||||||
|---|---|---|---|---|---|---|---|---|
| Compd | Type | R | R1 | R2 | R3 | R4 | R5 | pIC50 |
| 94 | A | 2,4,6-trimethyl | 4.48b | |||||
| 95 | A | 2,4-dichloro | 7.11b | |||||
| 96 | A | 2-Br | 5.62a | |||||
| 97 | A | 2-Cl-6-F | 5.82b | |||||
| 98 | A | 2-Cl | 5.75a | |||||
| 99 | A | 2-F | 6.45a | |||||
| 100 | A | 2-I | 6.55a | |||||
| 101 | A | 3,4-dichloro | 6.65b | |||||
| 102 | A | 3-Br | 6.44a | |||||
| 103 | A | 3-CF3 | 6.48b | |||||
| 104 | A | 3-Cl | 6.55a | |||||
| 105 | A | 3-F | 6.70a | |||||
| 106 | A | 3-I | 6.61a | |||||
| 107 | A | 3-NO2 | 8.32b | |||||
| 108 | A | 4-Br | 6.75a | |||||
| 109 | A | 4-CN | 7.09b | |||||
| 110 | A | 4-COOCH3 | 6.09b | |||||
| 111 | A | 4-Cl | 6.60a | |||||
| 112 | A | 4-F | 6.80a | |||||
| 113 | A | 4-I | 7.16a | |||||
| 114 | A | 4-OCF3 | 6.91b | |||||
| 115 | A | 4-OCH3 | 6.21b | |||||
| 116 | A | 4-t-butyl | 3.48b | |||||
| 117 | B | 4-nitrobenzyl | OH | H | OH | OH | 7.50c | |
| 118 | B | 2-CH3-3-NO2 benzyl | H | OH | OH | OH | 6.37c | |
| 119 | B | 2-Cl-4-NO2 benzyl | H | OH | OH | OH | 6.46c | |
| 120 | B | 4-NO2benzyl | H | H | OH | OH | 7.80c | |
| 121 | B | 2-NO2-4-Cl benzyl | H | OH | OH | OH | 4.33c | |
| 122 | B | 2-NO2-5-CH3 benzyl | H | OH | OH | OH | 5.89c | |
| 123 | B | 3-CH3-4-NO2 benzyl | H | OH | OH | OH | 7.06c | |
| 124 | B | 4-NO2benzyl | H | OH | H | OH | 6.01c | |
| 125 | B | 3-NO2-4-CH3 benzyl | H | OH | OH | OH | 5.93c | |
| 126 | B | 3-NO2-4-Cl benzyl | H | OH | OH | OH | 6.15c | |
| 127 | B | 3-OCH3 benzyl | H | OH | OH | OH | 3.94c | |
| 128 | B | 4-acetamido benzyl | H | OH | OH | OH | 6.74c | |
| 129 | B | 4-Cl acetamido benzyl | H | OH | OH | OH | 6.23c | |
| 130 | B | 4-NH2benzyl | H | OH | OH | OH | 5.38c | |
| 131 | B | 4-NO2benzyl | H | OH | OH | Cl | 6.97c | |
| 132 | B | 4-NO2benzyl | H | OH | OH | H | 7.66c | |
Table 5.
The top five ranking pharmacophore hypotheses generated using PHASE.a
| Pharmacophore | Pharm_A | Pharm_B | Pharm_C | Pharm_D | Pharm_E |
|---|---|---|---|---|---|
| Ranking | 1 | 2 | 3 | 4 | 5 |
| Features | AAAHRR | AAAHRR | AADHRR | AAAHRRR | AADHRR |
| Conformation of aligned molecules | anti | anti | anti | anti | anti |
The features defined in PHASE include: hydrogen bond acceptor (A), hydrogen bond donor (D), hydrophobic group (H), negatively charged group (N), positively charged group (P), and aromatic ring (R).
Table 6.
PLS statistics of PHASE 3D QSAR models and prediction of test set.
| Pharmacophore | Pharm_A | Pharm_B | Pharm_C | Pharm_D | Pharm_E |
|---|---|---|---|---|---|
| PLS Statistics of QSAR model | |||||
| r2 | 0.916 | 0.886 | 0.901 | 0.923 | 0.929 |
| SD | 0.405 | 0.472 | 0.437 | 0.388 | 0.372 |
| F | 193.956 | 137.93 | 164.534 | 213.297 | 233.308 |
| P | 2.034e-37 | 1.081e-32 | 2.022e-35 | 9.200e-39 | 4.852e-40 |
| PLS Components Results of test set | 4 | 4 | 4 | 4 | 4 |
| Predictive r2 for the external test set | 0.777 | −0.006 | 0.125 | −0.184 | −0.742 |
All the top five pharmacophore models comprised six features (see Table 5). Pharm_A, Pharm_B and Pharm_D consisted of three hydrogen bond acceptors, one hydrophobic group, and two aromatic rings. Pharm_C and Pharm_E are composed of two hydrogen bond acceptors, one hydrogen bond donor, one hydrophobic group and two aromatic rings. All the five top pharmacophores considered had an anti-conformation. These pharmacophore hypotheses afforded PHASE 3D-QSAR models with good PLS statistics results (especially with regard to conventional r2). However, only one of them, Pharm_A, performed excellently on prediction of the external test set (see Table 6). The Pharm_A pharmacophore produced a PHASE 3D-QSAR model with r2 of 0.916, four (4) PLS components, and an excellent external test set predictive r2 of 0.777. The large value of F indicates a statistically significant regression model, which is supported by the small value of the variance ratio (P), an indication of a high degree of confidence (PHASE user manual). This pharmacophore was chosen for further QSAR analysis. Figure 5 shows Pharm_A mapped onto the structures of NBMPR, compound 4 and compound 25. The three hydrogen bond acceptor features mapped onto the 3′-OH, the ribose ring oxygen, and the nitro group. The 3′-OH has been identified as an important structural feature for interaction with nucleoside transporters.18,38,39,40 The hydrophobic function is mapped onto the N6-benzyl ring, and the two aromatic groups are mapped onto the purine system. The importance of hydrophobicity of the purine 6-position substituent was highlighted in the study of Paul et al.28
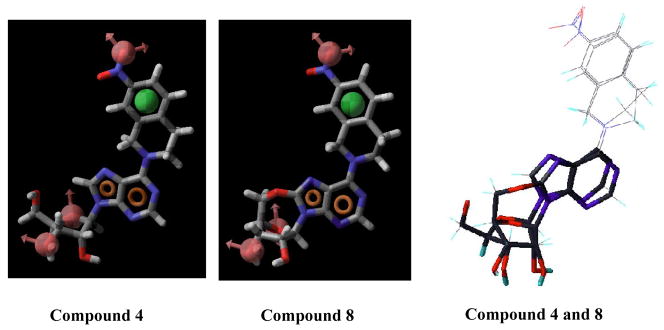
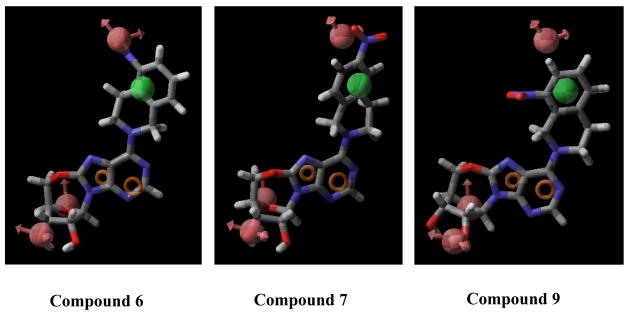
Compound 4 adopts an anti conformation, whereas compound 8 adopts a high-anti conformation due to the restriction imposed by the 5′-O, 8-linkage (see Figure 6). However, such a conformational shift is not large enough to prohibit compound 8 from mapping onto all the chemical features encoded in the pharmacophore, which is consistant with the results obtained from the flow cytometric assay showing that compound 8 was able to bind well to the ENT1 transporter with a Ki values in the nanomolar range (Ki = 18.89 nM, see Table 3). Figure 7 shows that compounds 6, 7, and 9 are only partly mapped onto the pharmacophore with two or more encoded features being unmatched, which is consistent with the biological results as well (Ki values of compounds 6, 7, and 9 are all in the micromolar range, see Table 3). These findings suggest that the anti-conformation might be the optimal conformation for NBMPR and its analogues in binding to ENT1. Other factors may also contribute or be responsible for the low activity of these compounds such as unfavorable interactions of the region around the C8-O5′ cyclic linkage. The reduced flexibility (lower entropy), possible atom bumping (unfavorable van der Waals), charge and/or hydrophobic/hydrophilic mismatch could also be the cause of the observed low binding affinity.
Figure 6.
Pharmacophore feature mapping onto compounds 4 and 8 and their conformational comparison. Pharmacophore features are red vectors for hydrogen bond acceptors (A), orange rings for aromatic groups (R), and green balls for hydrophobic functions (H). NBMPR, compound 4, and compound 25 were aligned to the pharmacophore. Molecules are blue for nitrogen, red for oxygen, yellow for sulfur, gray for carbon, and white for hydrogen.
Figure 7.
Pharmacophore feature mapping onto compounds 6, 7, and 9. Pharmacophore features are red vectors for hydrogen bond acceptors (A), orange rings for aromatic groups (R), and green balls for hydrophobic functions (H). NBMPR, Compound 4, and Compound 25 were aligned to the pharmacophore. For the molecules, blue indicates nitrogen, red indicates oxygen, yellow refers to sulfur, gray indicates carbon, and white indicates hydrogen.
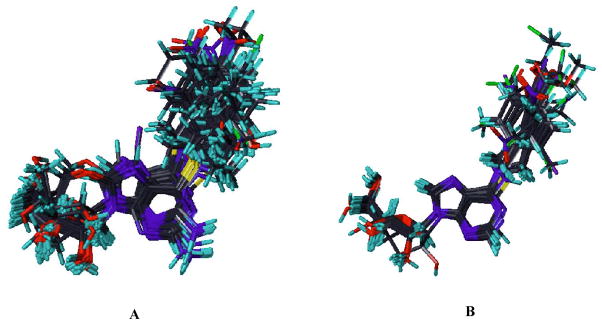
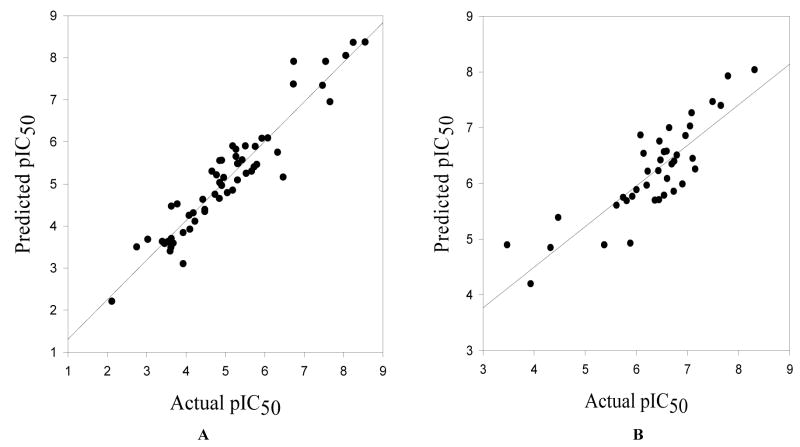
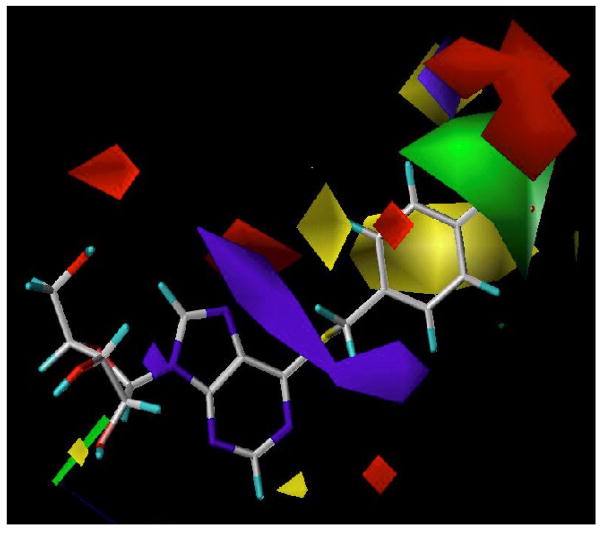
To further validate the Pharm_A pharmacophore hypothesis, a Pharm_A-dependent alignment of the training and test set compounds was exported to the SYBYL program and used for CoMFA 3D-QSAR modeling. The high sensitivity of CoMFA to molecular alignment led to elimination of compounds as outliers. All the conformationally constrained analogues of NBMPR, that we have synthesized, compounds 2–5,1 compound 26, and compounds 6–9 were accommodated in the training set (see Fig. 8 for the alignments of training set and test set compounds used for the CoMFA 3D-QSAR derivation. The CoMFA model was developed with 57 compounds in the training set and afforded an r2 of 0.894 and q2 value of 0.591 (PLS statistics results of CoMFA model are shown in Table 7). To make sure that these results were not obtained by chance, PLS runs with scrambled (randomized) pIC50 values and group cross validations were performed (see Table 8). In the randomization control exercise, the majority of the analyses afforded very poor q2 values, indicating that the CoMFA model generated with the actual data did not arise fortuitously. The deviations in the q2 values resulting from the group cross-validations were minimal, suggesting the model is robust. The model was further validated by using it to predict the ENT1 inhibitory activities of an external test set of 39 compounds, and it showed a strong predictive ability, with a predictive r2 of 0.73 (see Figure 9). Residuals of the predictions of the test set by the CoMFA 3D-QSAR model are shown in Table 9. The PLS coefficient contour maps depict regions around the molecules in 3D space where changes in physicochemical features increase or decrease potency as predicted (see Figure 10). The green colored areas denote regions that prefer sterically bulky groups in the CoMFA model, whereas yellow colored regions are sterically restricted. The blue contours indicate regions that favor electropositive substituents, whereas red contours mark regions favoring electronegative groups. As shown in Figure 10, a red region near the nitro group of NBMPR shows that an electronegative substituent at this site increases potency. This is consistent with the pharmacophore hypothesis (Pharm_A) in which the nitro group at this position is an H-bonding acceptor, and SAR studies that show high potencies for NBMPR, 27, and 34 compared to their respective counterparts without nitro substitution, compounds 39, 54, and 29 (see Table 1). The green contour near the para position of the 6-benzyl ring indicates that generally a sterically bulky substituent is favored at this site; however, a yellow region is on the other side of the 6-benzyl group indicating that there is a limit as to the degree of bulkiness of the substituent at this region. The yellow contour near the ortho position of 6-benzyl group shows that the steric bulk around this region is disfavored. The blue contour near the purine ring shows that an electron deficient system is favored at this site. The pharmacophore map (Figs. 5 and 6) and CoMFA contour maps (Fig. 10) complement each other with the former appearing to capture more specific features than the latter. The results obtained from the CoMFA study further validated the Pharm_A hypothesis, suggesting that the anti conformation might be a possible bioactive conformation of NBMPR and its analogues.
Figure 8.
Superimposition of training set (A) and test set (B) aligned to the pharmacophore model, Pharm_A, imported from PHASE.
Table 7.
PLS statistics of CoMFA 3D QSAR model.
| PLS Statistics | CoMFA |
|---|---|
| q2 | 0.591 |
| r2 | 0.894 |
| s | 0.472 |
| F | 188.072 |
| PLS Components | 5 |
| Contribution | |
| steric | 0.373 |
| electrostatic | 0.627 |
Figure 9.
Curves for training set (A) and test set (B) activity predictions by the CoMFA 3D QSAR model.
Table 9.
Residuals of the predictions of the test set by the CoMFA 3D QSAR model.
| Compd | Actual pIC50 | Residual | Compd | Actual pIC50 | Residual |
|---|---|---|---|---|---|
| 94 | 4.48 | −0.9 | 114 | 6.91 | 0.93 |
| 95 | 7.11 | 0.67 | 115 | 6.21 | 0.25 |
| 96 | 5.62 | 0.02 | 116 | 3.480 | −1.41 |
| 97 | 5.82 | 0.14 | 117 | 7.50 | 0.04 |
| 98 | 5.75 | 0.01 | 118 | 6.37 | 0.68 |
| 99 | 6.45 | 0.75 | 119 | 6.46 | −0.29 |
| 100 | 6.55 | 0.77 | 120 | 7.80 | −0.12 |
| 101 | 6.65 | −0.34 | 121 | 4.33 | −0.51 |
| 102 | 6.44 | 0.22 | 122 | 5.89 | 0.97 |
| 103 | 6.48 | 0.06 | 123 | 7.06 | 0.04 |
| 104 | 6.55 | −0.01 | 124 | 6.01 | 0.13 |
| 105 | 6.70 | 0.36 | 125 | 5.93 | 0.17 |
| 106 | 6.61 | 0.53 | 126 | 6.15 | −0.38 |
| 107 | 8.32 | 0.29 | 127 | 3.94 | −0.25 |
| 108 | 6.75 | 0.36 | 128 | 6.74 | 0.89 |
| 109 | 7.09 | −0.17 | 129 | 6.23 | 0.02 |
| 110 | 6.09 | −0.77 | 130 | 5.38 | 0.49 |
| 111 | 6.60 | 0.03 | 131 | 6.97 | 0.12 |
| 112 | 6.80 | 0.3 | 132 | 7.66 | 0.27 |
| 113 | 7.16 | 0.91 |
Figure 10.
PLS coefficient*stdev steric and electrostatic contour maps of CoMFA 3D QSAR model. Red, negative electrostatic potential enhances potency; blue, positive electrostatic potential favors activity; green, bulky substituents enhance potency; yellow, bulky substituents are unfavorable to activity.
Conclusion
In our continuing efforts to probe the bioactive conformation of NBMPR and its analogues at the ENT1 transporter, we carried out the synthesis and flow cytometric evaluation of new, more conformationally constrained analogues, combined them with our previous synthesized constrained analogues, as well as a diverse literature reported NBMPR congeners to derive a 3D pharmacophore model development of a bioactive conformation. CoMFA 3D-QSAR modeling was utilized in validation of this pharmacophore, which consists of three hydrogen bond acceptors, one hydrophobic group, and two aromatic rings, generated using the PHASE program. The use of a substantial number of compounds in both the training and the external test sets in the validation process, leads us to believe that the anti conformation indicated by this pharmacophore model, is a possible bioactive conformation of NBMPR at the ENT1 nucleoside transporter. This remains to be tested by experimental structural biology studies. The established CoMFA 3D-QSAR model of high predictive ability and robustness should be useful for the design and optimization and of new ENT1 inhibitors.
Experimental Section
Chemistry
Thin-layer chromatography (TLC) was conducted on silica gel F254 plates (Analtech). Compounds were visualized by UV light or 5 % H2SO4 in EtOH spraying reagent. 1H, 13C spectra were recorded on Bruker ARX (300 MHz) instruments, using CDCl3, CD3OD, (CD3)2SO or CD3COCD3 as solvents and tetramethylsilane (TMS) as internal standard. Column chromatography was performed on Fisher silica gel (170–400 mesh). Melting points were determined using a Fisher-Johns Melting Point Apparatus and are reported uncorrected. Mass spectra were obtained on a Bruker-HP Esquire-LC mass spectrometer, and IR spectra in KBr with a Perkin Elmer (System 2000 FT-IR) spectrometer. All solvents and reagents were bought from Aldrich and used without further purification except drying when necessary. Purity of Compounds 7, 8, and 9 was checked with a Hewlett-Packard 1100 HPLC apparatus equipped with a Platinum EPS 100A 5μ C18 analytical column (150 × 4.6 mm, Phenomenex, Torrance, CA) in a linear gradient solvent system, H2O/CH3CN from 100/0 to 20/80 in 30 min; the flow rate was 1 ml/min. Peaks were detected by UV absorption with a diode array detector.
General Method for the Preparation of Compounds 6, 7, 8, and 9
A mixture of 5′-O, 8-cyclo-6-chloropurine riboside (17, 100 mg, 0.35 mmol), Mono- (5, 6, 7, or 8)-NO2-1, 2, 3, 4-tetrahydroisoquinoline (21, 22, 23, or 24, 157 mg, 0.88 mmol), and calcium carbonate (70 mg, 0.7 mmol) in ethanol (5 ml) was stirred under refluxing for 15 h. The reaction mixture was filtered, and the filtrate was evaporated in vacuo at 40 °C. The residue was purified by flash silica gel chromatography followed by recrystallization from Methanol.
6-{[Mono- (5″, 6″, 7″, or 8″)-NO2-] 1, 2, 3, 4-tetrahydroisoquino-2-yl}-5′-O, 8-cyclo-purine riboside (6–9)
Compound 6: yield 74 %; mp 250–252°C; MS m/z 427(M+ + H); 1H NMR (300MHz, (CD3)2SO), δ 8.29 (1H, s, H-2), 7.87 (1H, d, J = 8.1 Hz, H-6″); 7.67 (1H, d, J = 7.5 Hz, H-8″), 7.48 (1H, t, J = 7.8 Hz, H-7″), 6.04 (1H, s, H-1′), 5.63 (1H, d, J = 6.6, OH-2′, disappears on D2O exchange), 5.36 (1H, d, J = 5.4 Hz, OH-3′, disappears on D2O exchange), 5.32 (2H, br s, H-1″), 4.63 (1H, d, J = 2.1, H-2′); 4.58 (1H, br d, H-5′A), 4.45 (1H, t, J = 5.4 Hz, H-3′); 4.36 (2H, br s, H-3″); 4.25 (1H, t, J = 6.6, H-5′B); 4.13 (1H, d, J = 12.6 Hz, H-4′); 3.10 (2H, t, J = 5.7 Hz, H-4″). Anal. Calcd. For C19H18N6O6 (426.39): C, 53.52%; H, 4.26%; N, 19.71%. Found: C, 53.18 %; H, 4.24 %; N, 19.31 %.
Compound 7: yield 74 %; mp 179–180 °C; MS m/z 427(M+ + H); 1H NMR (300MHz, (CD3)2SO), δ 8.29 (1H, s, H-2), 8.09 (1H, s, H-5″); 8.05 (1H, d, J = 4.4 Hz, H-7″), 7.56 (1H, d, J = 8.1 Hz, H-8″), 6.05 (1H, s, H-1′), 5.64 (1H, br s, OH-2′, disappears upon D2O exchange), 5.33 (3H, br s, H-1″, OH-3′, simplifies on D2O exchange), 4.63 (1H, m, H-2′); 4.58 (1H, br m, H-5′A), 4.45 (1H, m, H-3′); 4.36 (2H, br s, H-3″); 4.25 (1H, d, J = 5.1, H-5′B); 4.13 (1H, d, J = 12.6 Hz, H-4′); 3.06 (2H, t, J = 5.4 Hz, H-4″); HPLC 20.8 min (97 %).
Compound 8: yield 55%; mp 188–190°C; MS m/z 449(M+ + Na); 1H NMR (300MHz, (CD3)2SO), δ 8.31 (1H, s, H-2), 8.20 (1H, s, H-8″); 8.07 (1H, d, J = 7.5 Hz, H-6″), 7.49 (1H, t, J = 7.8 Hz, H-5″), 6.07 (1H, s, H-1′), 5.65 (1H, d, J = 6.6, OH-2′, disappears upon D2O exchange), 5.38 (1H, d, J = 5.4 Hz, OH-3′, simplifies upon D2O exchange), 5.33 (2H, br s, H-1″), 4.66 (1H, d, J = 2.1, H-2′); 4.59 (1H, br d, H-5′A), 4.47 (1H, t, J = 5.4 Hz, H-3′); 4.43 (2H, br s, H-3″); 4.25 (1H, t, J = 6.6, H-5′B); 4.13 (1H, d, J = 12.6 Hz, H-4′); 3.05 (2H, t, J = 5.7 Hz, H-4″); HPLC 23.9 min (95 %).
Compound 9: yield 47 %; mp 171–172°C; MS m/z 449(M+ + Na); 1H NMR (300MHz, (CD3)2SO), δ 8.28 (1H, s, H-2), 7.94 (1H, d, J = 8.1 Hz, H-7″); 7.58 (1H, d, J = 6.9 Hz, H-5″), 7.46 (1H, t, J = 7.8 Hz, H-6″), 6.03 (1H, s, H-1′), 5.62 (1H, d, J = 6.6, OH-2′, disappears on D2O exchange), 5.55 (2H, br s H-1″), 5.36 (1H, d, J = 5.4 Hz, OH-3′, disappears upon D2O exchange), 4.63 (1H, d, J = 2.4, H-2′); 4.58 (1H, br d, H-5′A), 4.44 (1H, t, J = 5.7 Hz, H-3′); 4.37 (2H, br s, H-3″); 4.22 (1H, t, J = 6.3, H-5′B); 4.12 (1H, d, J = 12.9 Hz, H-4′); 3.04 (2H, t, J = 5.7 Hz, H-4″); HPLC 21.1 min (99 %).
6-(7″-NO2 - 1, 2, 3, 4-tetrahydroisoquino-2-yl)-2′, 3′-O-p-isopropylidene purine riboside (10)
To a suspension of 6-(7″-NO2 - 1, 2, 3, 4-tetrahydroisoquino-2-yl) purine riboside (4, 1.11g, 2.6 mmol) in 30 ml of acetone was added 0.4 ml of 70 % HClO4 at 0 °C. The reaction mixture was stirred overnight at room temperature, after which the reaction mixture was neutralized with NH3·H2O and evaporated to dryness under aspirator pressure at 40 °C. The crude product was recrystallized from ethanol to give 1.14 g of 6-(7″-NO2 - 1, 2, 3, 4-tetrahydroisoquino-2-yl)-2′, 3′-O-p-isopropylidene purine riboside (10) (94 % yield). mp 88–90 °C; MS m/z 469(M+ + H); 1H NMR (300MHz, CDCl3), δ 8.36 (1H, s, H-2), 8.16 (1H, s, H-8″); 8.08 (1H, d, J = 7.8 Hz, H-6″), 7.35 (1H, t, J = 7.8 Hz, H-5″), 6.70 (1H, d, J = 6.0 Hz, OH-5′, disappeared upon D2O exchange); 5.85 (1H, d, J = 5.4 H-1′), 5.52 (2H, br s, H-1″), 5.25 (1H, t, J = 5.4, H-2′); 5.14 (1H, t, J = 5.4 Hz, H-3′); 4.58 (3H, br d, H-3″, H-5′A), 4.0 (1H, d, J = 12.6 Hz, H-4′); 3.80 (1H, t, J = 6.6, H-5′B); 3.12 (2H, t, J = 5.7 Hz, H-4″). 1.66 (3H, s, CH3 of isopropylidene group); 1.38 (3H, s, CH3 of isopropylidene group).
6-(7″-NO2 - 1, 2, 3, 4-tetrahydroisoquino-2-yl)-2′, 3′-O-p-isopropylidene-8-OH purine riboside (13)
6-(7″-NO2 - 1, 2, 3, 4-tetrahydroisoquino-2-yl)-2′, 3′-O-p-isopropylidene purine riboside (10, 500 mg, 1.07 mmol) was dissolved in a mixture of dioxane and 10 % disodium hydrogen phosphate buffer (32 ml, 1:1, vol/vol), then bromine (204.7 mg, 1.28 mmol) was added while stirring. The reaction mixture was stirred for 20 hours at ambient temperature, followed by the addition of 2N NaHSO3 to reduce the excess bromine. The solution was extracted with CH2Cl2. The combined organic layer was washed with 2N NaHSO3, dried over Na2SO4, and evaporated to give sticky residue, which was purified on preparative TLC plates using MeOH/EtOAc mixture (1:20 v/v) as the solvent system to afford 13 (156 mg, 30 % yield). mp 228–230°C; MS m/z 484(M+ + H); 1H NMR (300MHz, CDCl3), δ 8.98 (1H, s, H-2), 8.58 (2H, br s, H-8″, OH-8, simplifies on D2O exchange); 8.38 (1H, d, J = 7.8 Hz, H-6″), 7.54 (1H, t, J = 7.8 Hz, H-5″), 6.32 (1H, s, H-1′), 5.49 (1H, d, J = 5.4, H-2′); 5.12 (1H, m, H-3′), 4.45 (4H, m, H-1″, 3″); 3.65 (1H, t, J = 6.6, H-5′A); 3.45 (1H, m, H-4′); 3.30 (3H, m, H-4″, H-5′B); 1.40 (3H, s, CH3 of isopropylidene group); 1.25 (3H, s, CH3 of isopropylidene group).
2′, 3′-O-isopropylidene-6-chloropurine riboside (15)
A suspension of 6-chloro purine riboside (14, 1.0g, 3.5 mmol) in 42 ml of acetone was stirred overnight with 0.6ml of 70 % HClO4 at room temperature. The reaction mixture was neutralized with NH3·H2O, after which the mixture was evaporated to dryness under aspirator pressure at 40°C. The crude product was recrystallized from ethanol to give 1.1 g of 6-(7″-NO2 - 1, 2, 3, 4-tetrahydroisoquino-2-yl)-2′, 3′-O-p-isopropylidene purine riboside (15) (94 % yield). mp 160–161 °C; MS m/z 449(M+ + Na); 1H NMR (300MHz, CDCl3), δ 8.80 (1H, s, H-8); 8.26 (1H, s, H-2), 5.98 (1H, d, J = 5.4 H-1′); 5.22 (1H, t, J = 5.4, H-2′); 5.14 (1H, t, J = 5.4 Hz, H-3′); 4.96 (1H, dd, J = 6.0, 2.1Hz, OH-5′, disappeared upon D2O exchange); 4.58 (1H, br s, H-4′); 4.0 (1H, d, J= 7.8 Hz, H-5′A); 3.84 (1H, t, J = 6.6, H-5′B); 1.68 (3H, s, CH3 of isopropylidene group); 1.42 (3H, s, CH3 of isopropylidene group).
5′-O, 8-cyclo-2′, 3′-O- isopropylidene-6-chloropurine riboside (16)
A mixture of 2′, 3′-O-isopropylidene-6-chloropurine riboside (15) (960 mg, 2.94 mmol) and N-iodosuccinimide (NIS) (2.01g, 8.8 mmol) in acetic acid (29 ml) was stirred at 50–60 °C for 3 days. Acetic acid was removed in vacuo. The concentrated reaction mixture was neutralized with NH3·H2O and extracted with ethyl acetate (30 ml × 3). The organic layer was separated and washed with water (10 ml × 3), dried over anhydrous Na2SO4 and evaporated. The residue was subjected to chromatography on silica gel eluting with Hexane/EtOAc (3:2) to provide 344 mg of 5′-O, 8-cyclo-2′, 3′-O-p-anisylidene-6-chloropurine riboside (16) as crystals (36 %). mp 224–226 °C; MS (ESI) m/z 347 (M+ + Na); 1H NMR (300 MHz, CDCl3), δ 8.62 (1H, s, H-2), 6.44 (1H, s, H-1′), 5.08 (1H, d, J = 5.4, H-4′), 4.70 (2H, m, H-5′), 4.52 (1H, d, J = 6.0 Hz, H-3′), 4.24 (1H, d, J = 6.0 Hz, H-2′), 2.12 (3H, s, CH3 of isopropylidene group); 1.32 (3H, s, CH3 of isopropylidene group).
2′, 3′-O- isopropylidene-8-hydroxy-6-chloropurine riboside (18)
5′-O, 8-cyclo-2′, 3′-O- isopropylidene-6-chloropurine riboside (16, 100 mg, 0.31 mmol) was suspended in 0.5 N H2SO4 (4 ml) and stirred at 55°C for 15 h. The reaction mixture was neutralized with NH3·H2O and evaporated to dryness in vacuo. The residue was subjected to chromatography on preparative TLC plates using a mixture of MeOH/EtOAC (1:20) as the solvent system. The purified product was characterized as 8-hydroxy-2′, 3′-O- isopropylidene-6-chloropurine riboside (18) (23.3 mg, 25 % yield). MS (ESI) m/z 325(M+ + Na); 1H NMR (300MHz, (CD3)2SO), δ 12.31 (1H, br s, OH-8); 8.48 (1H, s, H-2), 5.73 (1H, d, J = 6.4 Hz, H-1′), 5.31 (1H, d, J = 6.6, OH-2′), 5.12 (1H, d, J = 5.7 Hz, OH-3′), 4.89 (1H, q, J = 10.8 Hz, H-2′), 4.76 (1H, t, J = 6.6 Hz, OH-5′); 4.21 (1H, t, J = 6.0 Hz, H-3′); 3.86 (1H, t, J = 6.0 Hz, H-4′); 3.62 (1H, m, H-5′A); 3.48 (1H, m, H-5′B).
2′, 3′-O-p-anisylidene-6-chloropurine riboside (19)
A suspension of zinc chloride (2.65 g, 19.4 mmol) in p-methoxybenzaldehyde (10 ml) was stirred for 30 min at 30–40 °C, and then 6-chloropurine riboside (14) (1 g, 3.5 mmol) was added. The mixture was stirred at room temperature for 5 days. The semi-solid product was poured on ice and extracted with CHCl3 (40 ml × 3) and the combined organic extracts was washed with water, dried over anhydrous Na2SO4 and evaporated. The residue was chromatographed on silica gel. Eluate of 60 % ethyl acetate in hexane was collected and evaporated to give Compound 19 (1.2g, 81 %). mp 128–130 °C; MS (ESI) m/z 427(M+ + Na); 1H NMR (300MHz, (CD3)2 SO), a 2:1 mixture of stereoisomers doubling most signals, δ 8.92 (1H, s, H-8), 8.84 (1H, s, H-2), 7.45 (2H, d, J = 9.0 Hz, ortho-H of p-anisylidene ring), 6.88 (2H, d, J = 9.0 Hz, para-H of p-anisylidene ring), 6.45 (1H, d, J = 3.0 Hz, H-1′), 6.21 (1H, s, p-anisylidene CH), 5.52 (1H, m, H-2′), 5.15 (1H, t, J = 6.0 Hz, OH-5′), 5.12 (1H, m, H-3′), 4.38 (1H, q, J = 6.0 Hz, H-4′), 3.78 (3H, s, OCH3), 3.63 (2H, m, H-5′). Anal. Calcd. For C18H17ClN4O5 (404.81): C, 53.41%; H, 4.23%; Cl, 8.76%, N, 13.84%. Found: C, 53.27%; H, 4.23%; Cl, 8.64%, N, 13.76%.
5′-O, 8-cyclo-2′, 3′-O-p-anisylidene-6-chloropurine riboside (20)
A mixture of 2′, 3′-O-p-anisylidene-6-chloropurine riboside (19) (1.0g, 2.48 mmol) and N-iodosuccinimide (NIS) (1.6 g, 7.4 mmol) in acetic acid (24 ml) was stirred at ambient temperature for 3 days. Acetic acid was removed in vacuo. The concentrated reaction mixture was neutralized with NH3·H2O and extracted with ethyl acetate (30 ml × 3). The organic layer was separated and washed with water, dried over anhydrous Na2SO4 and evaporated. The residue was subjected to chromatography on SiO2 and eluted with Hexane/EtOAc mixture (1:1) to provide 429 mg of 5′-O, 8-cyclo-2′, 3′-O-p-anisylidene-6-chloropurine riboside (20) as a crystal (yield 43 %). mp 215–216°C; MS (ESI) m/z 425(M+ + Na); 1H NMR (300MHz, CDCl3), δ 8.71 (1H, s, H-2), 7.40 (2H, d, J = 9.0 Hz, ortho-H of p-anisylidene ring), 6.94 (2H, d, J = 9.0 Hz, para-H of p-anisylidene ring), 6.67 (1H, s, H-1′), 6.19 (1H, s, p-anisylidene CH), 5.25 (1H, d, J = 6.0, H-2′), 4.92 (2H, q, J = 9.0 Hz, H-5′), 4.69 (1H, q, J = 9.0 Hz, H-3′), 4.31 (1H, d, J = 12.0 Hz, H-4′), 3.83 (3H, s, OCH3). Anal. Calcd. For C18H15ClN4O5 (402.80): C, 53.67%; H, 3.75%; N, 13.91%. Found: C, 53.23 %; H, 3.77 %; N, 13.68 %.
5′-O, 8-cyclo-6-chloropurine riboside (17)
5′-O, 8-cyclo-2′, 3′-O-p-anisylidene-6-chloropurine riboside (20) (320 mg, 0.8 mmol) was suspended in 80 % trifluoroacetic acid (4 ml) and stirred in an ice bath for 4 hours. The reaction mixture was neutralized with NH3·H2O and evaporated in vacuo to remove water. The resulting residue was dissolved in ethyl acetate and subjected to chromatography on silica gel using a mixture of Hexane/EtOAc (1:4) as eluant to give 166 mg of 5′-O, 8-cyclo-6-chloropurine riboside (17) as crystals (73 %). mp 212–213 °C; MS (ESI) m/z 307(M+ + Na); 1H NMR (300MHz, (CD3)2SO), δ 8.71 (1H, s, H-2), 6.12 (1H, s, H-1′), 5.65 (1H, d, J = 6.6, OH-2′), 5.43 (1H, d, J = 5.7 Hz, OH-3′), 4.74 (1H, q, J = 10.8 Hz, H-2′), 4.64 (1H, br s, H-5′A), 4.46 (1H, t, J = 6.0 Hz, H-3′); 4.33 (1H, br d, J = 6.0 Hz, H-5′B); 4.29 (1H, br d, J = 4.8 Hz, H-4′). Anal. Calcd. For C10H9ClN4O4 (284.66): C, 42.19%; H, 3.19%; Cl, 12.45%; N, 19.68%. Found: C, 42.25 %; H, 3.30 %; Cl, 12.09; N, 19.33 %.
Biological Testing
The compounds were tested to determine their ENT1 (es) nucleoside transporter binding affinity by a flow cytometric assay (Buolamwini et al., 1994). Human leukemia K562 cells growing in RPMI 1640 medium were washed once and suspended at 1.6 × 10⁶ cells/ml in phosphate-buffered saline at pH 7.4, and incubated with 5-(SAENTA)-X8-fluorescein (25 nM) in the presence or absence of varying concentrations of test compounds at room temperature for 45 minutes. Flow cytometric measurements for cell-associated fluorescence were then performed on a FACSCalibur instrument (Becton Dickinson, San Jose, CA) equipped with a 15 mW-argon laser (Molecular Resources Flow Cytometry Facility, University of Tennessee Health Sciences Center). In each assay, 5,000 cells were analyzed from suspensions of 4 × 10⁵ cells/ml. The units of fluorescence were arbitrary channel numbers. Percentage (%) of control (i.e. ENT1 transporter-specific fluorescence in the presence of SAENTA-fluorescein without test compounds) was calculated for each sample by the equation below:
| Eq. 2 |
where SFs is the ENT1 transporter-specific fluorescence of test samples, and SFf is the ENT1 transporter-specific fluorescence of the SAENTA-fluorescein ligand standard in mean channel numbers. Inhibition constants were calculated from the IC50 values Ki values using Eq. 3.
| Eq. 3 |
where [L] and KL are the concentration and the Kd value of the SAENTA-fluorescence, respectively. The results were fed into the PRISM program (GraphPad, San Diego, CA) to derive concentration-dependent curves, as shown in Figure 3. From these curves, the IC50 values were obtained and used to calculate Ki values, which were used to compare the abilities of compounds to displace the ENT1 (es) transporter-specific ligand, 5- (SAENTA)-X8-fluorescein (Buolamwini et al., 1994), and for that matter their affinity for the transporter.
Acknowledgments
Financial support from the National Heart Lung and Blood Institute, grant number K01-HL067479 awarded to J.K.B. is gratefully acknowledged.
Footnotes
Publisher's Disclaimer: This is a PDF file of an unedited manuscript that has been accepted for publication. As a service to our customers we are providing this early version of the manuscript. The manuscript will undergo copyediting, typesetting, and review of the resulting proof before it is published in its final citable form. Please note that during the production process errors may be discovered which could affect the content, and all legal disclaimers that apply to the journal pertain.
References
- 1.Zhu Z, Furr J, Buolamwini JK. J Med Chem. 2003;46:831–837. doi: 10.1021/jm020405p. [DOI] [PubMed] [Google Scholar]
- 2.Abd-Elfattah AS, Wechsler AS. J Card Surg. 1994;9:387–396. doi: 10.1111/jocs.1994.9.3s.387. [DOI] [PubMed] [Google Scholar]
- 3.Abd-Elfattah AS, Jessen ME, Lekven J, Wechsler AS. Mol Cell Biochem. 1998;180:179–191. [PubMed] [Google Scholar]
- 4.Van Belle H. Cardiovasc Res. 27;1993:68–76. doi: 10.1093/cvr/27.1.68. [DOI] [PubMed] [Google Scholar]
- 5.Deckert J, Morgan PF, Marangos PJ. Life Sci. 1988;42:1331–1345. doi: 10.1016/0024-3205(88)90162-2. [DOI] [PubMed] [Google Scholar]
- 6.Geiger JD, Parkinson FE, Kowaluk EA. Regulators of endogenous adenosine levels as therapeutic agents. In: Jacobson KA, Jarvis MF, editors. Purinergic Approaches in Experimental Therapeutics. Wiley-Liss; New York: 1997. [Google Scholar]
- 7.Ohta A, Sitkovsky M. Nature. 2001;414:916–920. doi: 10.1038/414916a. [DOI] [PubMed] [Google Scholar]
- 8.Weinstein GD, Jeffes E, McCullough JL. J Invest Dermatol. 1990;95:49S–52S. doi: 10.1111/1523-1747.ep12505777. [DOI] [PubMed] [Google Scholar]
- 9.Hendrix CW, Flexner C, Szebeni J, Kuwahara S, Pennypacker S, Weinstein JN, Lietman PS. Antimicrob Agents Chemother. 1994;38:1036–1040. doi: 10.1128/aac.38.5.1036. [DOI] [PMC free article] [PubMed] [Google Scholar]
- 10.Adjei AA, Dagnino L, Wong MM, Paterson AR. Cancer Chemother Pharmacol. 1992;31:71–75. doi: 10.1007/BF00695997. [DOI] [PubMed] [Google Scholar]
- 11.Dagnino L, Paterson AR. Cancer Res. 50:6549–6553. [PubMed] [Google Scholar]
- 12.Tew KD, Houghton PJ, Houghton JA. Preclinical and clinical modulation of Anticancer Drugs. Chap. 7. CRC Press; Boca Raton: 1993. 1990. [Google Scholar]
- 13.el Kouni MH. Pharmacol Ther. 2003;99:283–309. doi: 10.1016/s0163-7258(03)00071-8. [DOI] [PubMed] [Google Scholar]
- 14.Al Safarjalani ON, Naguib FN, el Kouni MH. Antimicrob Agents Chemother. 2003;47:3247–3251. doi: 10.1128/AAC.47.10.3247-3251.2003. [DOI] [PMC free article] [PubMed] [Google Scholar]
- 15.Yadav V, Chu CK, Rais RH, Al Safarjalani ON, Guarcello V, Naguib FN, el Kouni MH. J Med Chem. 47;2004:1987–1996. doi: 10.1021/jm030537y. [DOI] [PubMed] [Google Scholar]
- 16.Williams EF. SAAS Bull Biochem Biotechnol. 1996;9:51–56. [PubMed] [Google Scholar]
- 17.Hoehner J, Wechsler AS, Abd-Elfattah AS. Dev Cardiovasc Med. 1996;181:209–218. [Google Scholar]
- 18.Buolamwini JK. Curr Med Chem. 1997;4:35–66. [Google Scholar]
- 19.Cass CE. In: Drug Transport in Antimicrobial and Anticancer Chemotherapy. Georgopapadakou NH, editor. Marcel Dekker; New York: 1995. [Google Scholar]
- 20.Sprague PW. Perspectives in Drug Discovery and Design. ESCOM; Leiden: 1995. De Novo Design. [Google Scholar]
- 21.Nomenclature Committee of IUB (NC-IUB) and IUPAC-IUB Joint Commission on Biochemical Nomenclature (JCBN) . Eur J Biochem. 1981;114:1–4. Newsletter. [PubMed] [Google Scholar]
- 22.Ikehara M, Uesugi S, Yasumoto MA. J Am Chem Soc. 1970;92:4735–4736. doi: 10.1021/ja00718a046. [DOI] [PubMed] [Google Scholar]
- 23.Ikehara M, Tada H, Kaneko M. Tetrahedron. 1968;24:3489–3498. doi: 10.1016/s0040-4020(01)92646-8. [DOI] [PubMed] [Google Scholar]
- 24.Ikehara M, Kaneko M. Tetrahedron. 1970;26:4251–4259. doi: 10.1016/s0040-4020(01)93068-6. [DOI] [PubMed] [Google Scholar]
- 25.Lin TS, Cheng JC, Ishiguro K, Sartorelli AC. J Med Chem. 1985;28:1481–1485. doi: 10.1021/jm00148a018. [DOI] [PubMed] [Google Scholar]
- 26.Kitade Y, Makino T, Hirota K, Maki Y. Nucleosides Nucleotides. 1992;11:365–372. [Google Scholar]
- 27.Maki Y, Sako M, Saito T, Hirota K. Heterocycles. 1988;27:347–350. [Google Scholar]
- 28.Paul B, Chen MF, Paterson AR. J Med Chem. 1975;18:968–973. doi: 10.1021/jm00244a003. [DOI] [PubMed] [Google Scholar]
- 29.Robins MJ, Asakura J, Kanekc M, Shibuya S, Jakobs ES, Agbanyo FR, Cass CE, Paterson ARP. Nucleosides Nucleotides. 1994;13:1627–1646. [Google Scholar]
- 30.Gupte A, Buolamwini JK. Bioorg Med Chem Lett. 2004;14:2257–2260. doi: 10.1016/j.bmcl.2004.02.016. [DOI] [PubMed] [Google Scholar]
- 31.Gupte A, Buolamwini JK, Yadav V, Chu CK, Naguib FN, el Kouni MH. Biochem Pharmacol. 2005;71:69–73. doi: 10.1016/j.bcp.2005.10.031. [DOI] [PubMed] [Google Scholar]
- 32.Soriano-Garcia M, Parthasarathy R, Paul B, Paterson ARP. Acta Cryst. 1984;C40:1897–1901. [Google Scholar]
- 33.Paterson AR, Naik SR, Cass CE. Mol Pharmacol. 1977;13:1014–1023. [PubMed] [Google Scholar]
- 34.Buolamwini JK, Barchi JJ., Jr Nucleosides Nucleotides. 1997;16:2101–2110. [Google Scholar]
- 35.Buolamwini JK, Wiley JS, Robins MJ, Craik JD, Cass CE, Gati WP, Paterson ARP. Nucleosides Nucleotides. 1994;13:737–751. [Google Scholar]
- 36.Cramer RD, III, Patterson DE, Bunce JD. J Am Chem Soc. 1988;110:5959–5967. doi: 10.1021/ja00226a005. [DOI] [PubMed] [Google Scholar]
- 37.Kubinyi H, editor. 3D QSAR in Drug Design: Theory, Methods and Applications. ESCOM Science Publishers; Leiden: 1993. [Google Scholar]
- 38.Chang C, Swaan PW, Ngo LY, Lum PY, Patil SD, Unadkat JD. Mol Pharmacol. 2004;65:558–570. doi: 10.1124/mol.65.3.558. [DOI] [PubMed] [Google Scholar]
- 39.Zhang J, Smith KM, Tackaberry T, Visser F, Robins MJ, Nielsen LP, Nowak I, Karpinski E, Baldwin SA, Young JD, Cass CE. Mol Pharmacol. 2005;68:830–9. doi: 10.1124/mol.105.012187. [DOI] [PubMed] [Google Scholar]
- 40.Zhang J, Visser F, Vickers MF, Lang T, Robins MJ, Nielsen LP, Nowak I, Baldwin SA, Young JD, Cass CE. Mol Pharmacol. 2003;64:1512–20. doi: 10.1124/mol.64.6.1512. [DOI] [PubMed] [Google Scholar]


