Abstract
Spontaneous cell fusion can occur in cocultured stem cells. We examined whether telomerase activity change and cell fusion occurred in mesenchymal stem cell (MSC) and nucleus pulposus cell (NPC) coculture. MSCs and NPCs were labeled with PKH26 and PKH67 dyes and cocultured at a 50:50 ratio. An equal number of MSCs or NPCs were used as the control. After 14 days, cells were evaluated by cell growth, telomerase activity, quantitative reverse transcriptase-polymerase chain reaction (RT-PCR), immunohistochemistry, and histologic observation. Cell fusion was confirmed by microscopic observation and fluorescence-activated cell sorter (FACS) analysis. The results suggested cell growth rate and telomerase activity were higher in cocultured cells than in NPCs cultured alone. The mRNA expression levels of the Type II collagen and aggrecan were elevated in cocultured cells. Immunohistochemical analysis revealed positive staining for Type II collagen and keratan sulfate in NPCs cultured alone and in a proportion of cocultured cells. Histologic observation revealed binucleated cocultured cells expressed both PKH dyes in the same location and slide focus. The FACS analysis revealed 42% of cocultured cells were double-stained. Cocultured cells partially maintained the NPC phenotype. The partially maintained phenotype of the NPCs may be attributable to spontaneous cell fusion in association with increased telomerase activity.
Introduction
Disorders of the lumbar intervertebral disc (IVD) often cause low back pain. Several local biologic treatment strategies such as gene transfer, administration of specific growth factors, and reinsertion of autogenous cells have been proposed and evaluated in in vitro and in vivo investigations on disc tissue [12, 17, 21–23]. The insertion of NPCs reportedly diminishes additional disc degeneration in an animal model [23, 24]. These strategies shed light on biologic treatments to activate NPCs, such as coculture of NPCs with MSCs, and to retard disc degeneration when inserted into the disc.
The IVD is composed of the nucleus pulposus and annulus fibrosus. The nucleus pulposus contains higher concentrations of aggrecan [18] and Type II collagen [14] than other regions of the disc. Aggrecan consists of a core protein to which chondroitin sulfate and keratan sulfate (KS) are covalently linked. KS is reportedly a potential biomarker of IVD loading [16]. The regeneration ability of IVD tissue is limited. Once IVD degeneration is initiated, apparently it is an irreversible condition [20]. However, in a couple studies, NPCs and annulus fibrosus cells were cocultured as a potential strategy for cell transplantation to treat disc degeneration [1, 23]. The coculture of annulus fibrosus cells with NPCs results in more vigorous annulus fibrosus cell proliferation [23]. Also, coculture of NPCs and notochordal cells increases proteoglycan synthesis in the cells [1]. More recently, MSCs were cultured from adult bone marrow and reportedly contributed to bone, cartilage, adipose, and ligament regeneration [27, 32]. In other studies, MSCs injected into the IVD survived and proliferated in situ [10, 30]. Rabbit NPCs and MSCs exhibit increased proliferation and proteoglycan synthesis when cocultured [44]. The coculture of NPCs and MSCs with cell-to-cell contact stimulates MSCs to differentiate and develop a NPC-like phenotype [28]. Some in vitro studies have used the monolayer cell culture system for coculture of NPCs and MSCs [28, 44]. However, the disc cells seem to exhibit their native phenotypes only when cultured in a three-dimensional system [18]. Thus, cell-cell interactions and environmental cues seem important for modeling the phenotype of these cells when cultured in vitro [18].
MSCs exhibit a stable phenotype and telomerase activity in culture [27]. Proliferation activity and telomere length of chondrocytes reportedly reduce with donor [35] and ex vivo expansion [24, 26]. Disc chondrocytes in intact NPCs originate and migrate from the cartilage endplate [18].
Cell fusion occurs during the differentiation of mononuclear phagocytes from osteoclasts or giant cells in mammals [40]. A hybrid cell and its progeny usually include donor and host chromosomes and then the exchange of specific molecules reprograms gene expression [41]. Stem cells residing in one particular tissue may have the capacity to differentiate and develop the phenotypes of cells found in other tissues and organs. Such altered phenotypes do not arise by direct conversion of donor cells into recipient cells but rather via spontaneous generation of hybrid cells [33, 39, 45]. Investigations have indicated spontaneous cell fusion can occur in cocultured stem cells [33, 45], but it is unknown whether cocultured NPCs and MSCs proliferate, and exhibit normal NPC phenotypes, and whether they can fuse.
We therefore asked whether coculture of MSCs and NPCs would result in (1) increased proliferation compared with monoculture alone, (2) increased expression of Type II collagen and aggrecan genes, and (3) spontaneous fusion of the two cell types.
Materials and Methods
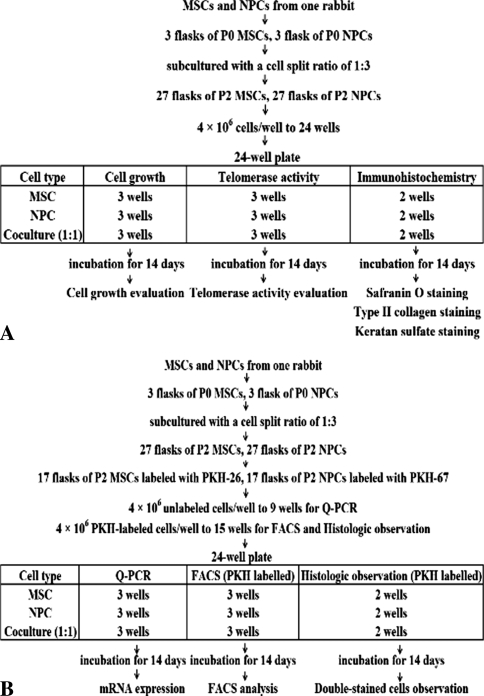
We extracted MSCs and NPCs from 10 rabbits. Cell growth, telomerase activity, and cell phenotype of MSCs, NPCs, and cocultured cells were examined in cells from six rabbits. Quantitative real-time RT-PCR was performed for the cells extracted from four rabbits to determine the relative gene expressions. We also labeled the cells obtained from the four rabbits with PKH and cocultured them, and cell fusion was directly observed using a fluorescence microscope and was analyzed using a fluorescence-activated cell sorter (FACS). Flowcharts illustrate our experimental method (Fig. 1).
Fig. 1A–B.
The flowcharts illustrate our experimental method. (A) Cell growth, telomerase activity, and cell phenotype of MSCs, NPCs, and cocultured cells were examined. (B) Quantitative reverse transcriptase-polymerase chain reaction (Q-PCR), FACS, and fluorescence microscopy were examined.
We anesthetized New Zealand rabbits weighing 3 kg by an intramuscular injection of a 5-mL mixture of ketamine hydrochloride (Nang Kuang, Tainian, Taiwan) and Rompum® (Bayer, Leverkusen, Germany). Under sterile conditions, 10 mL bone marrow aspirated from the iliac crest was collected in a syringe containing 6000 units heparin to prevent clotting.
The marrow sample was washed with Dulbecco’s phosphate-buffered saline (DPBS) and disaggregated by gently passing it through a 21-gauge intravenous catheter and syringe to obtain a single-cell suspension. The cells were recovered after centrifugation at 600 g for 10 minutes. Five milliliters of cell suspension in DPBS (2 × 10⁸ nucleated cells) was loaded onto a 25-mL cushion of Percoll® (density, 1.073 g/mL; GE Healthcare, Uppsala, Sweden) in a 50-mL conical tube. The cells were separated by centrifugation at 1100 g and 20°C for 40 minutes. We collected the nucleated cells from the interface, diluted them with two volumes of DPBS, and collected them once again by centrifugation at 900 g. The cells were resuspended, counted, plated at a density of 2 × 10⁵ cells/cm2 into a single T-75 flask (Corning, Taipei, Taiwan), and then maintained in Dulbecco’s Modified Eagle’s Medium-Low Glucose (DMEM-LG; Gibco BRL, Grand Island, NY) containing 20% fetal bovine serum (FBS) and antibiotics (a mixture of 100 units/mL penicillin and 100 μg/mL streptomycin; Gibco) at 37°C in a humidified atmosphere of 5% CO2 and 95% air. After incubation for 4 days, the nonadherent cells were removed by changing the medium; thereafter, the medium was replaced every 3 days. MSCs grew as symmetric colonies and were subcultured at 10 to 14 days by treatment with 0.05% trypsin and 0.53 mmol/L ethylenediaminetetraacetic acid (EDTA) for 5 minutes, collected by centrifugation at 800 g for 5 minutes, and seeded in three fresh flasks at 5000 to 6000 cells/cm2. The cultures were incubated in a humidified atmosphere of 5% CO2 and 95% air until the cells attained confluence. At confluence, the cells were harvested by trypsin treatment (0.025% trypsin) and subcultured with a cell split ratio of 1:3. Only cells in the second passage were used.
After the bone marrow was collected from the rabbits, the animals were euthanized by an intravenous injection containing a 2-mL mixture of ketamine hydrochloride and Rompum®. Immediately thereafter, three consecutive IVDs (L2–L3, L3–L4, L4–L5) were dissected from the spines. NPCs then were separated from the discs of 10 rabbits by blunt dissection, and the cells obtained from each animal were separately pooled. The cells were separated from each specimen by performing sequential enzymatic digestion, first with 0.4% pronase (Sigma-Aldrich Corp, St Louis, MO) for 1 hour and subsequently with 0.025% collagenase P (Boehringer Mannheim, Mannheim, Germany) and 0.004% DNase II (Sigma) at 37°C overnight. After the digestion, the cells were washed extensively with a 1:1 mixture of DMEM and F-12 (Gibco) and were seeded in three fresh flasks at a density of 5000 cells/cm2. The cultures were incubated in a humidified atmosphere of 5% CO2 and 95% air until the cells attained confluence. At confluence, the cells were harvested by trypsin treatment (0.025% trypsin) and subcultured with a cell split ratio of 1:3. Only cells in the second passage were used.
Soon after trypsin treatment, MSCs and NPCs were mixed at a 50:50 ratio (2 × 10⁶ cells of each type) and resuspended in 1.2% low-viscosity alginate (Sigma) in 0.15 mol/L sodium chloride. The cell suspension was passed gently through a 22-gauge needle connected to a 5-mL syringe into a 102-mmol/L calcium chloride solution, where each drop was immediately transformed into a semisolid microspheric bead. After 10 minutes of incubation at 37°C to facilitate further polymerization, we washed the newly formed beads three times with normal saline followed by two washes with DMEM/F-12 to remove the excess calcium chloride. MSCs or NPCs cultured at an equal density (4 × 10⁶ cells) in alginate were used as controls. We placed nine beads (4 × 10⁶ cells) in each well of a 24-well plate (Corning) and cultured them in 0.4 mL DMEM/F-12 supplemented with 10% FBS and antibiotics (Fig. 1A). The cultures were maintained for 14 days at 37°C in a humidified atmosphere of 5% CO2 and 95% air, with the medium being replaced every 3 days.
We measured cell growth by the increase in the number of cells after incubation for 14 days. The alginate beads from three wells of each type (MSCs, NPCs, and coculture) from one rabbit were solubilized by incubating them at 4°C for 20 minutes in a dissolving buffer (pH 6.8) containing 55 mmol/L sodium citrate, 30 mmol/L disodium EDTA, and 0.15 mol/L sodium chloride. After mild centrifugation, the cell pellet was washed twice with the dissolving buffer, collected by centrifugation, and resuspended in PBS. The number of cells in the wells was determined in triplicate using a Coulter Multisizer™ II system (Beckman Coulter, Miami, FL).
We determined the telomerase activity by telomerase polymerase chain reaction enzyme-linked immunosorbent assay (PCR ELISA) (Roche, Mannheim, Germany). After incubation for 14 days, the alginate beads from three wells of each type (MSCs, NPCs, and coculture) from one rabbit were solubilized as described previously. For protein extraction, the cells were homogenized in a lysis buffer and centrifuged (3000 g for 10 minutes), and the extracts were subjected to a telomeric repeat amplification protocol. In this assay, telomerase was used to add telomeric repeats (TTAGGG) to the 3′ end of biotin-labeled synthetic primers. The elongated fragments then were amplified by PCR. The PCR products were detected and quantified by performing ELISA according to the manufacturer’s protocol. An equivalent number of cells (2 × 10⁶) of each type was used for each extraction, and the results were normalized to those obtained for a standard, ie, a telomerase-positive extract (embryonic kidney cell line 293), which was supplied by the manufacturer. After normalization to the internal control, we used NPCs and MSCs alone in alginate beads as a control for calculation.
After incubation for 14 days, the alginate beads from two wells of each type (MSCs, NPCs, and coculture) from one rabbit were collected and fixed in 4% paraformaldehyde for 4 hours at room temperature and subsequently dehydrated in a graded series of ethanol, washed with xylene, and embedded in paraffin. Samples containing all cell clusters (regions were not specially selected) were cut to a thickness of 5 μm using a microtome (Leica Inc, Deerfield, IL). Also, four sample sections of each type (MSCs, NPCs, and coculture) were deparaffinized in xylene and treated with ethanol solutions over a decreasing concentration gradient. The endogenous peroxidase activity was blocked with 1% H2O2. We performed immunohistochemical analyses using polyclonal antibodies against Type II collagen (Southern Biotechnology, Birmingham, AL). Avidin-biotin-peroxidase reagent (Vectastain® ABC; Vector Laboratories, Burlingame, CA) and diaminobenzidine (DAB) substrate solutions (Vector Laboratories) were used to observe the immunoreactivity, and 0.1% methyl green was used for counterstaining. Four sample sections of each type (MSCs, NPCs, and coculture) were incubated with chondroitinase ABC (0.25 units/mL; Sigma) in PBS solution at 37°C for 60 minutes. The endogenous peroxidase activity was blocked with 1% H2O2. The sections then were processed for immunostaining with the 1/20/5-D-4 anti-KS monoclonal antibody (Chemicon, Temecula, CA). Vectastain® ABC and DAB substrate solutions were used for visualizing the immunoreactivity, and 0.1% methyl green was used for counterstaining.
Four sample sections of each type (MSCs, NPCs, and coculture) were stained with safranin O with a dye concentration of 0.1% and staining time of 6 minutes at pH 5.7. Positive staining was detected during the incubation, indicating the presence of proteoglycan. All the staining procedures were performed at room temperature. The appearance of binucleated cells in the coculture raised the possibility of cell fusion.
We placed nine beads (4 × 10⁶ cells) each in nine wells of a new 24-well plate (Corning) and cultured them in 0.4 mL DMEM/F-12 supplemented with 10% FBS and antibiotics (Fig. 1B). After coculture for 14 days, the alginate beads from three wells of each type (MSCs, NPCs, and coculture) from one rabbit were solubilized as described previously. Total RNA was extracted using the TRIzol® reagent (Invitrogen, Taipei, Taiwan) according to the manufacturer’s recommendations. The first-strand complementary DNA (cDNA) was generated using reverse transcriptase (SuperScript™ II; Life Technology, Gaithersburg, MD) and oligo(dt) primers. For quantitative real-time RT-PCR-assisted detection of the RNA transcripts, the cDNA was analyzed using an ABI PRISM® 7900 sequence detection system and the SYBR® Green I PCR master mix (Applied Biosystems, Foster City, CA). The reaction mixture contained 16 μL SYBR Green mix, 2 μL primer, and 2 μL cDNA in a total volume of 25 μL. The PCR was run for 40 cycles with denaturation at 95°C, annealing at 58°C, and extension at 72°C. The following rabbit-specific primers were used to amplify glyceraldehyde-3-phosphate dehydrogenase (GAPDH), COL2A1, and aggrecan: GAPDH sense, 5′-GGTGAAGGTCGGAGTGAA-3′, and antisense, 5′- TTCACGCCCATCACAAACA-3′ (PCR product: 399 bp); COL2A1 sense, 5′-GTCTCCATAGCTGAAGTGG-3′, and antisense, 5′-CCATGCAGTACATGCGGG-3′ (PCR product: 386 bp); and aggrecan sense, 5′-ACCCCTGAGGAACAGGAGTT-3′, and antisense, 5′-GTGCCAGATCATCACCACAC-3′ (PCR product: 189 bp) [13]. A cycle threshold (Ct) value was obtained for each sample, and the duplicate sample values were averaged. The 2–ΔΔCt method was used to calculate the relative expression level of each target gene. In brief, the mean Ct values of the target genes in each sample were normalized to that of the housekeeping gene GAPDH to obtain a ΔCt value. This then was normalized to the values obtained for the control samples (ΔΔCt), ie, either MSCs or NPCs cultured singularly, and used to calculate the 2–ΔΔCt value.
We examined whether the increased cocultured cells were derived from the hybrid cells between MSCs and NPCs. For this analysis, we used PKH membrane linkers (0.5–10 μmol/L; Sigma), which get incorporated into the cell membranes and are distributed equally to the daughter cells during division [3, 39]. We performed cell labeling by incubation of 3.4 × 10⁷ cells (17 flasks of MSCs) in 3.4 mL Diluent C with freshly prepared PKH26 (red fluorescent marker) or 3.4 × 10⁷ cells (17 flasks of NPCs) in 3.4 mL Diluent C with PKH67 (green fluorescent marker) for 10 minutes at room temperature (Fig. 1B) The cells were collected by centrifugation (at 400 g, 4°C, for 10 minutes), resuspended in Hanks’ balanced salt solution (HBSS) supplemented with 10% FBS, and washed twice with HBSS. The average recovery of this procedure was 80% to 90% viable cells, as determined by performing the trypan blue exclusion test.
PKH26-labeled MSCs and PKH67-labeled NPCs were mixed at a 50:50 ratio (2 × 10⁶ cells of each type), resuspended in 1.2% low-viscosity alginate (Sigma) in 0.15 mol/L sodium chloride, and produced the alginate beads as described previously. PKH26-labeled MSCs or PKH67-labeled NPCs cultured at an equal density (4 × 10⁶ cells) in alginate were used as controls. We placed nine beads (4 × 10⁶ cells) each in 15 wells of a 24-well plate (Corning) and cultured them in 0.4 mL DMEM/F-12 supplemented with 10% FBS and antibiotics (Fig. 1B). The cultures were maintained at 37°C in a humidified atmosphere of 5% CO2 and 95% air, with the medium being replaced every 3 days.
After incubation for 14 days, the alginate beads from two wells of each type (MSCs, NPCs, and coculture) were embedded in optimal cutting temperature (OCT) compound (Tissue-Tek®; Sakura Inc, Tokyo, Japan) and snap-frozen in liquid nitrogen. Four 5-μm sample sections were cut with a Leica CM1850 cryostat. Direct observations on PKH-labeled cells in four sections were performed with fluorescence microscopes (Olympus, Tokyo, Japan). Red, green, and blue image reconstruction was performed in red fluorescence of MSCs labeled with PKH26 and green fluorescence of NPCs labeled with PKH67. To ensure superimposition, the red and green images were obtained separately by changing the light source and the filters but not the slide position or the focus. Each image was captured with a digital camera (C 5060; Olympus). Double-stained cells (PKH26 and PKH67 labeling) were characterized as fused cells between MSCs and NPCs. The effects of different cell layers overlapping in an image were eliminated by performing FACS analysis.
After incubation for 14 days, the alginate beads from three wells of each type (MSCs, NPCs, and coculture) were solubilized as described above. The cells were pelleted, washed once with cold PBS-1% bovine serum albumin (Sigma), and fixed in 2% paraformaldehyde at 4°C for 1 hour. Single-cell suspensions of stained cells were analyzed in a FACS (Beckman Coulter, Taipei, Taiwan). Double-stained cells (PKH26 and PKH67 labeling) were characterized as fused cells between MSCs and NPCs.
We assessed whether our data met the assumption for normal distribution by performing the Kolmogorov-Smirnov test. Our data met the assumption for normal distribution (p = 0.542). The relative gene expression levels were compared between MSCs and cocultured cells and between NPCs and cocultured cells by using the two-tailed Student’s t test. Variations among MSCs, NPCs, and cocultured cells regarding cell growth and telomerase activity were compared by ANOVA and post hoc testing using Bonferroni multiple comparisons. The values were expressed as the mean ± standard deviation.
Results
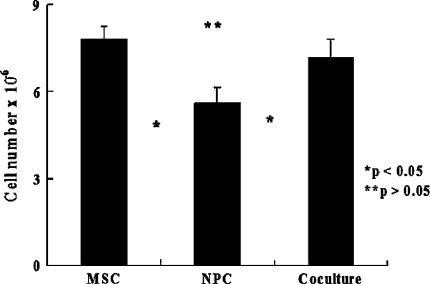
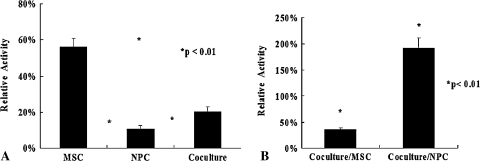
The number of cells increased gradually in all the culture groups. The cell growth was greater in NPCs cocultured with MSCs than in those cultured alone (MSCs versus NPCs, p = 1.14 × 10⁻⁵; MSCs versus cocultured cells, p = 0.24; NPCs versus cocultured cells, p = 3.2 × 10⁻⁴) (Fig. 2). After normalization to the internal control, MSCs cultured alone exhibited the highest telomerase activity, followed by cocultured cells and finally NPCs cultured alone (MSCs versus NPCs, p = 1.2 × 10⁻¹²; MSCs versus cocultured cells, p = 3.5 × 10⁻¹¹; NPCs versus cocultured cells, p = 0.001) (Fig. 3A). We used NPCs and MSCs alone in alginate beads as a control for telomerase activity. The ratios of cocultured cells to MSCs and NPCs were approximately 35.8% (p = 7.5 × 10⁻¹⁴) and 191.7% (p = 5.9 × 10⁻⁷) (Fig. 3B).
Fig. 2.
A graph shows the results of the cell growth assay after coculture for 14 days. The number of cells increased gradually in all the cultured cell groups. The cell growth rate was greater in NPCs cocultured with MSCs than in NPCs cultured alone (MSCs versus NPCs, p = 1.14 × 10⁻⁵; MSCs versus cocultured cells, p = 0.24; NPCs versus cocultured cells, p = 3.2 × 10⁻⁴; n = 6).
Fig. 3A–B.
The graphs show telomerase activity after coculture for 14 days. (A) After normalization to the internal control, MSCs cultured alone exhibited the highest telomerase activity levels. The telomerase activity level was greater in cocultured cells than in NPCs cultured alone (MSCs versus NPCs, p = 1.2 × 10⁻¹²; MSCs versus cocultured cells, p = 3.5 × 10⁻¹¹; NPCs versus cocultured cells, p = 0.001; n = 6). (B) Using NPCs and MSCs alone in alginate beads as a control for calculation, the ratios of cocultured cells to MSCs and NPCs were 35.8% ± 2.8% (p = 7.5 × 10⁻¹⁴, n = 6) and 191.7% ± 20.2% (p = 5.9 × 10⁻⁷, n = 6).
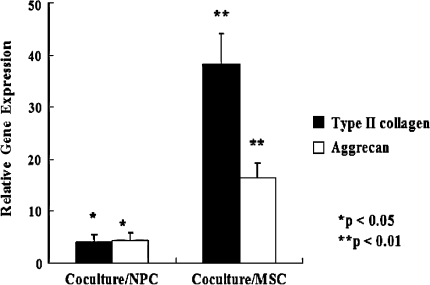
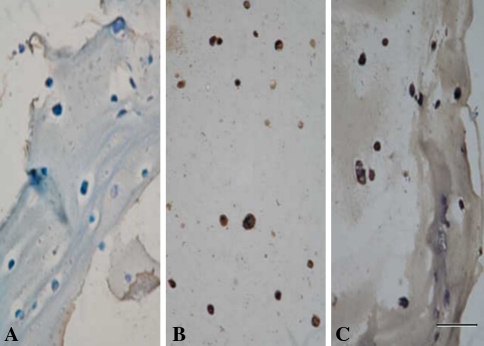
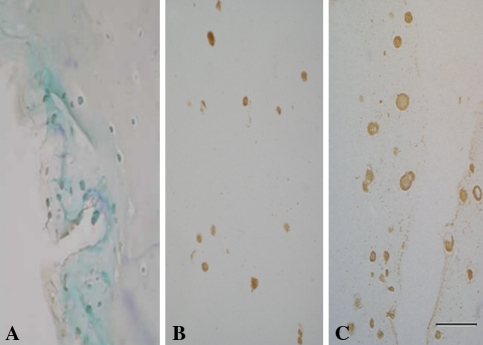
Expression of the Type II collagen and aggrecan genes increased after coculture (Fig. 4). As compared with NPCs and MSCs cultured alone, cocultured cells exhibited elevated expression levels of the Type II collagen gene (4.2-fold greater than the levels in NPCs, p = 0.002; 38.3-fold greater than the levels in MSCs, p = 1.5 × 10⁻⁵) and aggrecan gene (4.4-fold greater than the levels in NPCs, p = 0.002; 16.4-fold greater than the levels in MSCs, p = 3.2 × 10⁻⁵). Immunohistochemical analysis revealed strong staining for Type II collagen in NPCs cultured alone and in a proportion of the cocultured cells (Fig. 5B–C; positive staining, brown) when compared with MSCs cultured alone (Fig. 5A; negative staining, blue). A proportion of the cocultured cells maintained their expression of this collagen type at levels characteristic of NPCs. Immunohistochemical analysis revealed strong KS staining in NPCs cultured alone and cocultured cells (Fig. 6B–C; positive staining, brown) when compared with MSCs cultured alone (Fig. 6A; negative staining, blue). Also, cocultured cells maintained their KS expression at levels characteristic of NPCs.
Fig. 4.
A graph shows relative gene expression levels in NPCs and MSCs after coculture for 14 days. As compared with NPCs and MSCs cultured alone, cocultured cells exhibited elevated levels for the Type II collagen gene (4.2-fold greater than the levels in NPCs, p = 0.002, n = 4; 38.3-fold greater than the levels in MSCs, p = 1.5 × 10⁻⁵, n = 4) and aggrecan gene (4.4-fold greater than the levels in NPCs, p = 0.002, n = 4; 16.4-fold greater than the levels in MSCs, p = 3.2 × 10⁻⁵, n = 4).
Fig. 5A–C.
The photomicrographs illustrate the results of immunohistochemical analysis for Type II collagen. When compared with (A) MSCs, immunohistochemical analysis revealed strong staining for Type II collagen (brown) in (B) NPCs and (C) cocultured cells (Stain, immunostain; original magnification, ×200; size bar, 1 unit = 50 μm).
Fig. 6A–C.
The photomicrographs illustrate the results of immunohistochemical analysis for KS. When compared with (A) MSCs, immunohistochemical analysis revealed strong staining for KS (brown) in (B) NPCs and (C) cocultured cells (Stain, immunostain; original magnification, ×200; size bar, 1 unit = 50 μm).
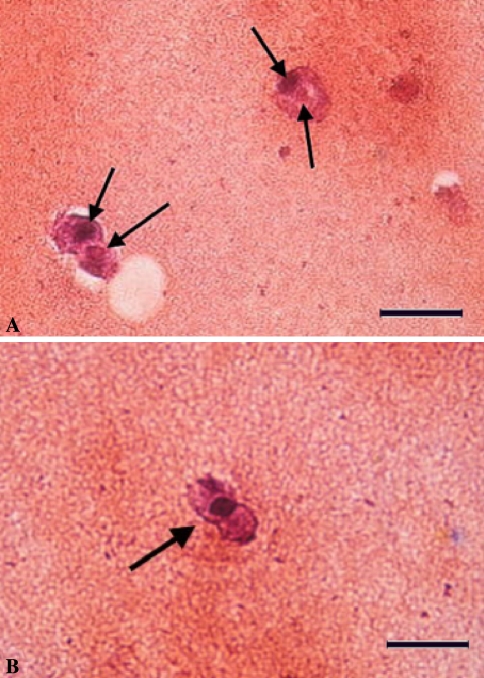
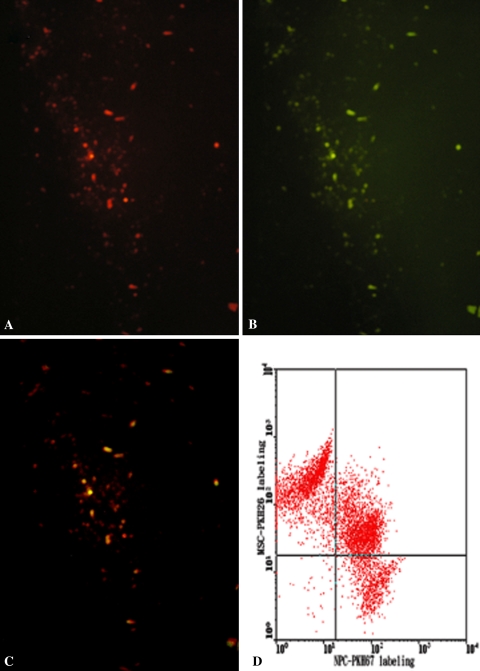
Histologic observation revealed binucleated cells or hybrid nuclei among cocultured cells, thus raising the possibility of cell fusion. Proteoglycan secretion by cocultured cells in the alginate matrix was evident through safranin O staining. Two different types of nuclei were noted in the fused cells (Fig. 7). The detection of cells with two nuclei (Fig. 7A) or hybrid nuclei (Fig. 7B) among cocultured cells raised the possibility of cell fusion. In addition, cells stained with PKH26 as red (Fig. 8A) and PKH67 as green (Fig. 8B) were noted. After coculture of the PKH26- and PKH67-expressing cells, double-stained cells were observed as yellow (Fig. 8C). Immunofluorescence analysis revealed some cocultured cells expressing both PKH dyes were localized at the same position on the slide and could be observed with the same focus; this finding was indicative of cell fusion. Also, the effects of different cell layers overlapping in the images were eliminated by performing FACS analysis (Fig. 8D). The mean percentage of double-stained cells was approximately 42%. The double-stained cells were detected by FACS analysis (Fig. 8D) and fluorescence microscope observation (Fig. 8C). No false-positive results were observed.
Fig. 7A–B.
Histologic observation revealed cell fusion had occurred among cocultured cells. Two different types of nuclei were seen in the fused cells (arrows). The detection of cells with (A) two nuclei or (B) hybrid nuclei among the cocultured cells raised the possibility of cell fusion (Stain, safranin O; original magnification, ×400; size bar, 1 unit = 50 μm).
Fig. 8A–D.
The photomicrographs illustrate in situ cell labeling with PKH to trace cell fusion. (A) PKH26-stained cells (red) and (B) PKH67-stained cells (green) were observed. (C) Some cocultured cells expressed both PKH dyes and were detected at the same position on the slide, with the same focus (yellow) (Original magnification, ×200). (D) A scatterplot shows the detection of PKH-stained cells by cell sorting. FACS analysis revealed approximately 42% of the cocultured cells took up both stains.
Discussion
Spontaneous cell fusion can occur in cocultured stem cells. We therefore asked whether coculture of MSCs and NPCs would result in increased proliferation compared with monoculture alone, increased expression of Type II collagen and aggrecan genes, and spontaneous fusion of the two cell types. Our results suggested cocultured cells exhibited more active growth and telomerase activity than NPCs cultured alone, while maintaining the NPC phenotypes, as confirmed by staining experiments for Type II collagen and KS.
We note several limitations to our study. In some previous studies, nuclear fusion was detected using chromosome painting [34, 40, 42]. Fluorescence in situ hybridization (FISH) analyses were performed using dual-color probes for the X and Y chromosomes, and the results indicated only a few fused cells undergo nuclear fusion [34, 40, 42]. In the current study, we detected cell cytoplasmic fusion using PKH, a lipophilic cell membrane dye. Because of this, the PKH-labeling system could not provide definitive evidence of nuclear fusion among cocultured cells. Cell cytoplasmic fusion and nuclear chromosomal colocalization seem to be two different things. Previous studies [2, 34] showed human MSCs fuse with epithelium cells when they are cocultured. The proportion of binucleated or trinucleated cells increased with the incubation time, which was detected by FACS and time-lapse microscopy, and only a few of the fused cells underwent nuclear fusion, which was detected by FISH analysis. Our data revealed the cell fusion rate detected by FACS was greater in our study than in the other studies [2, 34]. A longer incubation time, different labeling system, and different cell type may account for these differences. However, whether the fused cells underwent nuclear fusion in our study is unknown.
The extent of cell-to-cell contact is less for cells cultured in alginate beads than for those cultured in other systems such as pellets. However, several previous findings suggest cells have the capacity to explore the extracellular environment and establish direct contact with each other by migrating over long distances. Mammalian cells reportedly can build nanotubular highways for organelle transport between cells [25, 29]. The telomerase activity ratios of cocultured cells to MSCs and NPCs were approximately 35.8% and 191.7%. One of the limitations of our study was difficulty in detecting changes in either MSCs or NPCs separately after these cells were cocultured. Histologic observation revealed two nuclei (Fig. 7A) or hybrid nuclei (Fig. 7B) among cocultured cells. We could not identify pure populations of NPCs or MSCs from the coculture system owing to cell fusion. Thus, detecting changes in either MSCs or NPCs individually is impossible when these cells are cocultured.
MSCs are undifferentiated cells present in small numbers in the bone marrow. Their ability to differentiate is governed primarily by their surrounding environment [19, 41]. Conditions favorable for inducing MSCs to undergo osteogenesis, chondrogenesis, and adipogenesis are well established [31]; however, no study thus far has reported the induction of MSCs to differentiate into NPCs or annulus fibrosus cells. Increasing evidence has suggested some stem cell populations exhibit a remarkable degree of plasticity after they are transplanted in recipients [11, 33, 37, 39, 41, 45]. After stem cell transplantation, uncommitted progenitors may undergo transdifferentiation or reprogramming if they find themselves in a new stem cell niche. The ability of stem cells to respond to differentiation signals may be influenced by their neighboring cells and their differentiating daughter cells [42]. These previous study results led us to develop a coculture system using NPCs as the neighboring cells. Regeneration of the NPC tissue by cocultured cells is important not only for achieving the required anatomic morphology but also for restoring tissue function. Thus, the coculture conditions should be optimized for the cells to retain their mechanical functions and original phenotypes. We used alginate as the matrix in the coculture system; this enabled us to coculture NPCs and MSCs at a high cell density while maintaining their three-dimensional morphology. NPCs were found to retain their original phenotype in the coculture, as reflected by the expression levels of Type II collagen (Fig. 5C) and KS (Fig. 6C) genes. In addition, our real-time RT-PCR data revealed the expression levels of Type II collagen and aggrecan genes increased considerably after coculture (Fig. 4). Thus, our results collectively revealed MSCs had a trophic effect on NPCs. This may be because MSCs secrete various cytokines and growth factors that have the potential to stimulate mitosis and the intrinsic reparative potential of the host cells [5]. Yamamoto et al. [45] observed viability and proliferation of NPCs were enhanced by cell-to-cell contact with MSCs in a coculture system; this finding supported the possibility that MSCs have a trophic effect on NPCs.
We found MSCs cultured alone had the highest level of telomerase activity, whereas NPCs exhibited the lowest level. This result was consistent with the result in a previous report stating the telomerase activity level is high in early progenitor stem cells directly isolated from bone marrow but low in primitive and mature cells [9]. Disc cells have limited regeneration potential [20]. Cocultured cells exhibited higher levels of telomerase activity than NPCs (Fig. 3) and may have been responsible for enhanced cell growth (Fig. 2). This finding can be exploited for application of cocultured cells in IVD regeneration therapy.
Cell fusion is a fundamental process in the development and physiology of multicellular organisms; however, little is known regarding the underlying mechanisms. Numerous studies suggest cell fusion may be responsible for the plasticity and tissue regeneration potential of adult stem cells [2, 7, 8, 34, 39, 46]. Cell or nuclear fusion may account for the coexpression of donor and recipient cell markers [2, 34, 40, 42]. The detection of cells with two nuclei (Fig. 7A) or hybrid nuclei (Fig. 7B) among cocultured cells during histologic observation raised the possibility of cell fusion. To confirm that cell fusion had occurred, we performed immunofluorescence analysis: the results revealed some cocultured cells had taken up both PKH dyes, were localized at the same position on the slide, and could be detected with the same focus (Fig. 8C). We also quantified the double-stained cells by performing FACS analysis (Fig. 8D). The lipophilic dye PKH is a nonradioactive and noncytotoxic substance and possesses a fluorescence half-life of more than 100 days in erythrocytes [31] or MSCs [39]. The fluorescence emitted by cells attributable to PKH uptake is not transferred to the neighboring cells but is transferred to the daughter cells during division [31, 32, 38]. Thus, the double-stained cells observed in the coculture may have been generated by spontaneous cell fusion of the MSCs (red fluorescent marker) and NPCs (green fluorescent marker). In addition, the telomerase activity levels were greater in cocultured cells than in NPCs cultured alone but lower than in MSCs cultured alone (Fig. 3). Reconstitution of telomerase activity via fusion of telomerase-negative and telomerase-positive cells has been reported [15, 36]. In light of these previous reports, it appears our results can be attributed to fusion of MSCs and NPCs in our coculture system. After fusion, the hybrid genomes underwent reprogramming, with genes either being activated or silenced such that the expression profiles produced resembled those of NPCs.
Our results revealed NPCs and MSCs cocultured in alginate have great potential applications for disc regeneration because cocultured cells exhibited more active growth and telomerase activity than NPCs cultured alone, while maintaining the NPC phenotypes, as confirmed by staining experiments for Type II collagen and KS. However, the long-term effects of telomerase expression on somatic cells in vitro and in vivo remain unknown. Telomerase expression is associated with the progression of cancer and endogenous upregulation of hTERT gene expression by the protooncogene cMyc [6]. Thus, the possibility of malignant transformation arises when somatic cells are engineered to continually express telomerase for use in cell and gene therapy. Conversely, certain stem cells or germline populations positively express telomerase and have long or indefinite lifespans, illustrating telomerase expression does not necessarily induce oncogenesis [4, 9, 43].
Our data suggest the use of NPCs and MSCs cocultured in a three-dimensional matrix culture system can increase cell growth and partially maintain the phenotype of NPCs. Transplantation of cocultured MSCs and NPCs may constitute a potential therapeutic tissue-engineering strategy for treatment of IVD degeneration.
Footnotes
One or more of the authors (CCN) have received funding from grants from the National Science Council and Chang Gung Memorial Hospital, Taiwan, Republic of China.
Each author certifies that his or her institution has approved the animal protocol for this investigation and that all investigations were conducted in conformity with ethical principles of research.
References
- 1.Aguiar DJ, Johnson SL, Oegema TR Jr. Notochordal cells interact with nucleus pulposus cells: regulation of proteoglycan synthesis. Exp Cell Res. 1999;246:129–137. [DOI] [PubMed]
- 2.Alvarez-Dolado M, Pardal R, Garcia-Verdugo JM, Fike JR, Lee HO, Pfeffer K, Lois C, Morrison SJ, Alvarez-Buylla A. Fusion of bone-marrow-derived cells with Purkinje neurons, cardiomyocytes and hepatocytes. Nature. 2003;425:968–973. [DOI] [PubMed]
- 3.Askenasy N, Farkas DL. Optical imaging of PKH-labeled hematopoietic cells in recipient bone marrow in vivo. Stem Cells. 2002;20:501–513. [DOI] [PubMed]
- 4.Bodnar AG, Ouellette M, Frolkis M, Holt SE, Chiu CP, Morin GB, Harley CB, Shay JW, Lichtsteiner S, Wright WE. Extension of life span by introduction of telomerase into normal human cells. Science. 1998;279:349–352. [DOI] [PubMed]
- 5.Caplan AI, Dennis JE. Mesenchymal stem cells as trophic mediators. J Cell Biochem. 2006;98:1076–1084. [DOI] [PubMed]
- 6.Cerni C. Telomeres, telomerase, and myc: an update. Mutat Res. 2000;462:31–47. [DOI] [PubMed]
- 7.Chen EH, Olson EN. Unveiling the mechanisms of cell-cell fusion. Science. 2005;308:369–373. [DOI] [PubMed]
- 8.Chen KA, Laywell ED, Marshall G, Walton N, Zheng T, Steindler DA. Fusion of neural stem cells in culture. Exp Neurol. 2006;198:129–135. [DOI] [PubMed]
- 9.Chiu CP, Dragowska W, Kim NW, Vaziri H, Yui J, Thomas TE, Harley CB, Lansdorp PM. Differential expression of telomerase activity in hematopoietic progenitors from adult human bone marrow. Stem Cells. 1996;14:239–248. [DOI] [PubMed]
- 10.Crevensten G, Walsh AJ, Ananthakrishnan D, Page P, Wahba GM, Lotz JC, Berven S. Intervertebral disc cell therapy for regeneration: mesenchymal stem cell implantation in rat intervertebral discs. Ann Biomed Eng. 2004;32:430–434. [DOI] [PubMed]
- 11.Farndale RW, Buttle DJ, Barrett AJ. Improved quantitation and discrimination of sulphated glycosaminoglycans by use of dimethylmethylene blue. Biochim Biophys Acta. 1986;883:173–177. [DOI] [PubMed]
- 12.Gruber HE, Norton HJ, Hanley EN Jr. Anti-apoptotic effects of IGF–1 and PDGF on human intervertebral disc cells in vitro. Spine. 2000;25:2153–2157. [DOI] [PubMed]
- 13.Guehring T, Omlor GW, Lorenz H, Bertram H, Steck E, Richter W, Carstens C, Kroeber M. Stimulation of gene expression and loss of annular architecture caused by experimental disc degeneration: an in vivo animal study. Spine. 2005;30:2510–2515. [DOI] [PubMed]
- 14.Horner HA, Roberts S, Bielby RC, Menage J, Evans H, Urban JP. Cells from different regions of the intervertebral disc: effect of culture system on matrix expression and cell phenotype. Spine. 2002;27:1018–1028. [DOI] [PubMed]
- 15.Ishii Y, Tsuyama N, Maeda S, Tahara H, Ide T. Telomerase activity in hybrids between telomerase-negative and telomerase-positive immortal human cells is repressed in the different complementation group but not in the same complementation group of immortality. Mech Ageing Dev. 1999;110:175–193. [DOI] [PubMed]
- 16.Kim KW, Lim TH, Kim JG, Jeong ST, Masuda K, An HS. The origin of chondrocytes in the nucleus pulposus and histological findings associated with the transition of a notochordal nucleus pulposus to a fibrocartilaginous nucleus pulposus in intact rabbit intervertebral discs. Spine. 2003;28:982–990. [DOI] [PubMed]
- 17.Kroeber MW, Unglaub F, Wang H, Schmid C, Thomsen M, Nerlich A, Richter W. New in vivo animal model to create intervertebral disc degeneration and to investigate the effects of therapeutic strategies to stimulate disc regeneration. Spine. 2002;27:2684–2690. [DOI] [PubMed]
- 18.Kuiper JL, Verbeek JH, Frings-Dresen MH, Ikkink AJ. Keratan sulfate as a potential biomarker of loading of the intervertebral disc. Spine. 1998;23:657–663. [DOI] [PubMed]
- 19.Meyerson M. Role of telomerase in normal and cancer cells. J Clin Oncol. 2000;18:2626–2634. [DOI] [PubMed]
- 20.Morrison SJ, Shah NM, Anderson DJ. Regulatory mechanisms in stem cell biology. Cell. 1997;88:287–298. [DOI] [PubMed]
- 21.Nishida K, Kang JD, Gilbertson LG, Moon SH, Suh JK, Vogt MT, Robbins PD, Evans CH. Modulation of biologic activity of the rabbit intervertebral disc by gene therapy: an in vivo study of adenovirus-mediated transfer of the human transforming growth factor beta1 encoding gene. Spine. 1999;24:2419–2425. [DOI] [PubMed]
- 22.Nishida K, Kang JD, Suh JK, Robbins PD, Evans CH, Gilbertson LG. Adenovirus-mediated gene transfer to nucleus pulposus cells: implications for the treatment of intervertebral disc degeneration. Spine. 1998;23:2437–2443. [DOI] [PubMed]
- 23.Nishimura K, Mochida J. Percutaneous reinsertion of the nucleus pulposus: an experimental study. Spine. 1998;23:1531–1539. [DOI] [PubMed]
- 24.Okuma M, Mochida J, Nishimura K, Sakabe K, Seiki K. Reinsertion of stimulated nucleus pulposus cells retards intervertebral disc degeneration: an in vitro and in vivo experimental study. J Orthop Res. 2000;18:988–997. [DOI] [PubMed]
- 25.Onfelt B, Nedvetzki S, Yanagi K, Davis DM. Cutting edge: membrane nanotubes connect immune cells. J Immunol. 2004;173:1511–1513. [DOI] [PubMed]
- 26.Parsch D, Brümmendorf TH, Richter W, Fellenberg J. Replicative aging of human articular chondrocytes during ex vivo expansion. Arthritis Rheum. 2002;46:2911–2916. [DOI] [PubMed]
- 27.Piera-Velazquez S, Jimenez SA, Stokes DG. Increased life span of human OA chondrocytes by exogenous expression of telomerase. Arthritis Rheum. 2002;46:683–693. [DOI] [PubMed]
- 28.Richardson SM, Walker RV, Parker S, Rhodes NP, Hunt JA, Freemont AJ, Hoyland JA. Intervertebral disc cell-mediated mesenchymal stem cell differentiation. Stem Cells. 2006;24:707–716. [DOI] [PubMed]
- 29.Rustom A, Saffrich R, Markovic I, Walther P, Gerdes HH. Nanotubular highways for intercellular organelle transport. Science. 2004;303:1007–1010. [DOI] [PubMed]
- 30.Sakai D, Mochida J, Yamamoto Y, Nomura T, Okuma M, Nishimura K, Nakai T, Ando K, Hotta T. Transplantation of mesenchymal stem cells embedded in Atelocollagen gel to the intervertebral disc: a potential therapeutic model for disc degeneration. Biomaterials. 2003;24:3531–3541. [DOI] [PubMed]
- 31.Samlowski WE, Robertson BA, Draper BK, Prystas E, McGregory JR. Effects of supravital fluorochromes used to analyze the in vivo homing of murine lymphocytes on cellular function. J Immunol Methods. 1991;144:101–115. [DOI] [PubMed]
- 32.Sato M, Asazuma T, Ishihara M, Ishihara M, Kikuchi T, Kikuchi M, Fujikawa K. An experimental study of the regeneration of the intervertebral disc with an allograft of cultured annulus fibrosus cells using a tissue-engineering method. Spine. 2003;28:548–553. [DOI] [PubMed]
- 33.Solchaga LA, Johnstone B, Yoo JU, Goldberg VM, Caplan AI. High variability in rabbit bone marrow-derived mesenchymal cell preparations. Cell Transplant. 1999;8:511–519. [DOI] [PubMed]
- 34.Spees JL, Olson SD, Ylostalo J, Lynch PJ, Smith J, Perry A, Peister A, Wang MY, Prockop DJ. Differentiation, cell fusion, and nuclear fusion during ex vivo repair of epithelium by human adult stem cells from bone marrow stroma. Proc Natl Acad Sci USA. 2003;100:2397–2402. [DOI] [PMC free article] [PubMed]
- 35.Terada N, Hamazaki T, Oka M, Hoki M, Mastalerz DM, Nakano Y, Meyer EM, Morel L, Petersen BE, Scott EW. Bone marrow cells adopt the phenotype of other cells by spontaneous cell fusion. Nature. 2002;416:542–545. [DOI] [PubMed]
- 36.Thompson JP, Oegema TR Jr, Bradford DS. Stimulation of mature canine IVD by growth factor. Spine. 1991;16:253–260. [DOI] [PubMed]
- 37.Tominaga K, Olgun A, Smith JR, Pereira-Smith OM. Genetics of cellular senescence. Mech Ageing Dev. 2002;123:927–936. [DOI] [PubMed]
- 38.Tomita M, Adachi Y, Yamada H, Takahashi K, Kiuchi K, Oyaizu H, Ikebukuro K, Kaneda H, Matsumura M, Ikehara S. Bone marrow-derived stem cells can differentiate into retinal cells in injured rat retina. Stem Cells. 2002;20:279–283. [DOI] [PubMed]
- 39.Ueng SW, Lee MS, Lin SS, Chan EC, Liu SJ. Development of a biodegradable alginate carrier system for antibiotics and bone cells. J Orthop Res. 2007;25:62–72. [DOI] [PubMed]
- 40.Vassilopoulos G, Wang PR, Russell DW. Transplanted bone marrow regenerated liver by cell fusion. Nature. 2003;422:901–904. [DOI] [PubMed]
- 41.Vignery A. Osteoclasts and giant cells: macrophage-macrophage fusion mechanism. Int J Exp Pathol. 2000;81:291–304. [DOI] [PMC free article] [PubMed]
- 42.Wang X, Willenbring H, Akkari Y, Torimaru Y, Foster M, Al-Dhalimy M, Lagasse E, Finegold M, Olson S, Grompe M. Cell fusion is the principal source of bone-marrow-derived hepatocytes. Nature. 2003;422:897–901. [DOI] [PubMed]
- 43.Watt FM, Hogan BL. Out of Eden: stem cells and their niches. Science. 2000;287:1427–1430. [DOI] [PubMed]
- 44.Wright WE, Piatyszek MA, Rainey WE, Byrd W, Shay JW. Telomerase activity in human germline and embryonic tissues and cells. Dev Genet. 1996;18:173–179. [DOI] [PubMed]
- 45.Yamamoto Y, Mochida J, Sakai D, Nakai T, Nishimura K, Kawada H, Hotta T. Upregulation of the viability of nucleus pulposus cells by bone marrow-derived stromal cells: significance of direct cell-to-cell contact in coculture system. Spine. 2004;29:1508–1514. [DOI] [PubMed]
- 46.Ying QL, Nichols N, Evans EP, Smith AG. Changing potency by spontaneous fusion. Nature. 2002;416:545–548. [DOI] [PubMed]


