

Abstract
Background
Multivariate pattern analysis is an alternative method of analyzing fMRI data, which is capable of decoding distributed neural representations. We applied this method to test the hypothesis of the impairment in distributed representations in schizophrenia. We also compared the results of this method with traditional GLM-based univariate analysis.
Methods
19 schizophrenia and 15 control subjects viewed two runs of stimuli--exemplars of faces, scenes, objects, and scrambled images. To verify engagement with stimuli, subjects completed a 1-back matching task. A multi-voxel pattern classifier was trained to identify category-specific activity patterns on one run of fMRI data. Classification testing was conducted on the remaining run. Correlation of voxel-wise activity across runs evaluated variance over time in activity patterns.
Results
Patients performed the task less accurately. This group difference was reflected in the pattern analysis results with diminished classification accuracy in patients compared to controls, 59% and 72% respectively. In contrast, there was no group difference in GLM-based univariate measures. In both groups, classification accuracy was significantly correlated with behavioral measures. Both groups showed highly significant correlation between inter-run correlations and classification accuracy.
Conclusions
Distributed representations of visual objects are impaired in schizophrenia. This impairment is correlated with diminished task performance, suggesting that decreased integrity of cortical activity patterns is reflected in impaired behavior. Comparisons with univariate results suggest greater sensitivity of pattern analysis in detecting group differences in neural activity and reduced likelihood of non-specific factors driving these results.
Keywords: schizophrenia, fMRI, visual processing, distributed representation, visual association cortex, multivariate pattern analysis
INTRODUCTION
Modern theories on the nature of neural representation have emphasized a connectionist view in which representations are emergent properties of coordinated and distributed neural activity (1, 2). Influenced by these insights and the availability of methods capable of measuring combinatorial patterns of activity, we examined the proposition that schizophrenia involves impairment in the stable and reliable activation of distributed representations.
Traditionally, functional neuroimaging studies have relied on univariate analysis, which examines each voxel in isolation and is primarily designed to identify regions showing differential activity between conditions and groups. These studies have been invaluable in identifying and focusing attention on specific brain regions in the pathophysiology of schizophrenia (3, 4, 5, 6). However, univariate methods provide limited information regarding the distributed nature of neural processing. While there is a growing number of studies in schizophrenia which have highlighted the relevance of large scale connectivity across distant regions (7, 8, 9, 10), there have been few studies on another potentially important aspect of distributed processing, namely the coding of information in distributed patterns of activity within a local region.
Basic cognitive neuroscience has begun to develop approaches capable of assessing, in a combinatorial or multivariate manner, the distribution of voxels providing optimal differentiation of distinct brain states. In a series of studies, Haxby and colleagues demonstrated that the representation of specific categories of visual objects are coded by category-specific pattern of activity within the visual association cortex (11, 12). Recently, it has been recognized that methods for automated recognition of spatial patterns, which have been widely employed in other fields, e.g. biometrics, can be fruitfully applied to functional neuroimaging (13, 14). In studies with healthy subjects, it has been shown that pattern analysis algorithms can accurately identify activity pattern associated with specific perceptual states (11, 12, 15, 16, 17). The viewing of different categories of stimuli is represented as distinct patterns of activity in the visual cortex and, conversely, these patterns can be decoded to identify the category of objects being viewed. The development of these methods has implications for schizophrenia as they may be more amenable than traditional methods to addressing hypotheses based on a distributed connectionist model of brain functioning (13, 14).
In this study, we applied a multivariate pattern analysis algorithm to test the hypothesis that distributed perceptual representations are impaired in schizophrenia. We studied a cohort of subjects with schizophrenia and a healthy control group while they viewed exemplars from diverse categories of visual stimuli (Fig. 1). A multi-voxel pattern analysis program was trained to identify category-specific fMRI activity patterns and then to classify an independent set of fMRI data. The main dependent measure was the program’s accuracy in this decoding. High classification accuracy denotes the presence of category-specific canonical pattern of activity and the stable engagement of this pattern. We predicted high classification accuracy for control subjects. For patients, we predicted lower classification accuracy, reflecting impaired coordinated neural activity supporting distributed representations. We assessed the stability of the category-specific patterns by quantifying the voxel-wise correlation in activity over time and predicted that patients would show diminished inter-run correlations. And finally, we conducted a parallel set of univariate GLM-based analyses to assess the presence of non-specific activation differences between groups and to provide insights into differential sensitivity between the two methods in detecting group differences.
Figure 1. Visual Processing Task.

The subjects were shown a series of exemplars of four categories of visual objects—faces (F), scenes (S), everyday objects (O), and scrambled images of everyday objects (Sc). Within each category block, 20 exemplars were shown. In order to verify task engagement, the subjects were required to conduct a 1-back match. A fixation baseline (B) was displayed between series of category blocks.
METHODS
Subjects
19 individuals with schizophrenia (SZ) and 15 healthy controls (C) were studied. Demographic and clinical data are displayed in Table 1. Data from a subset of these subjects have been published in a separate study (18). Patients were clinically stable and outpatients. Diagnostic status was evaluated with the SCID-TR conducted by master or doctoral-level clinicians and confirmed by consensus conference. Symptoms were quantified with the BPRS, SANS, SAPS, Strauss Carpenter Outcome Scale (SCOS), and Global Assessment Scale (GAS). All patients were taking anti-psychotics with all but one taking atypical neuroleptics. Exclusion criteria for all were: IQ < 70, drug or alcohol dependence or abuse within three months of testing, major medical or neurological illness, significant head trauma, or contraindication to MRI. Exclusion criteria for controls were lifetime diagnosis of Axis I disorder or first-degree relative with a psychotic disorder. Groups were well matched except in years of education, 13.0. ± 1.9 vs. 15.9 ± 2.6, SZ and C respectively, p < 0.05; and IQ, 95.5 ± 13.7 vs. 110.3 ± 6.7, SZ and C respectively, p < 0.05. After description of the study, written informed consent was obtained from all subjects. This study was approved by the IRB at the University of California Davis.
Table 1.
Subject Demographics and Clinical.
| Patient (N=19) | Control (N=15) | p | |||
|---|---|---|---|---|---|
| Mean | SD | Mean | SD | > .10 | |
| Age (years) | 33.4 | 11.1 | 28.2 | 7.4 | > .10 |
| Gender (%male) | 68 | 53 | > .10 | ||
| Handedness (% right) | 95 | 100 | > .10 | ||
| WRAT | 95.5 | 13.7 | 110.3 | 6.8 | < .05* |
| Education (years) | 13.0 | 1.9 | 15.9 | 2.6 | < .05* |
| Parental Education (years) | 12.9 | 3.0 | 14.9 | 3.6 | > .10 |
| GAS | 59.7 | 9.1 | |||
| SCOS | 9.9 | 3.7 | |||
| SANS | 1.53 | .81 | |||
| SAPS | 1.56 | 1.04 | |||
| BPRS | 44.5 | 11.2 | |||
| Mediations (atypical/typical) | 18/1 | ||||
Activation Paradigm
Stimuli were presented and responses recorded with E-Prime (http://www.pstnet.com). Within each run, there were four series of stimulus blocks and in each series there were four blocks of stimuli, Fig. 1. Within a block, 20 exemplars of faces, scenes, every day objects, and scrambled images of everyday objects were displayed. The series were interleaved with a baseline period consisting of a cross hair displayed on a blank background for 24 sec. Each subject underwent two runs of this paradigm. To obtain on-line verification that subjects were attending to the stimuli, subjects were required to press two fingers on the response pad when the current image was the same as the image immediately preceding it.
MRI Data Acquisition and Pre-Processing
Images were acquired with a GE Signa 1.5T MRI system using a single-shot T2*-weighted EPI in the AC-PC aligned axial plane with TR of 2.0 seconds, an TE of 32 ms and a flip angle of 90°. 27 interleaved slices for whole-brain coverage were collected with a 22-cm field of view, slice thickness of 4.0 mm and a gap of 0.5 mm, and in-plane resolution of 3.5 × 3.5 mm. fMRI processing was conducted using SPM2 and included slice time correction and 6 parameter rigid body spatial realignment. All subjects displayed less than 4 mm of movements and the groups did not differ either in cumulative [F (6,27) = 1.36 p = = .265] or mean movements [F (6, 27) = 1.37 p = .262]. To better preserve the spatial configuration of activations in individual subjects, images were not smoothed or spatially normalized into a common space. Coplanar, T1-weighted scans with 0.88 × 0.88 mm in-plane resolution were acquired just prior to functional images.
Behavioral Data Analysis
The “hit rate” performance (number of correct responses during the presentation of a 1-back divided by the total number of 1-back matches) and RT for hits were used to evaluate performance.
Multivariate Pattern Analysis
Data analysis was conducted using the Princeton Multi-Voxel Pattern Analysis (MVPA) toolbox (http://www.csbmb.princeton.edu/mvpa) following the methods described in Polyn et al. (17). Details of the method can be found in the MVPA website and in the supplement to Polyn’s paper. In addition, two recent reviews on this method have recently been published (13, 14). The analysis involved 3 main stages: Feature selection, and training and testing of the automated classifier. Prior to these steps, the images underwent voxel-wise z-scoring of intensity values to account for baseline drift and shifting condition regressors by 6 seconds to account for hemodynamic delay in the BOLD signal.
Feature Selection
An anatomic mask was used to constrain the region in which the multivariate and univariate analyses were conducted. This mask, defined by the union of the parahippocampal, lingual and fusiform gyri, limited the analysis to visual regions most active during visual object processing (18, 19). The boundaries of these regions were defined according to Duvernoy (20, 21). The anatomical masks were drawn by a single rater blind to diagnosis on T1 coplanar images acquired right before EPI scans for each subject. We conducted test-retest reliability analysis on 10 randomly selected subjects. The Spearman Brown coefficient was 0.90. Within this region, the feature space was further restricted by eliminating voxels with low task-related activity assessed by a voxel-wise ANOVA of BOLD intensity across all conditions (face, scene, objects, scrambled images, and baseline). These less informative voxels serve as sources of noise and thus impair detection of classifiable patterns. Those voxels active at a threshold of p < .001, uncorrected, were retained for inclusion in the subsequent classification analysis. This area contained an average of 346 voxels per subject (SD=127).
Training and Testing
These stages were carried out using a linear pattern classifier following a full cross-validation design: data from run 1 was used to feature select and train the classifier, which was then tested on data from run 2, and then run 2 data was used to features select and train the classifier, which then tested data from run 1. We employed a two-level (input and output) backpropogation neural network (NN) classifier. The input layer consisted of one unit for each voxel in the feature-selected image. The output layer consisted of units for each of the five stimulus categories.
During training, data from one run, with each TR labeled by condition, was fed into the NN. Using a conjugate gradient variant of the backpropogation classifier, the weights between input and output layers were adjusted using a minimum square error algorithm between target categorization and actual categorization. In this way, over many iterations of weight adjustment, the classifier “learned” the pattern of activation of each stimulus category. These weighted connections were then applied during testing to data from the remaining run. Each input of a TR’s activation pattern resulted in an output layer activation pattern, with the maximally active output unit being recorded as the classifiers guess of the condition of that TR. Accuracy of the classifiers guesses during this testing stage (1 for correct, 0 for incorrect) was averaged across all TR’s of each stimulus type.
Inter-run correlations of activity
A secondary analysis, what we refer to as the inter-run correlations of category-specific activity patterns, evaluated the stability of activity for each stimulus type across the two runs. Activity patterns for each category were represented by a voxel-wise statistical map of p-values generated from an ANOVA of the BOLD signal. The ANOVA contrasted each scan’s signal during the condition of interest to all other timepoints. The ANOVA was restricted to the mask of the visual regions described above. Activity of each voxel was represented by its p-value in a vector with a length defined by the number of voxels in the anatomic mask. A vector of this form was generated for each run and stimulus-type. Bivariate Pearson’s product-moment correlations were then calculated across the stimulus-specific maps for the two runs. This correlation value represented the across-run functional stability, quantified for each stimulus type.
Univariate Analysis
We conducted a parallel set of analyses using univariate GLM-based methods so that we could compare these results with those from the multivariate pattern analysis. We chose to analyze faces because the neural correlate of face processing has been an increasingly common area of research in schizophrenia and our prior work (18), which showed relatively normal univariate measures of fusiform face area (FFA) activity, suggested that comparisons between multivariate and univariate analyses of face processing may provide a good test of the former’s sensitivity. We analyzed the same images pre-processed for multivariate analysis, meaning after slice time correction and realignment, images were not spatially smoothed or transformed into a standard space. Instead, analysis proceeded in the subject’s “native space” (18, 19). Univariate analysis was conducted in Voxbo (www.voxbo.org). The convolution matrix included a time-domain representation of the 1/f power structure (22, 23), a low pass filter to remove frequencies above 0.45 Hz and nuisance covariates to model an intercept and global signal orthogonal to the covariates of interest. Activity was estimated using a 4-covariate model, a covariate for each of the stimulus categories, convolved with a canonical hemodynamic response function. We performed linear contrasts of faces minus scenes and face minus objects to identify face specific voxels within the anatomically defined region described above, thresholded at a t-value corresponding to p < 0.05, Bonferroni correction for multiple comparisons (24). The dependent measures were the maximum and mean parameter estimates (i.e. beta values) and volume of the FFA (number of above threshoid voxels). These measures were first calculated for each subject and then they were group averaged for a random effects between group analyses with a two-sample t-tests (18, 19).
RESULTS
Both groups performed the task well, but controls showed significantly higher accuracy than patients, 93% vs. 81% (t = −5.5, p < .001). For all categories, control performance was higher and, for all but the everyday objects, the differences were significant. Controls responded faster but RT differences were not significant (MC = 565ms SDC = 96, MSZ = 617 SDSZ = 117, p = .17). For faces, there was a non-significant difference in reaction time (RT) (t = 1.8, p = .08). These and more detailed results are displayed in Table 2.
Table 2.
Behavioral Results.
| Accuracy--%(SD) | RT—msec(SD) | |||||
|---|---|---|---|---|---|---|
| Controls | SZ | p | Controls | SZ | p | |
| Face | 96 (6) | 86 (17) | 0.02* | 525 (109) | 601 (137) | .08 |
| Scene | 93 (10) | 78 (21) | 0.01* | 569 (109) | 602 (74) | .32 |
| Object | 94 (6) | 89 (19) | 0.26 | 567 (109) | 616 (131) | .25 |
| Scrambled | 86 (11) | 72 (27) | 0.05* | 601 (95) | 651 (198) | .34 |
| Total | 93 (6) | 81 (19) | <0.01* | 565 (96) | 617 (117) | .17 |
Accuracy of the pattern classifier was significantly different between groups (Figure 2). Overall, activity patterns in controls were more accurately classified than in patients, with averages of 71.7% and 58.6% respectively. For all but one category (everyday objects), accuracy was significantly higher for controls, (t > 2.1, p < 0.05). An ANOVA showed a main effect of group [F = 12.2, p < .001]. We reanalyzed the data with the baseline condition excluded and these results were virtually identical to the above results.
Figure 2. Multi-voxel Pattern Analysis Classification Accuracy.

A) The outcome, in terms of proportion of correct classification, for patients and controls across all stimulus types. * Significant difference between groups, 2-tailed t-test, p < .05.
Results in Figure 3 show a significant correlation between classification accuracy across all conditions and behavioral performance. For patients, behavioral accuracy (r (n = 19) = .48, r2 = .23, p < .05) and RT (r (n = 19) = −.48, r2 = .23, p < .05) were significantly correlated. For controls, RT correlated significantly with classification accuracy (r (n = 15) = −.52, r2 = .27, p < .01) but behavioral accuracy did not, possibly due to ceiling effects. The correlation between behavioral performance and pattern classification accuracy remained significant after controlling for possible confounds of age, subject and parental education and WRAT scores: classification accuracy and RT r (df=25) = -.526, r2 = .28, p < .05; classification accuracy and behavioral accuracy r (df = 25) = .505, r2 = .26, p < .05. The pattern classification results did not correlate with any of the clinical measures.
Figure 3. Correlations Between Classification Accuracy and Behavioral Measures.
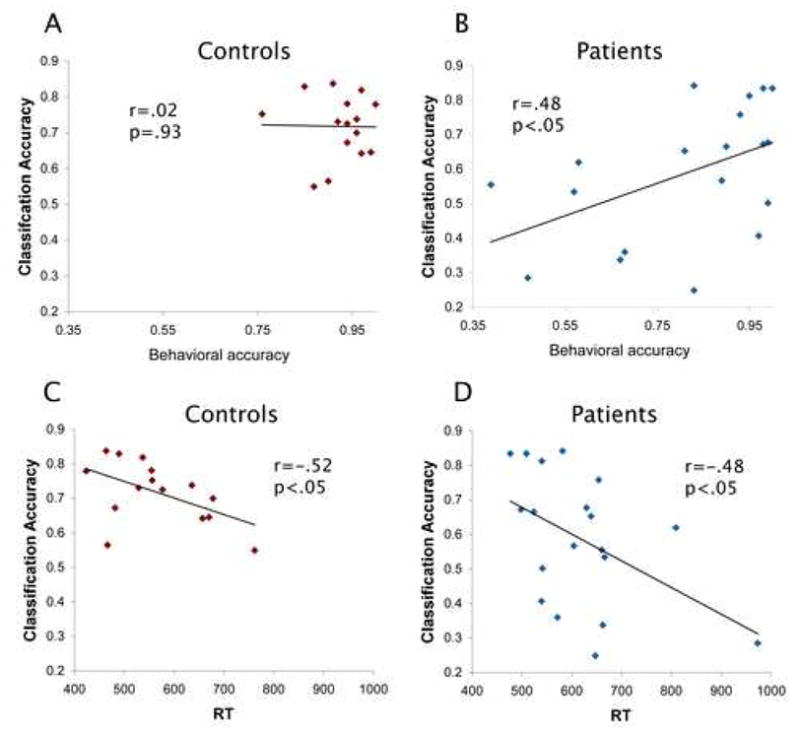
A) Controls and B) patients behavioral accuracy in the 1-back task vs. classification accuracy. C) Controls and D) patients reaction times (RT) in the 1-back task vs. classification accuracy.
To explore the possibility that increased temporal variability in activity contributed to impaired classification in patients, we conducted a secondary analysis measuring the correlation of voxel-wise activity across runs (Figure 4). Results showed that inter-run correlations were lower for patients for all stimulus categories, except objects. This difference was significant for faces (t = −2.4, p < .05) and scenes (t = −2.3, p < .05), but non-significant with baseline (t = −2.0, p = .057). An ANOVA of the inter-run correlations showed a non-significant effect of group [F = 3.7, p = .065]. There was very high correlation between inter-run stability of engagement of activity and classification accuracy in both groups, patients r (n = 19) = .93, r2 = .86, p < .01 and for controls r (n = 15) = .89, r2 = .79, p < .01.
Figure 4. Inter-run Correlation in Univariate Activity.

A) Inter-run correlation values (Pearson’s r) for patients and controls across all stimulus types. * Significant difference between groups, 2-tailed t-test, p < .05.
A univariate, GLM-based analysis of the same data was conducted to examine the impact of non-specific factors in the multivariate results and to allow comparisons between these methods. We focused on faces because we predicted, based on prior results (18), that traditional univariate measures would not yield significant differences between groups, thereby offering a point of contrast between the univariate and pattern classification approaches. In the contrasts of face versus non-face blocks, e.g. face-scenes and face-object, there was no group difference in maximum beta [F (1,32) = .77 p =.39], mean beta [F (1,32) = 1.4 p = .224], or voxel count [F (1,32) = 1.2 p = .25] (Table 3) within regions showing above threshold activity (p > .05, Bonferroni corrected for multiple comparisons). These results suggest that reduced classifier accuracy in patients is not simply due to a non-specific factor, such as reduced signal to noise. These results also highlight a divergence between multivariate and a standard univariate analysis with the former showing group differences in the setting of undetectable differences in the latter.
Table 3.
Univariate Results.
| Contrast | Measure | Group | Mean | Std. Deviation |
|---|---|---|---|---|
| Face-Scene | No. voxels | SZ | 25.2 | 30.7 |
| C | 32.7 | 26.4 | ||
| Mean Beta | SZ | 0.019 | 0.010 | |
| C | 0.022 | 0.008 | ||
| Max. Beta | SZ | 0.066 | 0.053 | |
| C | 0.074 | 0.051 | ||
| Face-Object | No. voxels | SZ | 12.5 | 14.6 |
| C | 19.5 | 14.1 | ||
| Mean Beta | SZ | 0.017 | 0.010 | |
| C | 0.023 | 0.011 | ||
| Max. Beta | SZ | 0.045 | 0.050 | |
| C | 0.065 | 0.043 |
DISCUSSION
The accuracy of a multivariate pattern classifier was high for healthy subjects and in close agreement with other studies (15, 25). Classification accuracy was significantly lower in subjects with schizophrenia. In both groups, there was an inverse correlation between classification accuracy and reaction time, and in the schizophrenia group there was a positive correlation between classification accuracy and behavioral accuracy. Diminished voxel-wise correlation in activity across runs in patients and strong correlation between this measure and classification accuracy suggest that greater variability in engaging canonical activity patterns could be the cause of the lower classification accuracy in patients. There were no differences between groups in the standard GLM-based univariate measurements, demonstrating greater sensitivity of the pattern analysis method. The univariate results also suggest that non-specific factors are not confounding the pattern analysis findings.
These results point to a possible neural mechanism of impaired visual information processing in schizophrenia--the instability of cortical networks and its failure to support coherent representations and their dependent cognitive processes. The relationship between category specific representations, cognition and behavior in healthy subjects was examined in a recent study by Polyn and colleagues (17). This study demonstrated that the time course of engagement of object-specific activity patterns, which has been shifted by 6 sec. to account for the lag in the BOLD signal, precedes the recall of an object. For example, when recalling of a face, the face-specific pattern of activity is engaged prior to the actual response execution. The temporal order of events strongly suggests that the engagement of neural representations shapes the recall process. A logical extension of this model is to propose that the fidelity of representations influences the proper execution of dependent cognitive processes. Accordingly, we interpret our findings as suggesting that the impairment in category-specific canonical representations is the reason that patients cannot perform the matching task and is not merely the reflection of poor performance. The decrement in stability of representations during baseline fixation blocks, where performance is not an issue, is consistent with this supposition. However, these statements about causality must be balanced by an acknowledgement that they are based on correlational results and more definitive empirical studies in the future are required.
An important issue related to the model of information processing deficits in schizophrenia is whether impairments reflect intrinsic neural abnormalities within the visual cortex or are the result of perturbations in top-down influences. Our findings could be accommodated by either model: A top-down account could be consistent with our findings if impaired coherence in activity patterns were due to a deficit in top-down signals and their failure to stabilize posterior networks (1, 26). This potential mechanism is consistent with the task demands of this experiment, the 1-back, which imposes a low working memory load. According to contemporary theories and empirical findings related to PFC interaction with sensory cortex during working memory (2, 19), a top down signal from the PFC modulates activity and facilitates processing within the visual cortex during visual working memory. Consequently, altered top down signals could contribute to impairments in visual networks. According to the bottom-up model, our findings would be further evidence of impaired neural function in sensory cortex, which then gives rise to higher-order processes in a feed-forward manner (27). This study was not designed to compare these competing models and the resolution of this issue will be the subject of future studies.
The comparison between univariate and pattern analysis results revealed some of the advantages of the latter approach, which is often suggested as a more sensitive method (14). The pattern analysis results were consistent with behavioral results and revealed group differences in activity while traditional univariate analysis did not. The divergent findings between analyses cannot be attributed to differences in processing of the fMRI data as they were processed identically across analytic streams. For pattern classification, spatial smoothing or transformation into a common template space is usually avoided to preserve as much spatial resolution as possible. Therefore, to control for possible effects of differences in image processing on our results, we did not follow the common practice of normalization into a standard space for group comparison in the univariate analysis.
Since we controlled for differences in image processing, the inherent differences in the analytic approaches likely account for the divergent results. While univariate analysis identifies strongly and specifically responsive voxels, pattern analysis is sensitive to the spatial combination of voxels. Consequently, a voxel that may be weakly active, i.e. subthreshold in the traditional univariate sense, may in the aggregate or in combination with others provide useful information in the pattern analysis approach (14).
The largely uniform difference between groups across conditions brings up the possibility of non-specific, global factors such as neural excitability as the cause of the differential classification accuracy. This potential confound is addressed by two findings. First, there was an absence of a group differences in the univariate measures of spatial extent and activation levels. Second, in the every day objects category, in the context of very good and nearly equivalent behavioral performance across both groups, there was no significant group difference in classification accuracy and inter-run correlations. If non-specific factors were driving the results, there should be a group difference in all categories. The greater inter-run correlation among patients for this category suggests that the absence of difference is not just due to lack of power.
This study adds to a rapidly growing list of publications documenting impairments in what may be broadly categorized as neural connectivity in schizophrenia (7). Prior reports have identified deficits in long-range connectivity, either structural (28) or functional, with the latter being found during the resting state (8) and during cognitively activated states (9, 10, 29). We interpret the findings of disturbances in distributed representations revealed by pattern classification, as a consequence of impaired local connectivity. While functional neuroimaging studies using traditional univariate analysis have provided very important information on the neural basis of schizophrenia, multivariate pattern analysis may be better suited to questions related to the distributed nature of neural representations and processes. As suggested by this study, the broad application of multi-voxel pattern analysis to schizophrenia may yield novel insights into the underlying neural impairments leading to behavioral and cognitive deficits of this disorder.
Footnotes
FINANCIAL DISCLOSURE
Dr. Yoon, Ms. Tamir, Dr. Minzenberg, Dr. Ursu and Dr. Ragland reported no biomedical financial interests or potential conflicts of interest.
Dr. Carter disclosed consultant fees for Eli Lily and Roche.
Publisher's Disclaimer: This is a PDF file of an unedited manuscript that has been accepted for publication. As a service to our customers we are providing this early version of the manuscript. The manuscript will undergo copyediting, typesetting, and review of the resulting proof before it is published in its final citable form. Please note that during the production process errors may be discovered which could affect the content, and all legal disclaimers that apply to the journal pertain.
References
- 1.Miller EK, Cohen JD. An integrative theory of prefrontal cortex function. Annu Rev Neurosci. 2001;24:167–202. doi: 10.1146/annurev.neuro.24.1.167. [DOI] [PubMed] [Google Scholar]
- 2.Postle BR. Working memory as an emergent property of the mind and brain. Neuroscience. 2006;139:23–38. doi: 10.1016/j.neuroscience.2005.06.005. [DOI] [PMC free article] [PubMed] [Google Scholar]
- 3.Barch DM, Carter CS, Braver TS, et al. Selective deficits in prefrontal cortex function in medication-naive patients with schizophrenia. Arch Gen Psychiatry. 2001;58:280–8. doi: 10.1001/archpsyc.58.3.280. [DOI] [PubMed] [Google Scholar]
- 4.Berman KF, Zec RF, Weinberger DR. Physiologic dysfunction of dorsolateral prefrontal cortex in schizophrenia. II. Role of neuroleptic treatment, attention, and mental effort. Arch Gen Psychiatry. 1986;43:126–35. doi: 10.1001/archpsyc.1986.01800020032005. [DOI] [PubMed] [Google Scholar]
- 5.Callicott JH, Bertolino A, Mattay VS, et al. Physiological dysfunction of the dorsolateral prefrontal cortex in schizophrenia revisited. Cereb Cortex. 2000;10:1078–92. doi: 10.1093/cercor/10.11.1078. [DOI] [PubMed] [Google Scholar]
- 6.Heckers S, Rauch SL, Goff D, et al. Impaired recruitment of the hippocampus during conscious recollection in schizophrenia. Nat Neurosci. 1998;1:318–23. doi: 10.1038/1137. [DOI] [PubMed] [Google Scholar]
- 7.Friston KJ, Frith CD. Schizophrenia: a disconnection syndrome? Clin Neurosci. 1995;3:89–97. [PubMed] [Google Scholar]
- 8.Garrity AG, Pearlson GD, McKiernan K, Lloyd D, Kiehl KA, Calhoun VD. Aberrant “default mode” functional connectivity in schizophrenia. Am J Psychiatry. 2007;164:450–7. doi: 10.1176/ajp.2007.164.3.450. [DOI] [PubMed] [Google Scholar]
- 9.McGuire PK, Frith CD. Disordered functional connectivity in schizophrenia. Psychol Med. 1996;26:663–7. doi: 10.1017/s0033291700037673. [DOI] [PubMed] [Google Scholar]
- 10.Meyer-Lindenberg A, Poline JB, Kohn PD, et al. Evidence for abnormal cortical functional connectivity during working memory in schizophrenia. Am J Psychiatry. 2001;158:1809–17. doi: 10.1176/appi.ajp.158.11.1809. [DOI] [PubMed] [Google Scholar]
- 11.Haxby JV, Gobbini MI, Furey ML, Ishai A, Schouten JL, Pietrini P. Distributed and overlapping representations of faces and objects in ventral temporal cortex. Science. 2001;293:2425–30. doi: 10.1126/science.1063736. [DOI] [PubMed] [Google Scholar]
- 12.O’Toole AJ, Jiang F, Abdi H, Haxby JV. Partially distributed representations of objects and faces in ventral temporal cortex. J Cogn Neurosci. 2005;17:580–90. doi: 10.1162/0898929053467550. [DOI] [PubMed] [Google Scholar]
- 13.Haynes JD, Rees G. Decoding mental states from brain activity in humans. Nat Rev Neurosci. 2006;7:523–34. doi: 10.1038/nrn1931. [DOI] [PubMed] [Google Scholar]
- 14.Norman KA, Polyn SM, Detre GJ, Haxby JV. Beyond mind-reading: multi-voxel pattern analysis of fMRI data. Trends Cogn Sci. 2006;10:424–30. doi: 10.1016/j.tics.2006.07.005. [DOI] [PubMed] [Google Scholar]
- 15.Carlson TA, Schrater P, He S. Patterns of activity in the categorical representations of objects. J Cogn Neurosci. 2003;15:704–17. doi: 10.1162/089892903322307429. [DOI] [PubMed] [Google Scholar]
- 16.Haynes JD, Rees G. Predicting the stream of consciousness from activity in human visual cortex. Curr Biol. 2005;15:1301–7. doi: 10.1016/j.cub.2005.06.026. [DOI] [PubMed] [Google Scholar]
- 17.Polyn SM, Natu VS, Cohen JD, Norman KA. Category-specific cortical activity precedes retrieval during memory search. Science. 2005;310:1963–6. doi: 10.1126/science.1117645. [DOI] [PubMed] [Google Scholar]
- 18.Yoon JH, D’Esposito M, Carter CS. Preserved function of the fusiform face area in schizophrenia as revealed by fMRI. Psychiatry Res. 2006;148:205–16. doi: 10.1016/j.pscychresns.2006.06.002. [DOI] [PubMed] [Google Scholar]
- 19.Ranganath C, DeGutis J, D’Esposito M. Category-specific modulation of inferior temporal activity during working memory encoding and maintenance. Brain Res Cogn Brain Res. 2004;20:37–45. doi: 10.1016/j.cogbrainres.2003.11.017. [DOI] [PubMed] [Google Scholar]
- 20.Duvernoy HM. The human hippocampus: an atlas of applied anatomy. Mèunchen; Bergmann: 1988. [Google Scholar]
- 21.Duvernoy HM, Bourgouin P. In: The human brain: surface, three-dimensional sectional anatomy with MRI, and blood supply, 2nd, completely rev., and enl. Wien, editor. New York: Springer; 1999. [Google Scholar]
- 22.Aguirre GK, Zarahn E, D’Esposito M. The variability of human, BOLD hemodynamic responses. Neuroimage. 1998;8:360–9. doi: 10.1006/nimg.1998.0369. [DOI] [PubMed] [Google Scholar]
- 23.Zarahn E, Aguirre G, D’Esposito M. A trial-based experimental design for fMRI. Neuroimage. 1997;6:122–38. doi: 10.1006/nimg.1997.0279. [DOI] [PubMed] [Google Scholar]
- 24.Postle BR, Zarahn E, D’Esposito M. Using event-related fMRI to assess delay-period activity during performance of spatial and nonspatial working memory tasks. Brain Res Brain Res Protoc. 2000;5:57–66. doi: 10.1016/s1385-299x(99)00053-7. [DOI] [PubMed] [Google Scholar]
- 25.Hanson SJ, Matsuka T, Haxby JV. Combinatorial codes in ventral temporal lobe for object recognition: Haxby (2001) revisited: is there a “face” area? Neuroimage. 2004;23:156–66. doi: 10.1016/j.neuroimage.2004.05.020. [DOI] [PubMed] [Google Scholar]
- 26.Silver MA, Ress D, Heeger DJ. Neural correlates of sustained spatial attention in human early visual cortex. J Neurophysiol. 2007;97:229–37. doi: 10.1152/jn.00677.2006. [DOI] [PMC free article] [PubMed] [Google Scholar]
- 27.Butler PD, Zemon V, Schechter I, et al. Early-stage visual processing and cortical amplification deficits in schizophrenia. Arch Gen Psychiatry. 2005;62:495–504. doi: 10.1001/archpsyc.62.5.495. [DOI] [PMC free article] [PubMed] [Google Scholar]
- 28.Lim KO, Hedehus M, Moseley M, de Crespigny A, Sullivan EV, Pfefferbaum A. Compromised white matter tract integrity in schizophrenia inferred from diffusion tensor imaging. Arch Gen Psychiatry. 1999;56:367–74. doi: 10.1001/archpsyc.56.4.367. [DOI] [PubMed] [Google Scholar]
- 29.Yoon JH, Minzenberg MJ, Ursu S, Walter R, Wendelken C, Ragland JD, Carter CS. Prefrontal cortex dysfunction is associated with disrupted coordinated brain activity in schizophrenia: relationship to impaired cognition, behavioral disorganization and global function. Am J Psychiatry. doi: 10.1176/appi.ajp.2008.07060945. In Press. [DOI] [PMC free article] [PubMed] [Google Scholar]