Abstract
The current lack of suitable probes has limited the in vivo imaging of reactive oxygen/nitrogen species (ROS/RNS). ROS/RNS are often generated by ischemia-induced inflammation; defining the extent of tissue involvement or ROS/RNS-related damage would have a significant clinical impact. We present the preparation and demonstration of a fluorogenic sensor for monitoring peroxynitrite (ONOO−) and myeloperoxidase (MPO) mediated hypochlorous acid (HOCl/OCl−) production. The sensor consists of a long circulating biocompatible nanoparticle that targets phagocytic cells in vivo and is coated with ~400 quenched oxazine fluorophores that are released by reaction with HOCl or ONOO−, but stable towards oxidants such as hydroxyl radical, hydrogen peroxide, and superoxide. MPO-dependent probe activation is chloride ion dependent and is negated in MPO inhibitor treated neutrophils. Flow cytometric profiling, fluorescence reflectance imaging and microscopic fluorescence imaging in mouse hearts after myocardial infarction showed probe release into neutrophil-rich ischemic areas, making this ROS/RNS sensor a novel prognostic indicator.
Introduction
Inflammation is an ubiquitous response to acute or chronic tissue injury. Reactive oxygen and nitrogen species (ROS/RNS) generated during inflammation are causal to or can exacerbate pathogenesis of Alzheimer disease 1,2, atherosclerosis 3, cancer 4–6, ischemia-reperfusion injury in stroke 7, inflammatory bowel disease 8, myocardial infarction 9 and organ transplantation 10. Generation of the majority of ROS species is driven by heavy metal catalyzed oxidation reactions and enzymatically by myeloperoxidase (MPO). MPO is a heme-containing enzyme that mediates production of hypochlorious acid (HOCl/OCl−) from chloride ion (Cl−) and hydrogen peroxide (H2O2). MPO can accommodate and oxidize a number of small molecule substrates that bind to the active site displacing water molecules 11. The promiscuity of the MPO active site and the generation of hydroxyl radicals (OH·) results in secondary oxidation products, including chloramines, tyrosyl radicals (Tyr-O·), and nitrogen dioxide (NO2). These reactive byproducts modify proteins, generate DNA adducts, and alter lipid structure, resulting in the inhibition of various protein function. For instance the MPO/H2O2/Cl− system was recently shown to oxidize the critical N-terminal cysteine of tissue inhibitor of metalloproteinase-1 (i.e. TIMP-1) altering regulation of matrix metalloproteinases12. MPO has been shown to be a biomarker of myocardial infarction (MI) 9 and coronary artery disease 13,14, due to the central role of MPO-dependent protein modification in the pathogenesis cardiovascular diseases. In atherosclerosis, low density lipoprotein (LDL) particles are oxidized by HOCl, chloramines, phenoxyl radical intermediates, peroxynitrite (ONOO−) and MPO-dependent nitrogen dioxide (NO2) production 15–18, driving lipid-laden macrophages to become atherosclerotic foam cells; the core of vulnerable plaques.
Imaging of MPO function and ROS generation in cells and animal models of human diseases has been hampered by the lack of probes with appropriate pharmacokinetics, suitable emission wavelengths to overcome tissue auto-fluorescence, and adequate specificity for relevant ROS. Historically, cellular monitoring ROS/RNS generation was done by absorbance changes accompanying reduction of ferricytochrome c and electron-spin resonance (ESR) assays to measure superoxide formation 19, and more recently H2O2 deprotection of boronate fluorescein or resorufin analogs 20–23. In vivo ROS determination is limited to ESR imaging co-registered to MR imaging using a spin probe such as nitroxyl radicals 24,25, studies from our lab using T1 weighted MR imaging post-injection of a MPO substrate fused to a gadolinium bound chelator that polymerizes upon oxidation 26,27, and, as recently shown, luminol oxidation by MPO/ROS measured by in vivo bioluminescence 28. Tailoring of optical imaging probes for certain ROS/RNS species have been attempted with varied success for measuring nitric oxide 29–33, superoxide/ ˙OH 34, H2O2 20 21–23, ONOO− 35, and HOCl 36,37. But in vivo use of these probes is not practical because most are small molecules with unfavorable washout kinetics, have poor dye properties, and/or are activated by numerous ROS. Here we describe synthesis and characterization of an optical sensor for monitoring ROS/RNS generation (specifically HOCl generated by the MPO/H2O2/Cl− system and ONOO−), which was used to highlight the favorable pharmacokinetics of the nanoparticle conjugate by fluorescence resonance imaging, to assess MPO inhibitor effects by flow cytometry, and to measure HOCl deposition in injured myocardial tissue by microscopic fluorescence imaging. The sensor has the capability of mapping areas rich in HOCl/OCl− and ONOO− that are the direct result of myocardial infarction.
Experimental Section
General Considerations
Oxazine 1, as its perchlorate salt, was purchased from Acros Organics USA (Morris Plains, NJ) and used as received. Alexafluor 488 (AF488) succinimidyl ester was purchased from Molecular Probes. All other chemicals and solvents, unless noted, were purchased from Sigma-Aldrich or Fisher Scientific. Preparative high performance liquid chromatography (HPLC) was performed on a Varian 210 instrument equipped with a 335 diode array detector and a Varian Pursuit XRs 10 C18 250 × 21.2 mm column at a flow rate of 20 mL/min. All 1H (400 MHz) and 13C NMR (100 MHz) nuclear magnetic resonance (NMR) spectra were acquired on a Bruker DPX-400 spectrometer at ambient temperature and were referenced to tetramethylsilane as an internal standard. Absorption spectra were collected on a Varian Cary 50-Bio UV/visible spectrophotometer. For determination of the extinction coefficient of the oxazine fluorophore, fresh stock solutions of the dye were prepared for each trial by dissolution of 2–4 mg portions of the dye, weighed on a Mettler AT201 analytical balance with an error of ±0.01 mg, in PBS, pH 7.4, using a 10 mL volumetric flask. Standard deviations for the extinction coefficient measurements, performed in triplicate, were 5% or less. Fluorescence data were collected on a Varian Cary Eclipse fluorescence spectrophotometer. High-resolution electrospray ionization (ESI) mass spectra were collected on a Bruker Daltonics APEXII 3 T Fourier transform mass spectrometer in the Department of Chemistry Instrumentation Facility at the Massachusetts Institute of Technology
Synthesis of sodium 5-(3,7-bis(diethylamino)-10H-phenoxazin-10-yl)-5-oxopentanoate (intermediate 1)
To oxazine 1 perchlorate (42.4 mg, 0.1 mmol) and glutaric anhydride (114 mg, 1 mmol) in chlorobenzene (0.5 mL) was added triethylamine (279 µL, 2 mmol). The dark blue mixture was heated in a sealed thick-walled pressure tube at 150 °C for 30 min. After cooling the now brown reaction mixture was concentrated by rotary evaporation and the crude product was re-dissolved in DMF (2 mL). Preparative HPLC of the crude reaction using a gradient from 0 to 50% buffer B over 30 min afforded the purified intermediate as its free acid. Buffer A consists of water with 0.1% trifluoroacetic acid (TFA) and buffer B is acetonitrile with 10% water and 0.1% TFA. The product was concentrated to ~5 mL by rotary evaporation. When dried, the free acid of the intermediate is very hygroscopic. To this hygroscopic form, the 5 mL acidic solution containing the free acid was neutralized with 0.1 M bicarbonate buffer, pH 7.4. After neutralization, the cloudy suspension was loaded onto a 10 g reverse phase C18 silica-desalting column (Waters Corp.). The excess inorganic salts were removed by washing with 50 mL of deionized water, and pure intermediate 1 (30.0 mg, 65%) as its sodium salt was isolated by elution with a mixture of acetonitrile containing 25% water. The purity of the product was verified to be > 97 % by analytical HPLC. 1H NMR (400 MHz, CD3OD): δ 7.24 (d, 2H, J = 8.4 Hz), 6.42−6.38 (m, 4H), 3.32 (quartet, 8H, J = 7.1 Hz), 2.63 (t, 2H, J = 7.5 Hz), 2.17 (t, 2H, J = 7.5 Hz), 1.88 (pentet, 2H, J = 7.4 Hz), 1.11 (t, 12H, J = 7.0 Hz). 13C NMR (400 MHz, CD3OD): δ 181.8, 175.3, 154.6, 149.2, 127.4, 120.1, 108.4, 101.5, 46.4, 35.5, 34.5, 24.1, 13.7. HRMS-ESI [M-H]− m/z calcd. for [C25H32N3O4]− 438.2398, found 428.2398.
Synthesis of the ROS/RNS nanoparticle probe
Alexa Fluor 488 labeled CLIO nanoparticles (hydrodynamic diameter 41 nm as determined by dynamic light scattering) were prepared according to published procedures 38,39. To a solution of CLIO-AF488 (3 mg Fe) in 2.7 mL of PBS, pH 7.4 was added intermediate 1 (3 mg, 6.5 µmol) dissolved in 300 µL of DMSO and N-(3-Dimethylaminopropyl)-N′-ethylcarbodiimide hydrochloride (EDAC, 30 mg, 0.16 mmol). This solution was allowed to stir in overnight (dark, room temperature). Following incubation, the labeled probe was purified by size exclusion chromatography (Sephadex G-50 resin) eluting with PBS, pH 7.4. The purified nanoparticle solution was concentrated to 1 mL by centrifugal filtration with an Amicon Ultra 3,000 MW cutoff centrifugal filter. The concentration of this stock solution (2.25 mg Fe/mL) was determined by comparing the absorbance at 400 nm (a wavelength at which AF488 and intermediate 1 do not absorb) to a diluted CLIO-AF488 stock solution of known concentration. The number of quenched oxazine fluorophores per nanoparticle, which have no absorption in the visible, was determined by activation of a dilute 10 nM solution of the final ROS/RNS probe with excess NaOCl or peroxynitrite. The concentration of the released oxazine fluorophore was then measured using its extinction coefficient in PBS (ε = 107,000 M−1cm−1). Using this procedure, the number of ROS activatable oxazine groups per nanoparticle is calculated to be ~400.
Mouse Usage
A total of 44 C57BL/6J female mice (10–12 weeks old) were used for this study. The study utilized 12 mice for the fluorescent-activated cell sorting and 17 mice for ex vivo imaging of myocardial infarction. A total of 15 mice were used for the pharmacokinetics of the oxazine probe and nanoparticle conjugate. Massachusetts General Hospital Subcommittee on Research Animal Care approved experiments.
ROS/RNS Sensor Blood Half-life
In vivo pharmacokinetics of oxazine alone and the ROS/RNS sensor were determined. Each group consisted of 5 mice (C57/B6, Jackson Labs) that were injected either with the small molecule dye, oxazine (50 nmol) or the nanoparticle, ROS/RNS sensor (8–10 mg/kg body weight) while anesthetized (isoflurane 2–3% v/v + 2 L/min O2). Retro-orbital bleeds were taken at various times and immediately transferred to a tube containing anticoagulant heparin. The blood samples were then imaged on the Bonsai fluorescence reflectance imaging system (Siemens) using the Cy 5 channel (λexc = 620–650 nm with λem 680–710 nm) for oxazine and GFP channel (λexc = 450–480 nm with λem 500–530 nm) for the AF488-labeled ROS/RNS sensor due to the quenched nature of the oxazine conjugation on the nanoparticles. Fluorescence measurements were corrected for control background levels (blood from un-injected control mice) and expressed as percent injected dose.
Selectivity of the ROS/RNS Sensor for ROS Species
All in vitro activation experiments were performed in triplicate using the ROS/RNS nanoparticle probe in PBS (10 mM phosphate, 2.7 mM KCl, 137 mM NaCl, pH 7.4) at a 5 nM concentration (2 µM with respect to activatable oxazine). Selectivity of the ROS/RNS probe was determined by screening against a panel of biologically relevant oxidants. The integrated fluorescence response from 650 to 850 nm (λex = 620 nm) of the ROS/RNS probe was measured 30 min after treatment with the appropriate ROS or RNS at room temperature. The final oxidant concentration is 25 µM except for H2O2 (250 µM) and for the Fenton reagents (Fe(ClO4)2: 50 µM and H2O2: 250 µM) to generate HO·. Other oxidant sources include: Sodium hypochlorite (Sigma-Aldrich), peroxynitrite in 4.7% aqueous NaOH (EMD Biosciences), NOC-9 nitric oxide donor (EMD Biosciences), potassium superoxide (Strem Chemical), and 2,2’-(azobis (2-amidinopropane) dihydrochloride alkylperoxy radical source (EMD Biosciences). Photo-oxidation was investigated by placing the ROS/RNS probe under a fluorescent lamp for 2 h. For all ROS/RNS assays the final buffer pH was 7.4±0.1.
Isolation of Mouse Neutrophils
Flow sorting of murine neutrophils and monocyte/macrophages was performed as previously described 40. Briefly, spleens from euthanized mice were removed, triturated in DPBS (Lonza Inc.) at 4°C with the end of a 3 mL syringe and filtered through 40 µm nylon mesh (BD Bioscience). Cell suspensions were centrifuged at 1500 rpm for 10 min at 4 °C. Red blood cells were lysed with a hypo-osmolar ACK lysis buffer and the splenocytes were washed and resuspended in DPBS supplemented with 0.5% bovine serum albumin (BSA) and 1% fetal calf serum (FCS). Splenocytes were labeled with the following antibodies CD90-PE/53-2.1, B220-PE/RA3-6B2, CD49b-PE/DX5, NK1.1.-PE/PK136, Ly6G-PE/1A8, Ter119-PE/Ter119, CD11b-APC-Cy7/M1/70 (Antigen-Flourochrome/Clone, all from BD Bioscience) for 30 min. at 4°C. Labeled splenocytes were FACS sorted on a FACS Aria instrument (BD Bioscience) according to the expression of the myeloid marker CD11b. This CD11b+ enriched cell population yielded a purity of >98% myeloid cells consisting of primarily neutrophils. For morphologic characterization, sorted cells were spun, resuspended in 300 µL DPBS and prepared on glass slides by cytocentrifugation (Shandon, Inc.) at 10 G for 5 min and stained with HEMA-3 (Thermo Fisher Scientific).
In Vivo Activation of ROS/RNS Sensor
For intracellular probe activation, 100 K of CD11b+-enriched cells were incubated with oxazine-CLIO ROS-sensor at a final concentration of 20 µM for 2 h at 4 °C. Control cells were incubated in DPBS supplemented with 0.5% BSA and 1% FCS. For inhibitor studies, 4-aminobenzoic hydrazide was added at a final concentration of 10 µM. After the incubation period, cells were washed and analyzed by flow cytometry on a LSRII Cytometer (BD Bioscience) after appropriate compensations. Neutrophils were defined as CD11bhiLy6Ghi, monocyte/macrophages as CD11bhi (B220/CD90/CD49b/NK1.1./Ly6G/Ter119)lo. Activation of the ROS/RNS sensor was quantified in the allophycocyanine (APC) channel. Mean fluorescence intensities are shown.
Tail Vein Administration of ROS/RNS Sensor and Deposition/Activation in Ischemic Mouse Heart Tissue after Myocardial Infarction (MI)
Myocardial infarcts were induced in 12 mice (C57/B6, Jackson Labs) by coronary ligation during inhalation anesthesia (isoflurane 2–3% v/v + 2 L/min O2) as previously described 41, with 6 mice serving as controls which did not receive coronary ligation. Anesthesized mice were intubated and a thoracotomy was performed in the 4th left intercostal space to visualize the left ventricle where the left coronary artery was ligated. The chest wall was closed and the mouse recovered after extubation. Approximately 12 hours following the induction of the infarct, the ROS sensor was injected via tail vein as a 100–150 µL bolus (15mg/kg). The hearts were harvested 36 hours after MI.
Fluorescence Reflectance Imaging and Histopathology Analysis of Infarcted Mouse Hearts
Hearts were excised and rinsed in PBS and cut into myocardial rings of 1-mm thickness and either immediately stained with 2-3-5-triphenyl tetrazolium chloride (TTC) 41 to highlight the infarcted tissue or used for histological analysis. Fluorescence reflectance imaging of side-by-side myocardial rings of controls and injected hearts was performed in the GFP channel (λexc = 450–480 nm with λem 500–530 nm) and Cy5 channel (λexc = 620–650 nm with λem = 680–710 nm) using an Olympus OV-100 system (Olympus, Center Valley, PA). For histology and fluorescence microscopy, the tissue was embedded in OCT medium (Sakura Finetek, Torrance, Calif). Serial 6-µm-thick sections were collected in the midventricular level and used for immunohistochemical staining for CD11b (Abcam, Cambridge, Mass), neutrophils (NIMP-R14, Abcam, Cambridge, Mass) and MPO (NeoMarkers, Freemont, Calif). The reaction was visualized as a 3-step staining procedure using biotinylated secondary antibodies (BA4001, Vector Laboratories, Burlingame, Calif) and the AEC Substrate Kit (Vector Laboratories). Sakura Finetek Torrance, CA). Multichannel fluorescence microscopy was used to assess probe localization in the tissue sections with an upright epifluorescence microscope (Eclipse 80i, Nikon Instruments, Melville, NY). Fluorescence microscopy images were obtained using at a green/GFP filter (Q505LP bandpass, λexc = 480 ± 20 nm with λem = 535 ± 25 nm) and a far-red filter (Q680LP bandpass, λexc = 650 ± 23 nm with λem = 710 ± 25 nm).
Results and Discussion
Design and Synthesis of the Fluorogenic ROS/RNS Sensor
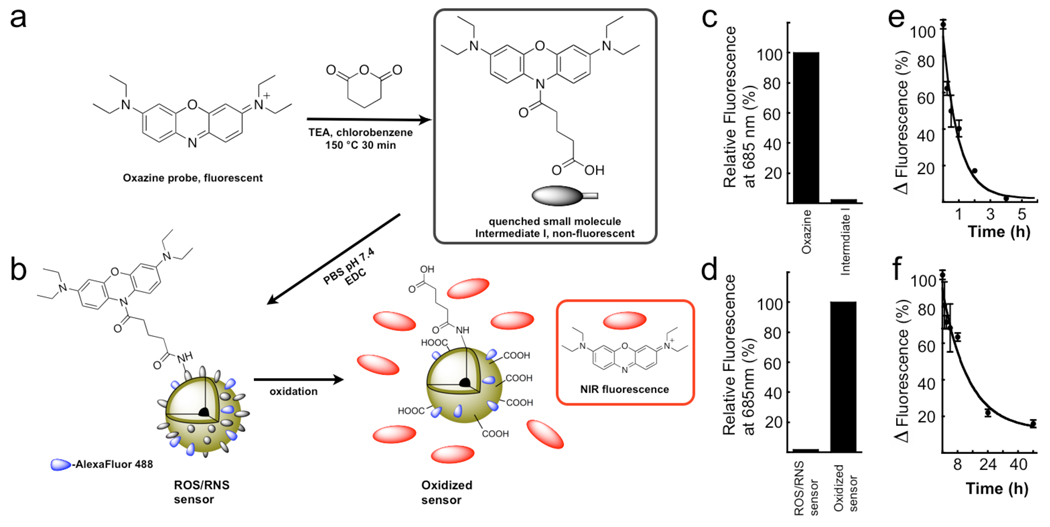
The ROS/RNS sensor was synthesized by the reaction scheme in Figure 1a–b and is based on the HOCl/ONOO− dependent release of masked oxazine fluorophores from the parent nanoparticle. A conjugatable handle was engineered to generate a fluorogenic oxazine (Figure 1a) that is non-fluorescent (Figure 1c), which was used for attachment to the Alexa Flour 488-modified magnetic nanoparticle (Figure 1b). The nanoparticle by itself (without oxazine) has been studied extensively 39,42,43, is biocompatible 40,42,44 and has been used in humans 45–49 (for a schematic of the base nanoparticle see Supplementary Figure 1). This sensor design results in a high substrate target concentration with each nanoparticle containing ~400 activatable oxazine functionalities. Activation of the ROS/RNS sensor by HOCl generated from the MPO/H2O2/Cl− system results in release of the oxazine dye from the nanoparticle scaffold and restoration of its fluorescent properties (Figure 1d), while retaining the covalent Alexa Fluor 488 labels (Figure 1b).
Figure 1.
Synthesis of the ROS/RNS sensor. a–b. Reaction of oxazine 1 with glutaric anhydride to generate the quenched ROS responsive intermediate with conjugatable handle for attachment to the dextran shell of the iron oxide nanoparticles. Nanoparticles are dual labeled with Alexa Fluor 488 to monitor particle location c–d, Relative fluorescence signal for each of the reactants and products. e–f, Blood half-life determination for the free oxazine dye and the ROS/RNS sensor.
Pharmacokinetics and Biochemical Characterization of the ROS/RNS Sensor
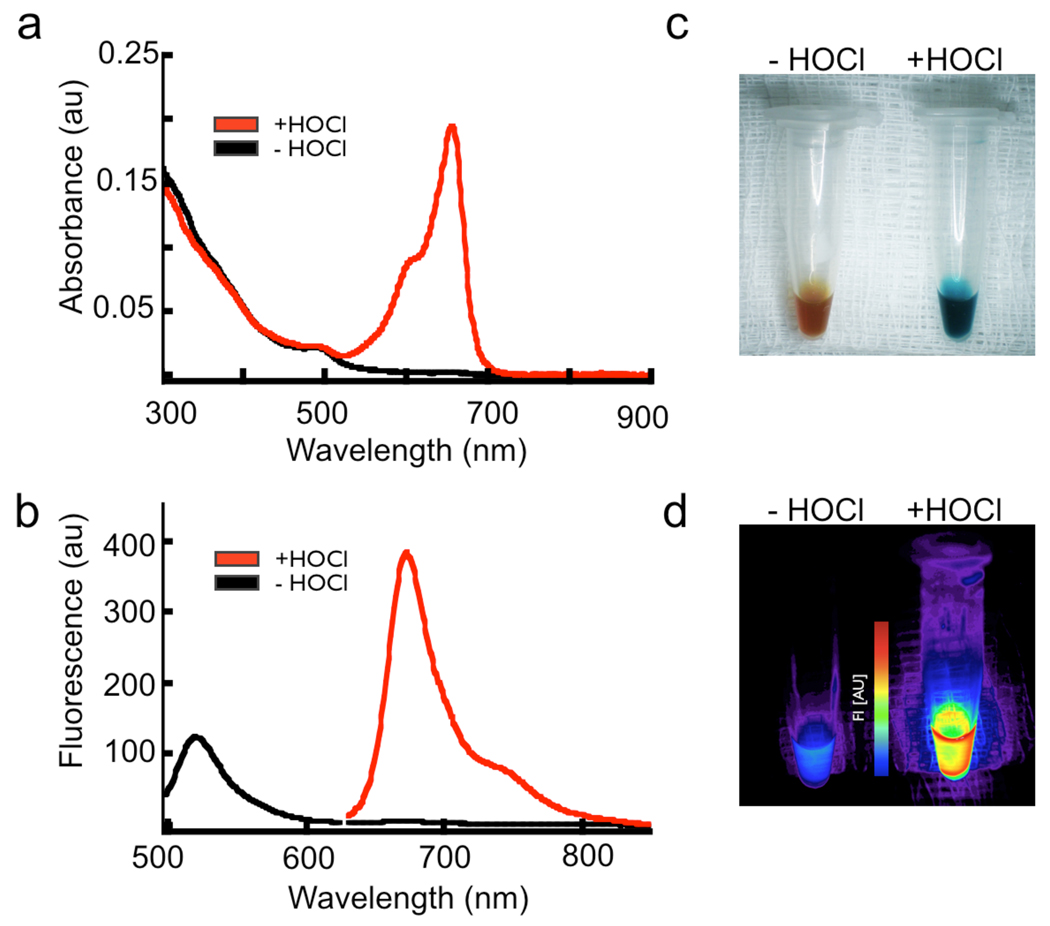
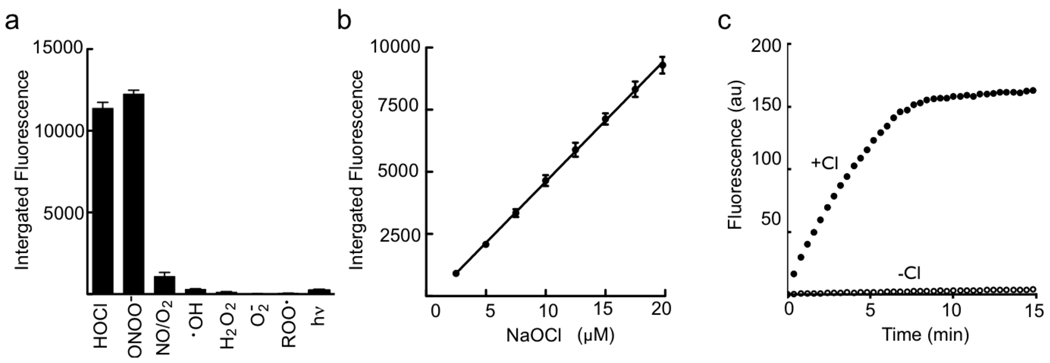
The addition of the oxazine to the nanoparticle significantly increases the blood half-life of the circulating probe from ~40 min to >9 h (Figure 1e–f), as compared to the free dye, making it suitable for animal imaging. The oxidation of the sensor causes absorbance spectral changes as shown in Figure 2a, marked by the generation the free oxazine with λmax of 655 nm (ε= 107,000 M−1 cm −1) and a dramatic reaction color change (Figure 2c). Activation of the probe after exposure to excess NaOCl generates a > 500-fold increase in fluorescence emission at λmax of 672 nm (λexc = 620 nm, Figure 2b) and release of the fluorescent dye (Figure 2d). The specificity of the ROS/RNS sensor towards activation by a panel of ROS species was determined, with only HOCl and ONOO− able to cause oxazine release (Figure 3a). Importantly, no activation was observed by H2O2, OH·, NO/O2, and O2·. Both HOCl/OCl− and ONOO− are known to be induced in ischemia/reperfusion injury 50,51. The probe activation is linear over a µM concentration range of NaOCl (Figure 3b). The rate of HOCl production by stimulated neutrophils is ~ 0.1 fM HOCl /sec 52,53, assuming 106 neutrophils in a mouse infarct this would represent 0.1 nM HOCl/sec. The actual concentration of HOCl produced by myeloid cells in vivo in response to injury is unclear due to confounding factors such as in vivo cellular half-life of the ROS species, variability of tissue response to ischemic trauma, and rate of extracellular HOCl diffusion. Progress curves for MPO-dependent activation of the ROS/RNS sensor in the presence and absence of Cl− ions indicate activation of the probe is stringently dependent on the formation of HOCl and not simply on the content of OH· radicals or H2O2 (Figure 3c).
Figure 2.
Spectral changes accompanying activation of the ROS/RNS sensor. a, Absorbance scan of the probe before (black line) and after (red line) activation with excess HOCl. Similar reactions demonstrate the distinct color change that follows release of the oxazine probe (inset). The initial yellow-brown color present is the typical color of dilute iron oxide nanoparticle solutions. b, Fluorescence emission spectra indicating the nanoparticles are indeed labeled with Alexa Fluor 488 (black line, λex = 450 nm) and after HOCl mediated probe activation to demonstrate the oxazine fluorescence (red line, λex = 620 nm). c–d, Color and fluorescence (λexc = 620–650 nm with λem = 680–710 nm) changes triggered by HOCl oxidation and release of the oxazine dye.
Figure 3.
Specificity of oxazine release from the nanoparticle platform. a, Fluorescence response of the ROS/RNS sensor following incubation with a panel of biologically relevant oxidants. b, Linear dependence of oxazine release with increasing HOCl concentrations. c, Effect of chloride ions on activation of the ROS/RNS probe and release of oxazine. Reactions were performed in the presence of MPO (11nM) and H2O2 (3.2µM).
In Vivo Cellular Monitoring of MPO Inhibition by ROS/RNS Sensor
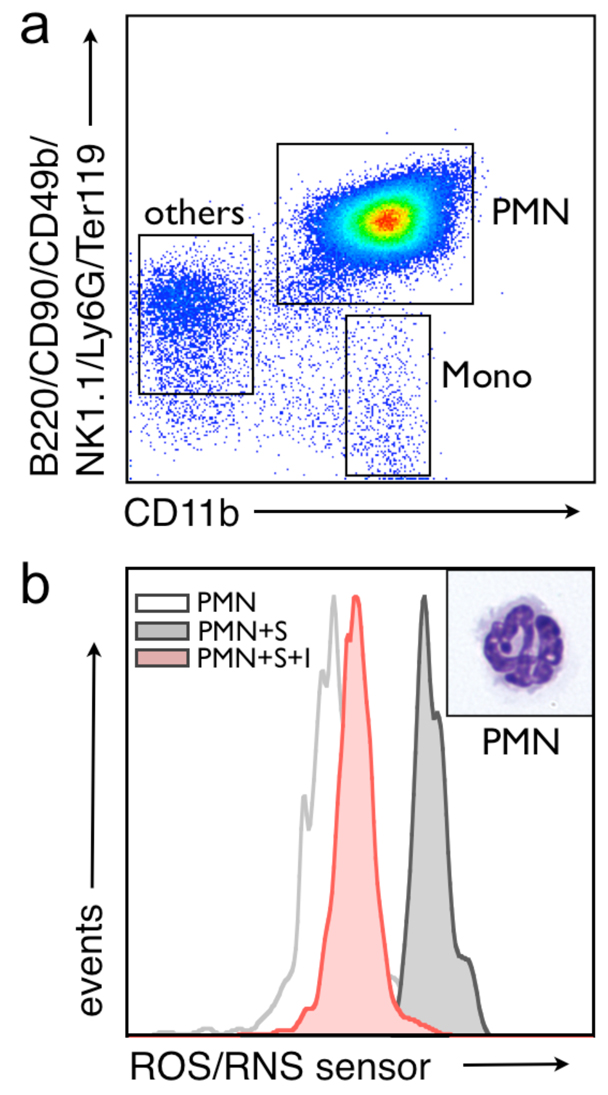
To determine whether the ROS/RNS sensor is capable of specifically monitoring MPO-dependent reactions in living cells, flow cytometry studies were performed using mouse CD11b enriched leukocytes. The flow cytometry gating strategy exploited here (Figure 4a), namely B220/CD90/CD49b/NK1.1./Ly6G/Ter119 versus CD11b, has been used previously 42,54. The in vivo probe activation indicates that the fluorescence signal is MPO-dependent and can be blocked by peroxidase inhibition (Figure 4b). Populations of neutrophils were confirmed by cytospin morphologic analysis after H&E staining (insets, Figure 4b). Furthermore, HOCl generation is dominant with respect to ONOO-production in neutrophils as indicated by the ~95% reduction in MPO/ROS sensor activation caused by inhibiting MPO function. The compatibility of the oxazine fluorescence wavelengths with standard APC filter sets will also enable future flow cytometry studies aimed at screening for suppressors of the MPO/H2O2/Cl− system in monocytes/macrophages and neutrophils.
Figure 4.
The ROS/RNS sensor can detect HOCl generation in a mixture of living splenocytes by flow cytometry. a, Splenocytes were enriched for CD11b+ cells and gated to separate out neutrophils (PMN), monocyte/macrophage, and lymphocyte (others) populations. b, Fluorescent-activated cell sorted neutrophils were used to demonstrate the specificity of the MPO sensor for HOCl production as cells pre-treated with 10 µM 4-aminobenzoic hydrazide (denoted I) failed to activate the ROS/RNS sensor (denoted S). Activation of the probe is monitored in the allophycocyanine (APC) channel of the flow cytometer. A high magnification (100X) image of representative cells from each gate after H&E staining is shown.
In Vivo Deposition/Activation in Ischemic Mouse Heart Tissue After Myocardial Infarction
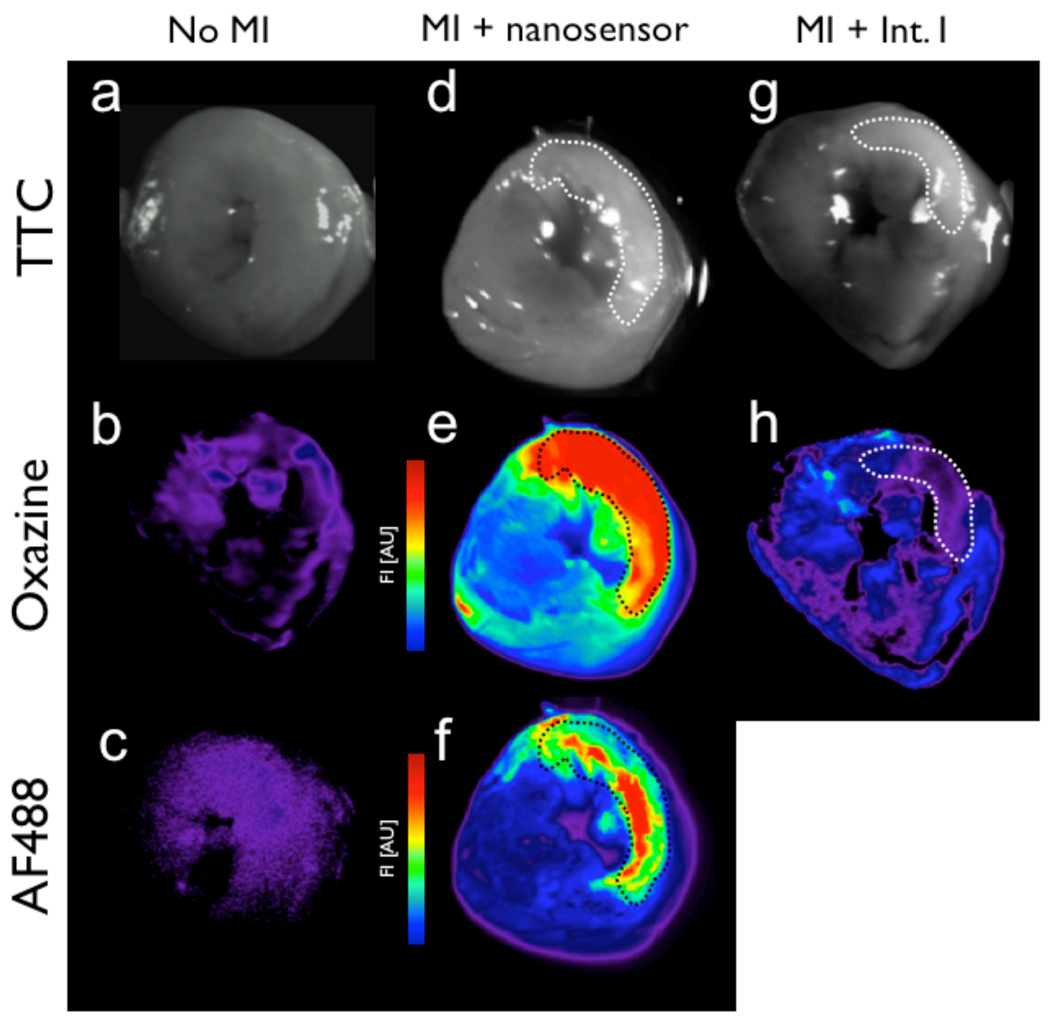
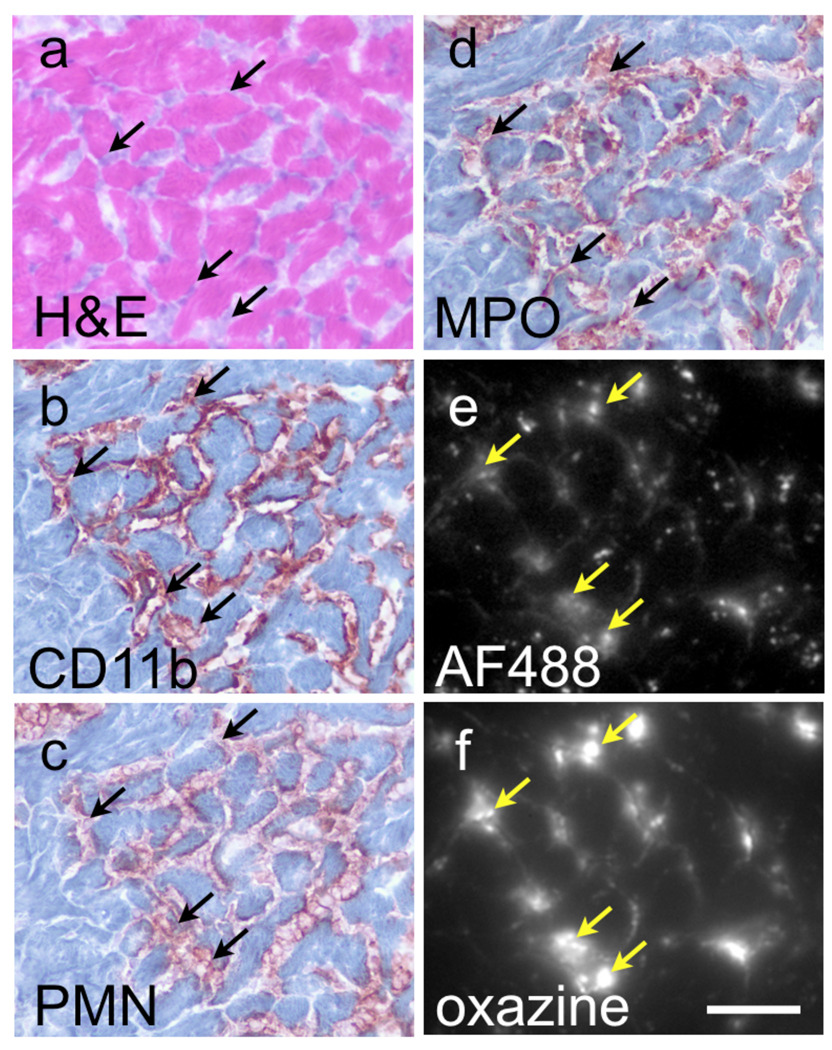
To investigate the utility of the ROS/RNS sensor in vivo, we determined the ability of the probe to monitor ischemia and inflammation as a result of permanent coronary ligation in a mouse model of myocardial infarction. For all experiments, the agents (sensor or quenched small molecule probe) were injected intravenously into the tail-vein of the mice 12–14 hours after MI and imaged 24 hours later when neutrophil recruitment to the infarct is high. Macroscopic analysis by fluorescence reflectance imaging of coronal sections of the infarcted mouse hearts indicated that the ROS/RNS sensor localized to the infarcted zone, whereas the fluorescence from the small molecule probe had washed out of the infarct and into the myocardium (Figure 5). Microscopic analysis of tissue sections from infarcted hearts confirms that oxazine fluorescence coincides with areas rich in MPO and neutrophils, which are the dominant cells recruited early after infarction. H&E, CD11b, neutrophil and MPO staining show correlation with the oxazine signal and nanoparticle cellular localization (Figure 6). The biocompatibility of the ROS/RNS sensor and its favorable pharmacokinetics will enable non-invasive fluorescence molecular tomography and other optical imaging studies to be performed to identify areas of inflammation caused by chronic disease or ischemic injury.
Figure 5.
Ex vivo comparison of ROS/RNS sensor or Intermediate I injected mouse tissue and fluorescence signal associated with oxazine release, accumulation, and probe washout kinetics. Fluorescence reflectance imaging (FRI) of control (a–c), ROS/RNS sensor (d–f), and Intermediate I (g–h) injected myocardial rings are shown. White light images of TTC-stained heart slices are shown (a, d and g) with infarcted region highlighted by the dashed line throughout. Accumulation of the activate oxazine probe is detectable in the Cy5 channel (b, e and h), while fluorescence associated with the covalent attached AF488-labeled nanoparticle (c and f).
Figure 6.
In vivo uptake and activation of the MPO sensor occurs in infarcted heart tissue. Histology of the infarcted tissue obtained from control C57BL/6 mice or mice 36 hours post ligation of the left descending coronal artery and tail-vein injection of the MPO sensor 24 prior to euthanasia. H&E staining and immunohistochemistry for CD11b immune cells (b), PMN (c) and MPO (d) are shown compared to fluorescence microscopy in the AF488/GFP channel (e), and oxazine/ Cy5 channel (f). Arrows indicate areas of probe localization (yellow arrows), which correspond to area with MPO and neutrophil staining (black arrow). Scale bar represents 50µm.
Conclusion
We present the design, synthesis and utility of a novel ROS/RNS sensor that enables imaging of ROS production resulting from ischemia-induced inflammation in living cells and in a mouse model of cardiovascular disease. Attachment of hundreds of fluorogenic oxazine probe to a single dextran-coated iron oxide nanoparticle favorably alters the washout kinetics of the quenched small molecule oxazine probe alone and results in high detection sensitivity, likely enabling ROS studies by whole animal fluorescence imaging. Screening of the ROS/RNS sensor against a panel of oxidants indicates that primarily HOCl/OCl− and ONOO− activate the sensor. Biochemical characterization of the sensor also indicates MPO mediated activation of the sensor has a strict requirement for Cl− ions. The ROS/RNS sensor can be used to monitor MPO inhibition in isolated neutrophils, where ONOO− has minimal contribution to ROS/RNS sensor activation. Importantly, this advance would allow for high throughput screening of anti-inflammatory molecules in vivo using the MPO/H2O2/Cl− system as a marker of efficacy. Finally, clinical monitoring of ROS production by macroscopic and endoscopic fluorescence imaging may enable detection of inflammation in atherosclerosis, cancer, metastasis and organ rejection.
Supplementary Material
Acknowledgment
The authors acknowledge Cory Siegel, MD for help with image acquisition; Virna Cortez-Retamozo, PhD for help with FACS isolation of neutrophils; Nikolai Sergeyev, PhD for nanoparticle synthesis, Yoshiko Iwamoto for help with histology; and Ned Keliher, PhD for helpful suggestions. This work was funded in part by NIH grants to RW (R24-CA92782, UO1-HL080731), and an American Heart Association scientist development grant to MN (0835623D).
Footnotes
Supporting Information Available Scheme depicting the architecture of the magnetofluorescent nanoparticle used as the building block of the ROS/RNS sensor described here and the complete citation for reference 41. This information is available free of charge via the Internet at http://pubs.acs.org/.
REFERENCES
- 1.Lefkowitz DL, Lefkowitz SS. Free Radic Biol Med. 2008;45:726–731. doi: 10.1016/j.freeradbiomed.2008.05.021. [DOI] [PubMed] [Google Scholar]
- 2.Green PS, Mendez AJ, Jacob JS, Crowley JR, Growdon W, Hyman BT, Heinecke JW. J Neurochem. 2004;90:724–733. doi: 10.1111/j.1471-4159.2004.02527.x. [DOI] [PubMed] [Google Scholar]
- 3.Heinecke JW. Am J Cardiol. 2003;91:12A–16A. doi: 10.1016/s0002-9149(02)03145-4. [DOI] [PubMed] [Google Scholar]
- 4.Benhar M, Engelberg D, Levitzki A. EMBO Rep. 2002;3:420–425. doi: 10.1093/embo-reports/kvf094. [DOI] [PMC free article] [PubMed] [Google Scholar]
- 5.Jackson AL, Loeb LA. Mutat Res. 2001;477:7–21. doi: 10.1016/s0027-5107(01)00091-4. [DOI] [PubMed] [Google Scholar]
- 6.Ramsey MR, Sharpless NE. Nat Cell Biol. 2006;8:1213–1215. doi: 10.1038/ncb1106-1213. [DOI] [PubMed] [Google Scholar]
- 7.Breckwoldt MO, Chen JW, Stangenberg L, Aikawa E, Rodriguez E, Qiu S, Moskowitz MA, Weissleder R. Proc Natl Acad Sci U S A. 2008;105:18584–18589. doi: 10.1073/pnas.0803945105. [DOI] [PMC free article] [PubMed] [Google Scholar]
- 8.Hausmann M, Obermeier F, Paper DH, Balan K, Dunger N, Menzel K, Falk W, Schoelmerich J, Herfarth H, Rogler G. Clin Exp Immunol. 2007;148:373–381. doi: 10.1111/j.1365-2249.2007.03350.x. [DOI] [PMC free article] [PubMed] [Google Scholar]
- 9.Nahrendorf M, Sosnovik D, Chen JW, Panizzi P, Figueiredo JL, Aikawa E, Libby P, Swirski FK, Weissleder R. Circulation. 2008;117:1153–1160. doi: 10.1161/CIRCULATIONAHA.107.756510. [DOI] [PMC free article] [PubMed] [Google Scholar]
- 10.Pieper GM, Nilakantan V, Nguyen TK, Hilton G, Roza AM, Johnson CP. Antioxid Redox Signal. 2008;10:1031–1040. doi: 10.1089/ars.2007.1867. [DOI] [PMC free article] [PubMed] [Google Scholar]
- 11.Fiedler TJ, Davey CA, Fenna RE. J Biol Chem. 2000;275:11964–11971. doi: 10.1074/jbc.275.16.11964. [DOI] [PubMed] [Google Scholar]
- 12.Wang Y, Rosen H, Madtes DK, Shao B, Martin TR, Heinecke JW, Fu X. J Biol Chem. 2007;282:31826–31834. doi: 10.1074/jbc.M704894200. [DOI] [PMC free article] [PubMed] [Google Scholar]
- 13.Mocatta TJ, Pilbrow AP, Cameron VA, Senthilmohan R, Frampton CM, Richards AM, Winterbourn CC. J Am Coll Cardiol. 2007;49:1993–2000. doi: 10.1016/j.jacc.2007.02.040. [DOI] [PubMed] [Google Scholar]
- 14.Zhang R, Brennan ML, Fu X, Aviles RJ, Pearce GL, Penn MS, Topol EJ, Sprecher DL, Hazen SL. Jama. 2001;286:2136–2142. doi: 10.1001/jama.286.17.2136. [DOI] [PubMed] [Google Scholar]
- 15.Carr AC, McCall MR, Frei B. Arterioscler Thromb Vasc Biol. 2000;20:1716–1723. doi: 10.1161/01.atv.20.7.1716. [DOI] [PubMed] [Google Scholar]
- 16.Reszka KJ, Matuszak Z, Chignell CF, Dillon J. Free Radic Biol Med. 1999;26:669–678. doi: 10.1016/s0891-5849(98)00244-5. [DOI] [PubMed] [Google Scholar]
- 17.Podrez EA, Schmitt D, Hoff HF, Hazen SL. J Clin Invest. 1999;103:1547–1560. doi: 10.1172/JCI5549. [DOI] [PMC free article] [PubMed] [Google Scholar]
- 18.Byun J, Mueller DM, Fabjan JS, Heinecke JW. FEBS Lett. 1999;455:243–246. doi: 10.1016/s0014-5793(99)00893-5. [DOI] [PubMed] [Google Scholar]
- 19.Dikalov SI, Dikalova AE, Mason RP. Arch Biochem Biophys. 2002;402:218–226. doi: 10.1016/S0003-9861(02)00064-4. [DOI] [PubMed] [Google Scholar]
- 20.Miller EW, Tulyathan O, Isacoff EY, Chang CJ. Nat Chem Biol. 2007;3:263–267. doi: 10.1038/nchembio871. [DOI] [PubMed] [Google Scholar]
- 21.Miller EW, Albers AE, Pralle A, Isacoff EY, Chang CJ. J Am Chem Soc. 2005;127:16652–16659. doi: 10.1021/ja054474f. [DOI] [PMC free article] [PubMed] [Google Scholar]
- 22.Dickinson BC, Chang CJ. J Am Chem Soc. 2008;130:9638–9639. doi: 10.1021/ja802355u. [DOI] [PMC free article] [PubMed] [Google Scholar]
- 23.Miller EW, Chang CJ. Curr Opin Chem Biol. 2007;11:620–625. doi: 10.1016/j.cbpa.2007.09.018. [DOI] [PMC free article] [PubMed] [Google Scholar]
- 24.Utsumi H, Yamada K. Arch Biochem Biophys. 2003;416:1–8. doi: 10.1016/s0003-9861(03)00285-6. [DOI] [PubMed] [Google Scholar]
- 25.Utsumi H, Yamada K, Ichikawa K, Sakai K, Kinoshita Y, Matsumoto S, Nagai M. Proc Natl Acad Sci U S A. 2006;103:1463–1468. doi: 10.1073/pnas.0510670103. [DOI] [PMC free article] [PubMed] [Google Scholar]
- 26.Bogdanov A, Jr, Matuszewski L, Bremer C, Petrovsky A, Weissleder R. Mol Imaging. 2002;1:16–23. doi: 10.1162/15353500200200001. [DOI] [PubMed] [Google Scholar]
- 27.Chen JW, Pham W, Weissleder R, Bogdanov A., Jr Magn Reson Med. 2004;52:1021–1028. doi: 10.1002/mrm.20270. [DOI] [PubMed] [Google Scholar]
- 28.Gross S, Gammon ST, Moss BL, Rauch D, Harding J, Heinecke JW, Ratner L, Piwnica-Worms D. Nat Med. 2009 doi: 10.1038/nm.1886. [DOI] [PMC free article] [PubMed] [Google Scholar]
- 29.Hilderbrand SA, Lim MH, Lippard SJ. J Am Chem Soc. 2004;126:4972–4978. doi: 10.1021/ja038471j. [DOI] [PubMed] [Google Scholar]
- 30.Nagano T, Yoshimura T. Chem Rev. 2002;102:1235–1270. doi: 10.1021/cr010152s. [DOI] [PubMed] [Google Scholar]
- 31.Lim MH, Xu D, Lippard SJ. Nat Chem Biol. 2006;2:375–380. doi: 10.1038/nchembio794. [DOI] [PubMed] [Google Scholar]
- 32.Lim MH, Lippard SJ. Acc Chem Res. 2007;40:41–51. doi: 10.1021/ar950149t. [DOI] [PubMed] [Google Scholar]
- 33.Smith RC, Tennyson AG, Lim MH, Lippard SJ. Org Lett. 2005;7:3573–3575. doi: 10.1021/ol0513903. [DOI] [PMC free article] [PubMed] [Google Scholar]
- 34.Kundu K, Knight SF, Willett N, Lee S, Taylor WR, Murthy N. Angew Chem Int Ed Engl. 2009;48:299–303. doi: 10.1002/anie.200804851. [DOI] [PMC free article] [PubMed] [Google Scholar]
- 35.Yang D, Wang HL, Sun ZN, Chung NW, Shen JG. J Am Chem Soc. 2006;128:6004–6005. doi: 10.1021/ja0603756. [DOI] [PubMed] [Google Scholar]
- 36.Setsukinai K-I, Urano Y, Kakinuma K, Majima HJ, Nagano T. J. Biol. Chem. 2003;278:3170–3175. doi: 10.1074/jbc.M209264200. [DOI] [PubMed] [Google Scholar]
- 37.Shepherd J, Hilderbrand SA, Waterman P, Heinecke JW, Weissleder R, Libby P. Chem. Biol. 2007;14:1221–1231. doi: 10.1016/j.chembiol.2007.10.005. [DOI] [PMC free article] [PubMed] [Google Scholar]
- 38.Koch AM, Reynolds F, Kircher MF, Merkle HP, Weissleder R, Josephson L. Bioconjug Chem. 2003;14:1115–1121. doi: 10.1021/bc034123v. [DOI] [PubMed] [Google Scholar]
- 39.Josephson L, Tung CH, Moore A, Weissleder R. Bioconjug Chem. 1999;10:186–191. doi: 10.1021/bc980125h. [DOI] [PubMed] [Google Scholar]
- 40.Nahrendorf M, Swirski FK, Aikawa E, Stangenberg L, Wurdinger T, Figueiredo JL, Libby P, Weissleder R, Pittet MJ. J Exp Med. 2007;204:3037–3047. doi: 10.1084/jem.20070885. [DOI] [PMC free article] [PubMed] [Google Scholar]
- 41.Nahrendorf M, et al. Circulation. 2006;113:1196–1202. doi: 10.1161/CIRCULATIONAHA.105.602094. [DOI] [PMC free article] [PubMed] [Google Scholar]
- 42.Nahrendorf M, Zhang H, Hembrador S, Panizzi P, Sosnovik DE, Aikawa E, Libby P, Swirski FK, Weissleder R. Circulation. 2008;117:379–387. doi: 10.1161/CIRCULATIONAHA.107.741181. [DOI] [PMC free article] [PubMed] [Google Scholar]
- 43.Nahrendorf M, Sosnovik DE, Waterman P, Swirski FK, Pande AN, Aikawa E, Figueiredo JL, Pittet MJ, Weissleder R. Circ Res. 2007;100:1218–1225. doi: 10.1161/01.RES.0000265064.46075.31. [DOI] [PubMed] [Google Scholar]
- 44.Sosnovik DE, Nahrendorf M, Deliolanis N, Novikov M, Aikawa E, Josephson L, Rosenzweig A, Weissleder R, Ntziachristos V. Circulation. 2007;115:1384–1391. doi: 10.1161/CIRCULATIONAHA.106.663351. [DOI] [PubMed] [Google Scholar]
- 45.Harisinghani M, Ross RW, Guimaraes AR, Weissleder R. Neoplasia. 2007;9:1160–1165. doi: 10.1593/neo.07940. [DOI] [PMC free article] [PubMed] [Google Scholar]
- 46.Harisinghani MG, Saksena M, Ross RW, Tabatabaei S, Dahl D, McDougal S, Weissleder R. Urology. 2005;66:1066–1071. doi: 10.1016/j.urology.2005.05.049. [DOI] [PubMed] [Google Scholar]
- 47.Harisinghani MG, Weissleder R. PLoS Med. 2004;1:e66. doi: 10.1371/journal.pmed.0010066. [DOI] [PMC free article] [PubMed] [Google Scholar]
- 48.Harisinghani MG, Barentsz J, Hahn PF, Deserno WM, Tabatabaei S, van de Kaa CH, de la Rosette J, Weissleder R. N Engl J Med. 2003;348:2491–2499. doi: 10.1056/NEJMoa022749. [DOI] [PubMed] [Google Scholar]
- 49.Harisinghani MG, Barentsz JO, Hahn PF, Deserno W, de la Rosette J, Saini S, Marten K, Weissleder R. Acad Radiol. 2002;9 Suppl 2:S312–S313. doi: 10.1016/s1076-6332(03)80213-1. [DOI] [PubMed] [Google Scholar]
- 50.Yasmin W, Strynadka KD, Schulz R. Cardiovasc Res. 1997;33:422–432. doi: 10.1016/s0008-6363(96)00254-4. [DOI] [PubMed] [Google Scholar]
- 51.Wang P, Zweier JL. J Biol Chem. 1996;271:29223–29230. doi: 10.1074/jbc.271.46.29223. [DOI] [PubMed] [Google Scholar]
- 52.Aratani Y, Koyama H, Nyui S, Suzuki K, Kura F, Maeda N. Infect Immun. 1999;67:1828–1836. doi: 10.1128/iai.67.4.1828-1836.1999. [DOI] [PMC free article] [PubMed] [Google Scholar]
- 53.Nibbering PH, Zomerdijk TP, Corsel-Van Tilburg AJ, Van Furth R. J Immunol Methods. 1990;129:143–145. doi: 10.1016/0022-1759(90)90432-u. [DOI] [PubMed] [Google Scholar]
- 54.Swirski FK, Pittet MJ, Kircher MF, Aikawa E, Jaffer FA, Libby P, Weissleder R. Proc Natl Acad Sci U S A. 2006;103:10340–10345. doi: 10.1073/pnas.0604260103. [DOI] [PMC free article] [PubMed] [Google Scholar]
Associated Data
This section collects any data citations, data availability statements, or supplementary materials included in this article.


