

Abstract
Objective
Early-onset bipolar disorder is thought to be a particularly severe variant of the illness. Continuity with the adult form of illness remains unresolved, but preliminary evidence suggests similar biological underpinnings. Recently, we observed localized hippocampal decreases in unmedicated adults with bipolar disorder that were not detectable with conventional volumetric measures. Using the same three-dimensional mapping methods, we sought to investigate whether a similar pattern exists in adolescents with bipolar disorder.
Method
High-resolution brain magnetic resonance images were acquired from 16 adolescents meeting DSM-IV criteria for bipolar disorder (mean age 15.5 ± 3.4 years, 50% female) and 20 demographically matched, typically developing control subjects. Three-dimensional parametric mesh models of the hippocampus were created from manual tracings of the hippocampal formation.
Results
Controlling for total brain volume, total hippocampal volume was significantly smaller in adolescent patients with bipolar disorder relative to controls (by 9.2%). Statistical mapping results, confirmed by permutation testing, revealed significant localized deformations in the head and tail of the left hippocampus in adolescents with bipolar disorder, relative to normal controls. In addition, there was a significant positive correlation between hippocampal size and age in patients with bipolar disorder, whereas healthy controls showed an inverse relation.
Discussion
Localized hippocampal deficits in adolescent patients with bipolar disorder suggest a possible neural correlate for memory deficits observed in this illness. Moreover, age-related increases in hippocampal size in patients with bipolar disorder, not observed in healthy controls, may reflect abnormal developmental mechanisms in bipolar disorder. This possibility must be confirmed by longitudinal studies.
Keywords: mood disorder, juvenile, magnetic resonance imaging, hippocampus, mania
The hippocampus is a key brain structure involved in memory1 and emotional regulation.2 Given consistent evidence of impairment in declarative memory processes in both symptomatic and euthymic adult patients with bipolar disorder,3–5 in addition to evidence of dysregulation of frontolimbic neural circuitry,6 hippocampal abnormalities may be implicated in the pathophysiology of bipolar disorder. However, most studies of adults with bipolar disorder have not identified decreases in hippocampal volume.7,8
Much less is known about the neurobiological underpinnings of juvenile-onset bipolar disorder, although it is thought to be a particularly severe variant of the illness,9,10 potentially with a higher genetic loading.11 Its continuity with the adult form of the illness remains unresolved, but neuroanatomical findings to date in early-onset bipolar disorder appear similar to those for adults, with most studies finding no differences in global hippocampal volume between children with bipolar disorder and controls.12–14 In contrast, two studies have identified hippocampal volume decreases in young patients with bipolar disorder.15,16 In particular, in a sample of adolescents and adults with bipolar disorder, Blumberg and colleagues15 found a 5% decrease in hippocampus volume bilaterally, although the magnitude of this volume decrease was much less prominent than that observed in the amygdala. In addition, in 43 youths with bipolar disorder, Frazier et al.16 noted significantly smaller total hippocampal volume, an effect that was driven primarily by the female subjects with bipolar disorder.
The hippocampus is a highly differentiated structure, involving histologically distinct subregions17 with distinct cortical connections and variable developmental trajectories.18 An increasing number of studies suggest that these distinct subregions are associated with diverse behavioral functions and that the hippocampus should not be treated as a single entity.18,19 As such, localized deficits may be present in specific subregions of the hippocampus that may not be detected by conventional studies of global hippocampal volume. New imaging methodologies may allow us to determine whether localized hippocampal alterations exist in early-onset bipolar illness.
We report results of the first study, to our knowledge, to use three-dimensional surface mesh models to evaluate the structural integrity of the hippocampus in adolescent patients with bipolar disorder. This technique20 improves on other methods in that it visualizes the spatial profile of neuropathological abnormalities, allowing more refined neuroanatomical localization of regionally specific alterations in patients with bipolar disorder. This approach has been used to detect subtle or localized alterations in hippocampal structure, where differences in overall hippocampal volumes were not detectable.21
Any findings of hippocampal abnormalities in these young patients would likely reflect neurodevelopmental insults or alterations that develop early in the course of the illness. In the present study, we hypothesized that adolescents with bipolar disorder, relative to healthy comparison subjects, would exhibit localized alterations in hippocampal structure. Second, we sought to explore developmental differences by examining the relation of age with hippocampal structure in adolescents with bipolar disorder and typically developing controls.
Method
Participants
This study was approved by the University of Pittsburgh Biomedical Institutional Review Board, and written informed assent and consent were obtained from all subjects younger than 18 and their parents, respectively, after the study procedures were fully explained. Study participants ages 18 years and older signed informed consent forms. The sample included 16 adolescent patients with bipolar disorder and 20 demographically matched healthy comparison subjects. This study sample partially overlaps those previously described elsewhere,in which volumetric findings for the anterior cingulate,22 amygdala,12 and magnetic resonance spectroscopy findings23 were reported. Patients were recruited through the outpatient facilities of the University of Pittsburgh Medical Center or through advertisements in the local media. Inclusion criteria were a DSM-IV diagnosis of bipolar disorder (I, II, or not otherwise specified [NOS]), as determined by the Structured Clinical Interview for DSM-IV, Axis I24 for subjects older than 18, or the Schedule for Affective Disorders and Schizophrenia for School-Age Children-Present and Lifetime Version25 for those 18 and younger. Because the DSM-IV criteria for bipolar disorder NOS are vague, here bipolar disorder NOS was defined as the presence of clinically relevant bipolar symptoms that did not fulfill DSM-IV criteria for bipolar I or II disorder (as described in Birmaher et al.26). Exclusion criteria were any current medical problems and/or any history of alcohol or substance abuse or dependence. Subjects were between 10 and 21 years of age, and all of them had normal physical examination results and no history of neurological problems.
Healthy comparison subjects were recruited through local advertisements, according to the same exclusion criteria used for patients. Healthy control subjects had no DSM-IV Axis I disorders, as determined by the Structured Clinical Interview for DSM-IV, Axis I24 or Schedule for Affective Disorders and Schizophrenia for School-Age Children-Present and Lifetime Version,25 no current medical problems, and no history of psychiatric disorders among first-degree relatives. The subject groups did not differ with regard to age, sex, race, or educational attainment (Table 1).
TABLE 1.
Demographic Characteristics and Global Brain Volumes of Study Participants
| Juvenile BPD (n = 16) |
Healthy Controls (n = 20) |
Between-Group Differences | |
|---|---|---|---|
| Age, y, mean ± SD | 15.5 ± 3.4 | 16.9 ± 3.9 | F 1,35 = 1.5, p = .24 |
| Female, no. (%) | 8 (50) | 9 (45) | χ2 = 0.09, p = .77 |
| Right-handed, no. (%) | 13 (81) | 19 (95) | χ2 = 1.7, p = .30 |
| Race | |||
| White, no. (%) | 15 (94) | 17 (85) | χ2 = 0.69, p = .41 |
| African American, no. (%) | 1 (6) | 3 (15) | |
| Duration of illness, y | 3.92 ± 2.4 | NA | |
| Current mood state,a no. (%) | |||
| Depressed | 2 (12) | NA | |
| Euthymic | 14 (88) | ||
| ADHD, no. (%) | 5 (31) | NA | |
| Total brain volume, cm3, mean ± SD | 1,199.6 ± 125.3 | 1,172.1 ± 132.3 | F = 0.40, p = .53 |
| Total gray matter volume, cm3, mean ± SD | 756.4 ± 79.0 | 735.8 ± 87.8 | F = 0.54, p = .47 |
| Total white matter volume, cm3, mean ± SD | 450.7 ± 89.4 | 439.02 ± 64.8 | F = 0.21, p = .65 |
Note: BPD = bipolar disorder; ADHD = attention-deficit/hyperactivity disorder.
As assessed by DSM-IV criteria for a current mood episode and the Hamilton Depression Rating Scale.66
Adolescents with bipolar disorder (12 bipolar I, 3 bipolar II, and 1 bipolar NOS) were outpatients at the time of assessment, with treatment histories of varying lengths (mean age at onset 11.7 ± 4.1 years). The majority (14/16) were taking mood-stabilizing medication at the time of evaluation. Ten (63%) were taking lithium and eight (50%) were taking valproate (four of whom were also taking lithium). Additional medications included thyroid hormone (n = 3), olanzapine, methylphenidate, clomipramine, dexedrine, fluoxetine, lorazepam, trazodone, and citalopram (all n = 1). Seven of the subjects with bipolar disorder had a comorbid Axis I diagnosis, specifically, attention-deficit/hyperactivity disorder (ADHD; n = 5), oppositional defiant disorder (n = 1), and conduct disorder (n = 1).
Magnetic Resonance Imaging
Magnetic resonance imaging scans were acquired with a 1.5-T GE Signa Imaging System running Signa version 5.4.3 software. The scanning protocol was identical to that used in the study by Kaur et al.22 and consisted of a sagittal scout sequence, followed by a three-dimensional spoiled gradient echo sequence of 124 contiguous images acquired in the coronal plane, with acquisition parameters of TR = 25 milliseconds, TE = 5 milliseconds, field of view = 24 cm, slice thickness =1.5 mm, excitations = 1, matrix size = 256 × 192. All of the magnetic resonance images were processed with a series of manual and automated procedures that are described in detail in other reports27–29 and summarized below.
Anatomical Analysis
Magnetic resonance images were resampled, using a trilinear interpolation, to have an in-plane resolution of 1 × 1 × 1 mm, and then reoriented along the interhemispheric fissure in the axial and coronal views and along the anteroposterior commissure line in the sagittal view. The individual brain volumes were spatially realigned with the International Consortium for Brain Mapping nonlinear average brain template (ICBM152), using a six-parameter coregistration in the FLIRT program (available at http://www.fmrib.ox.ac.uk/fsl/). As part of the image preprocessing stream, images were also corrected for magnetic field inhomogeneities,30 edited to remove nonbrain tissue, and classified into different tissue types (gray matter, white matter, and CSF) using a partial volume method.31 Estimates of total brain volume and volumes of each tissue type were retained for subsequent statistical analysis. The hippocampi from each brain were traced using MultiTracer (http://bishopw.loni.ucla.edu/MultiTracer/MultiTracer.html ).32
Hippocampi were manually traced bilaterally by a trained image analyst (N.D.), blind to all of the demographic variables, who had established excellent reliability with gold-standard ratings on a training set of six brains (intraclass correlation coefficient ≥0.90). This level of agreement is comparable to that obtained in previous studies.33–35 Anatomical segmentation was performed using a standard neuroanatomical atlas of the hippocampus17 according to previously described criteria.28 Hippocampal models were delineated in contiguous coronal brain sections using standard guidelines,36 including the hippocampus proper, dentate gyrus, and subiculum (see Becker al.33 and Frisoni et al.34 for further details). The hippocampal borders were determined by the temporal horn, choroidal fissure, uncal and ambient cisterns, and the gray-white junction between the subiculum and parahippocampal gyrus. Anatomical landmarks were followed in all three orthogonal viewing planes simultaneously, and contours were drawn on magnified images (4×) to facilitate identification of neuroanatomical boundaries and accurate tracking of small-scale features. Volumes were obtained at subvoxel resolution from these tracings and retained for statistical analyses.
Anatomical mesh modeling methods37 matched equivalent hippocampal surface points across subjects and groups.27 These methods reveal highly localized deformations/expansions of the hippocampal surface that correspond to tissue changes in regions approximately corresponding to the underlying CA1–3 subfields and subiculum/presubiculum (Fig. 1A).34,38 For these procedures, a gridded surface is stretched over the hippocampus, using a rectilinear mesh of equally spaced three-dimensional points along the hippocampal axis and across the upper and lower surfaces. In the absence of any other landmarks to establish higher order correspondences, mesh points with the same surface-based coordinate locations are associated across subjects.34
Fig. 1.
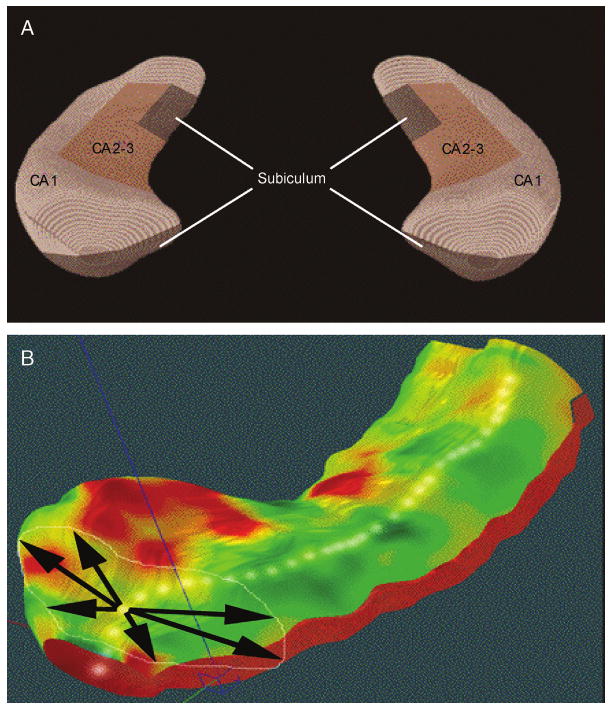
A, Schematic representation of the hippocampal subfields mapped onto a representative hippocampal surface (definitions based on Duvernoy17 and West and Gundersen41). B, Depiction of three-dimensional parametric surface model of the hippocampus, which is created using anatomical surface modeling software and composed of discrete triangular tiles that are spatially uniform and can be averaged across subjects. A three-dimensional medial curve is derived from each individual hippocampus (arrows, B). The distance from this axis to the surface is the dependent variable in regression analyses. See Method section for details.
The manually derived contours were made uniform by modeling them as a three-dimensional variable surface mesh (Fig. 1B), allowing measurements to be made at corresponding surface locations in each subject. This procedure also allows the averaging of hippocampal surface morphological features across all individuals belonging to a group and records the amount of variation between corresponding surface points relative to the group averages. These methods are similar to the high-dimensional computational mapping approach39 and sampled medial description (M-rep) procedure40 recently developed for local shape analysis of the hippocampus.
Statistical Analysis
To assess global hippocampal differences, the volumes of these three-dimensional models were measured in cubic millimeters. The general linear model (analysis of covariance) was used to examine group differences in hippocampal volume, with diagnostic group (patients with bipolar disorder versus healthy controls) modeled as an independent variable. Because age, sex, and total intracranial volume were associated with hippocampal volume measures, these factors were included as covariates in the analyses. For secondary analyses examining developmental effects on global hippocampal volume, we additionally conducted Pearson's correlations between age and total hippocampal volume for each diagnostic group separately. Similarly, we examined the effects of clinical variables (duration and age at onset of illness, number of episodes) on hippocampal volume via Pearson's correlation coefficients in the bipolar group only. In addition, to explore the possible effects of comorbidity, we repeated the analysis of covariance after excluding the five subjects with comorbid ADHD. Normality and homogeneity of variance assumptions were assessed with residuals analysis; distributions of all of the variables analyzed met these assumptions.
To measure local differences in hippocampal shape, a medial three-dimensional curve was derived from each individual's hippocampus threading down the central axis (Fig. 1B). The distance of each surface point from this center line measures the radial size of the hippocampus. Because radial distances are measured at thousands of points along the surface, the resulting radial distance maps detect nonuniform changes on a local scale.28 Regressions were performed at each surface point to map linkages between radial size and covariates such as diagnosis and age. The percentage of change relative to controls and the associated p value describing the significance of group differences were plotted onto the model surface at each point of the hippocampus using a color code to produce statistical maps.
For tests of overall volume differences and for statistical mapping of surface-based measures, a two-tailed α level of p < .05 was used as the threshold for statistical significance. However, for statistical mapping, comparisons were made at many hippocampal surface points; thus, permutation testing was used to control for multiple comparisons, as previously described.27 These permutations measure the distribution of features in the statistical maps that would be observed by accident if group assignment were random and provide an overall p value for the observed effects, which is corrected for multiple comparisons.
Results
Overall Volumetric Differences
Adolescent patients with bipolar disorder did not differ from typically developing controls in terms of total brain volume, total gray matter volume, or total white matter volume (Table 1). To provide context for the hippocampal maps, hippocampal volumes in patients with bipolar disorder compared to controls are shown in Figure 2. Controlling for total intracranial volume, age, and sex, there was a significant main effect of group (F1,32 = 5.0, p = .03), indicating that total hippocampal volume was significantly smaller in the bipolar group relative to typically developing controls (by 9.2%). This difference was significant for the left hippocampus (F1,32 = 5.09, p = .03), and there was a trend toward a volume decrease in the right hippocampus as well (F1,32 = 3.72, p = .06).
Fig. 2.
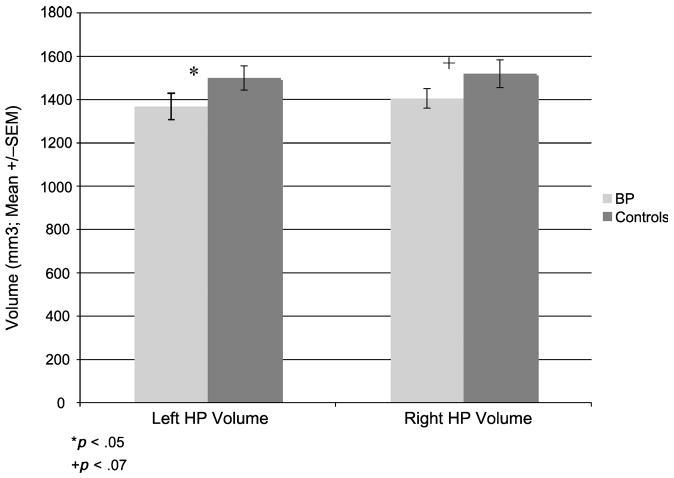
Hippocampal (HP) volumes. The mean ± SEM for total volume of the right and left hippocampi in early-onset patients with bipolar disorder and typically developing controls. This difference was significant for the left hippocampus (p = .03), with a trend toward a volume decrease in the right hippocampus as well (p = .06).
Three-Dimensional Hippocampal Mapping
To better understand the anatomical distribution of these differences, we demarcated the main hippocampal subfields on the hippocampal surface using two well-established sources.17,41 These statistical mapping results revealed significant localized deficits in the head and tail of the left hippocampus in adolescents with bipolar disorder relative to normal controls (Fig. 3). These deficits appeared most pronounced in hippocampal subfields approximately corresponding to the subicular region. Maps were subjected to stringent multiple comparison correction using permutation testing and confirmed a significant decrease in the left hippocampus (p < .01), although group differences did not reach significance for the right hippocampus.
Fig. 3.
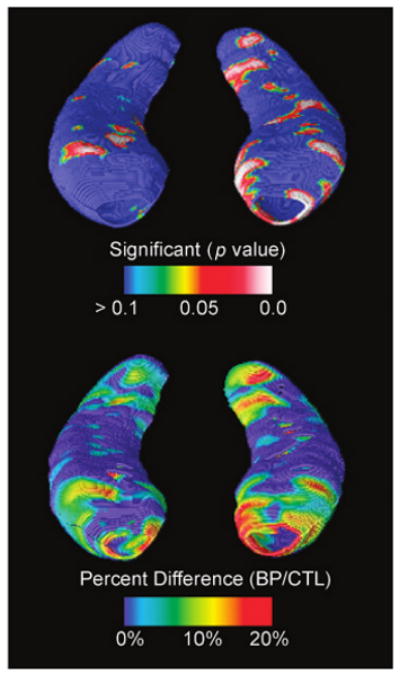
Statistical three-dimensional maps show local decrease in the hippocampal formation in adolescent patients with bipolar disorder (BPs) relative to typically developing control subjects in terms of statistical significance (A) and percentage of difference (B). Maps indicate significant localized deficits in the head and tail of the left hippocampus in adolescents with bipolar disorder relative to normal controls, which were most pronounced in hippocampal subfields approximately corresponding to the subicular region. The right hippocampus is on the left side of the figure.
Developmental Effects
Different relations were observed between age and hippocampal volume in adolescent patients with bipolar disorder compared to controls. General linear model multivariate analysis of variance revealed a significant diagnosis by age interaction for hippocampal volume bilaterally (F1,32 = 7.46, p = .01; Fig. 4). Correlational analyses revealed that for adolescents with bipolar disorder, total hippocampal volume increased with age (r = .55, p = .03), whereas the relation was in the opposite direction in the control subjects, although not significantly so (r = −0.38, p = .10). This positive correlation persisted in the bipolar group when controlling for total intracranial volume (r = 0.52, p < .05).
Fig. 4.
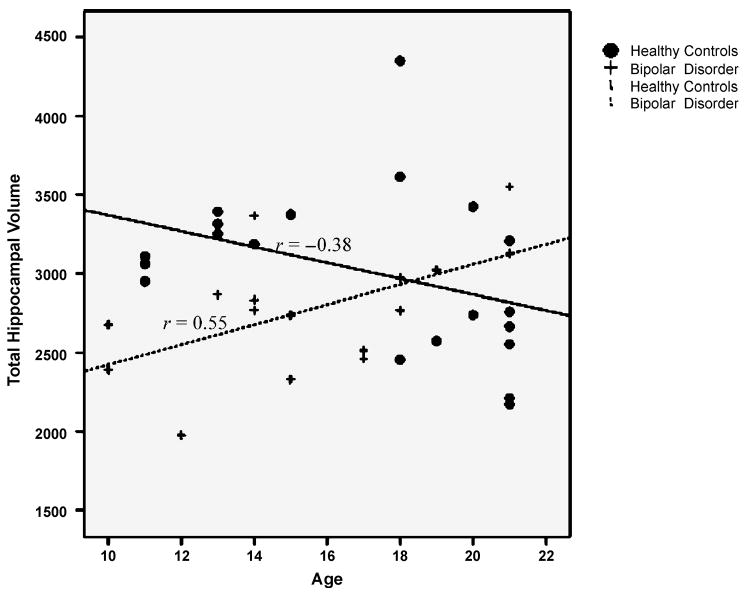
Linear regression scatterplot for absolute hippocampal volume (in cubic millimeters) by age. Patients with early-onset bipolar disorder show a positive correlation of age with hippocampal volume (r2 = 0.30; p = .03). In contrast, hippocampal volume in typically developing controls showed a nonsignificant inverse correlation with age (r2 = 0.14; p = .10). The age × diagnosis interaction was highly significant (p = .01).
Three-dimensional hippocampal maps allowed us to localize these age-associated differences. After correction for multiple comparisons with a permutation threshold of p < .05, statistical mapping results indicated that age was negatively correlated with hippocampal radial distance bilaterally in control subjects, whereas this correlation was positive in the patients with bipolar disorder (Fig. 5). Age-associated decreases in control subjects were primarily localized to the subiculum and CA1 subfields in the anterior hippocampus. In contrast, patients with bipolar disorder showed significant age-associated increases in both posterior and anterior CA1 subfields. Although patients with bipolar disorder showed modest inverse correlations with age in the body of the hippocampus (Fig. 5, bottom), these were not statistically significant.
Fig. 5.
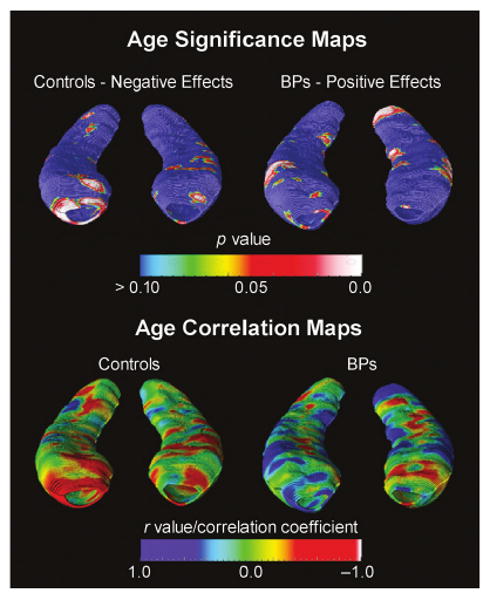
Statistical three-dimensional maps showing the correlation of age with regional hippocampal differences, in terms of statistical significance (top) and Pearson correlation coefficient r (bottom). The correlation maps (bottom row) show the regional strength of the association between hippocampal radial distance and age in typically developing controls (left) and subjects with bipolar disorder (right), indicating primarily negative effects with age in controls and positive effects in subjects with bipolar disorder. Again, the right hippocampus is on the left side of the figure.
Because mood-stabilizing medications, particularly lithium, may contribute to hippocampal volume increases,35 we examined whether age-associated increases in hippocampal volume were related to duration of lithium treatment. There was no mean age difference between the lithium-treated patients (n = 10) versus those not taking lithium (n = 6; F1,15 = .55, p = .47), nor was the number of weeks on lithium (r = −0.07, p = .85) or the lithium dose correlated with age (r = 0.15, p = .68). In the subgroup of eight patients taking valproate, we also examined the correlation between the number of weeks on valproate and age and found no relation (r = 0.43, p = .33), suggesting that this finding is not attributable to the effects of medication.
Effects of Clinical Variables
Within the bipolar sample, there was no effect of the number of episodes or duration of illness on hippocampal structure (both p > .30). Total hippocampal volume did not differ for patients with bipolar disorder with and without ADHD (F1,13 = 0.17, p = .69). There was a trend toward association of earlier age at onset of illness with smaller hippocampi bilaterally in the bipolar group (r = 0.45, p = .08). However, because age at onset was highly correlated with age in the patient group (r = 0.82, p < .001), partial correlations were conducted to examine the relation of age at onset to total hippocampal volume after controlling for age. When age was partialed out, the relation of age at onset to hippocampal volume was no longer significant (r = 0.008, p = .97). Finally, group differences remained significant after excluding the five ADHD subjects (F1,28 = 4.11, p < .05). Effect sizes for the case-control comparison for the overall group indicated a moderate effect size (Cohen d = 0.53), with a slightly larger effect when including the ADHD-free subjects with bipolar disorder only (Cohen d = 0.66).
Discussion
Using novel methods for three-dimensional mapping of the hippocampus, we detected significant regional hippocampal deformation in adolescents with bipolar disorder, predominantly on the left side, relative to age-matched, typically developing controls. These deficits were localized primarily to the subicular region. Because neurons in the subiculum project directly to the prefrontal cortex,42 this finding suggests disruption of this pathway in early-onset bipolar disorder. The fact that the hippocampal volume decrease for juvenile bipolar disorder appears to be more pronounced relative to that seen for adult patients with bipolar disorder is not surprising given that neuroanatomical studies to date have generally reported overall cortical gray matter alterations of greater magnitude in this population,43 which likely represents a more severe phenotype of the illness.10 The overall magnitude of the differences in global hippocampal volume (9%–10%) was comparable to that observed in a sample of children and adolescents with childhood-onset schizophrenia studied with similar methodology.44 Interestingly, the pattern of hippocampal decrease observed in childhood-onset schizophrenia also indicated greatest loss in the anterior and posterior regions.
These results have potentially important implications for better understanding the mechanisms underlying deficits in memory and emotion regulation in youths with bipolar disorder. In particular, the regions of the posterior hippocampus found to be smaller in adolescents with bipolar disorder in this study are part of a neural circuit that is essential for long-term memory formation and consolidation.45 Furthermore, anterior portions of the hippocampus, particularly in the subiculum, are differentially activated when successfully retrieving information from memory.46 Thus, abnormalities of these regions could disrupt the normal functioning of these circuits and result in significant memory deficits.45 Localized deformations in both the anterior and posterior hippocampus could explain the diffuse pattern of memory deficits observed in children and adolescents with bipolar disorder, involving impairment in both verbal and nonverbal declarative memory and spatial as well as auditory working memory.47–50
Although the mechanism underlying the observed structural abnormalities is not known, the hippocampus is one of the brain regions that is most vulnerable to neuronal loss.51 Structural changes may be due to remodeling of key cellular elements, involving retraction of dendrites, decreased neurogenesis in the dentate gyrus, and/or loss of glial cells, possibly due to elevated glucocorticoid levels.52 Because the hippocampus modulates glucocorticoid release through pituitary-adrenal axis,53 it is a key brain region for the integration of cognitive, neurohormonal, and neurochemical responses to stress.54 As such, it has been proposed that the hippocampal volume decrease consistently observed in major depressive disorder may be the result of prolonged stress-induced excess of glucocorticoids, which may exert damage to the hippocampus.52,55,56 In adults with major depressive illness, the duration of untreated depression is inversely correlated with hippocampal size, which some have proposed may be due to increasing neurotoxicity to the hippocampus with repeated episodes.55,57 Although here we found no relation with duration of illness, most of the young patients with bipolar disorder in this sample began receiving treatment soon after onset; thus, it is not clear whether there is a deleterious effect of duration of untreated illness on hippocampal structure in early-onset bipolar illness.
We did, however, identify an intriguing developmental effect in which patients with bipolar disorder showed increasing hippocampal size with increasing age, although typically developing controls did not. This is consistent with the pattern of findings for the amygdala that was previously observed in a partially overlapping sample to the one examined here12; specifically, a significant direct relation between age and left amygdalar volume was observed in patients with bipolar disorder, whereas a significant inverse relation was seen in healthy control subjects. The abnormal relation between age and medial temporal lobe structures in young patients with bipolar disorder suggests abnormalities in maturational processes, which may reflect a failure of normal pruning mechanisms during adolescence.58 We investigated the possible contribution of long-term medication use to this result and found no relation between age and the duration or dose of mood-stabilizing medication. This suggests that medication effects do not account for the observed age-associated increase in hippocampal volume in adolescents with bipolar disorder. However, this study was not designed to test hypotheses related to differential medication effects. It is possible that psychotropic medications may affect the brain differently during different stages of development. Future longitudinal studies of medial temporal lobe development in children and adolescents with bipolar disorder, both medicated and unmedicated, are clearly warranted to confirm this intriguing cross-sectional finding.
Consistent with large-scale studies of normal development,59,60 we did not find a significant change in global hippocampal volume through adolescence in typically developing controls, although shape maps revealed significant age-associated decreases in the anterior hippocampus. Similarly, Gogtay et al.18 recently studied the dynamic trajectory of hippocampal development in 31 children and adolescents, scanned every 2 years for 6 to 10 years between ages 4 and 25, using the same computational mapping methods that we used. They found that total hippocampal volume remained unchanged over this age range, but there was considerable variability across hippocampal subregions, with relative increases over time in posterior regions and loss over time in anterior regions. These distinct developmental trajectories of hippocampal subregions may parallel differences in their functional development.
Although hippocampal cytoarchitecture is well established by 34 weeks of gestation,61,62 neuronal proliferation and myelination continue through adolescence, both in rodents and primates.58,61 In a large postmortem brain sample, Benes63 observed increased myelination of the subicular and presubicular regions during the late adolescent period. These changes may thus continue to alter regional hippocampal shape or volume over the course of adolescent development and may have particular relevance to major psychiatric disorders that typically have onset in adolescence (e.g., schizophrenia, bipolar disorder).
We found little evidence of an effect of clinical course on hippocampal structure in these young patients with bipolar disorder. Although there was some suggestion that earlier age at onset of illness was associated with smaller hippocampi, this finding appeared to be accounted for by the correlation of age with age at onset of illness. Nevertheless, there is some evidence of a more severe chronic course of illness in prepubertal- (childhood) onset bipolar disorder compared to those with adolescent onset,64 suggesting that earlier onset may also be associated with more severe neuroanatomical alteration. Given the relatively brief duration of illness in all of the patients with bipolar disorder in this sample, differences associated with clinical factors may be identified in a larger sample with more variable illness histories.
Certain limitations of the present study must be noted. Because these patients were taking a variety of medications, and all but two were taking a mood stabilizer, differential medication effects could not be investigated here. Given the ethical issues inherent in discontinuing medication in children with severe psychiatric illness, medication confounds could not be avoided. However, because we and others have previously observed significant increases in hippocampal volume as a function of lithium treatment,35,65 as well as decreased hippocampal volume in unmedicated patients with bipolar disorder,35 medication effects are unlikely to account for the hippocampal decreases observed here. In addition, our study sample was not homogeneous because it included four patients with bipolar II or NOS diagnoses. However, recent evidence suggests that children and adolescents with bipolar II disorder and bipolar disorder NOS have a phenotype that is on a continuum with bipolar I disorder and that a substantial number go on to meet DSM-IV criteria for bipolar I disorder during follow-up.26 Consistent with this phenotypic continuity, we found that effect sizes for group differences were similar even after excluding non-bipolar I patients (Cohen d for full sample = 0.53; for bipolar I patients alone, d = 0.49). Furthermore, although the majority of patients with bipolar disorder were euthymic at the time of magnetic resonance imaging, two were in a depressed mood state. Again, excluding these two subjects did not significantly alter the results (for euthymic patients alone, Cohen d = 0.56). Finally, although we found no effect of ADHD comorbidity on hippocampal neuroanatomy, we had limited power to examine this issue, which clearly warrants further investigation in samples with larger numbers of patients with and without comorbidity. Thus, although the sample heterogeneity is an acknowledged limitation here, it is also the case that our sample is highly representative of youths with bipolar disorder seen in clinical practice.
As the first investigation using three-dimensional mapping methods to examine hippocampal morphology in children and adolescents with bipolar disorder, this study has revealed some novel findings: subtle, localized hippocampal deformations are present early in the course of illness and age-associated increases in hippocampal size in patients with bipolar disorder, not observed in typically developing controls, suggest abnormal developmental processes during the adolescent period, although longitudinal studies are needed to confirm this. Our understanding of the consequences of abnormal hippocampal development in early-onset bipolar disorder and the development of effective interventions will be advanced by translational research on both normal and abnormal function of this brain structure.
Acknowledgments
This study was funded by grants K23 MH074644-01 (C.E.B.), MH068662, RR020571, and CAPES Foundation (Brazil). Algorithm development was supported by grants from the National Institute for Biomedical Imaging and Bioengineering, the National Center for Research Resources, the National Institute on Aging, and the National Institute for Child Health and Human Development (EB01651, RR019771, AG016570, HD050735 to P.M.T).
Footnotes
This article is the subject of an editorial by Dr. Hilary P. Blumberg in this issue.
Disclosure: Dr. Birmaher has participated in forums sponsored by Solvay Pharmaceuticals and Abcomm, and has received royalties from Random House.
The other authors report no conflicts of interest.
References
- 1.Eichenbaum H, Fortin NJ. Bridging the gap between brain and behavior: cognitive and neural mechanisms of episodic memory. J Exp Anal Behav. 2005;84:619–629. doi: 10.1901/jeab.2005.80-04. [DOI] [PMC free article] [PubMed] [Google Scholar]
- 2.Bannerman DM, Rawlins JN, McHugh SB, et al. Regional dissociations within the hippocampus–memory and anxiety. Neurosci Biobehav Rev. 2004;28:273–283. doi: 10.1016/j.neubiorev.2004.03.004. [DOI] [PubMed] [Google Scholar]
- 3.Bearden CE, Glahn DC, Monkul ES, et al. Sources of declarative memory impairment in bipolar disorder: mnemonic processes and clinical features. J Psychiatr Res. 2006;40:47–58. doi: 10.1016/j.jpsychires.2005.08.006. [DOI] [PubMed] [Google Scholar]
- 4.van Gorp WG, Altshuler L, Theberge DC, Mintz J. Declarative and procedural memory in bipolar disorder. Biol Psychiatry. 1999;46:525–531. doi: 10.1016/s0006-3223(98)00336-9. [DOI] [PubMed] [Google Scholar]
- 5.Altshuler LL, Ventura J, van Gorp WG, et al. Neurocognitive function in clinically stable men with bipolar I disorder or schizophrenia and normal control subjects. Biol Psychiatry. 2004;56:560–569. doi: 10.1016/j.biopsych.2004.08.002. [DOI] [PubMed] [Google Scholar]
- 6.Foland L, Altshuler L, Bookheimer S, et al. Evidence for deficient modulation of amygdala response by prefrontal cortex in bipolar mania. Psychiatry Res. 2008;162:27–37. doi: 10.1016/j.pscychresns.2007.04.007. [DOI] [PMC free article] [PubMed] [Google Scholar]
- 7.Brambilla P, Glahn DC, Balestrieri M, Soares JC. Magnetic resonance findings in bipolar disorder. Psychiatr Clin North Am. 2005;28:443–467. doi: 10.1016/j.psc.2005.01.006. [DOI] [PubMed] [Google Scholar]
- 8.McDonald C, Zanelli J, Rabe-Hesketh S, et al. Meta-analysis of magnetic resonance imaging brain morphometry studies in bipolar disorder. Biol Psychiatry. 2004;56:411–417. doi: 10.1016/j.biopsych.2004.06.021. [DOI] [PubMed] [Google Scholar]
- 9.Geller B, Craney J, Bolhofner K, et al. Two-year prospective follow-up of children with a prepubertal and early adolescent bipolar disorder phenotype. Am J Psychiatry. 2002;159:927–933. doi: 10.1176/appi.ajp.159.6.927. [DOI] [PubMed] [Google Scholar]
- 10.Leverich GS, Post RM, Keck PE, Jr, et al. The poor prognosis of childhood-onset bipolar disorder. J Pediatr. 2007;150:485–490. doi: 10.1016/j.jpeds.2006.10.070. [DOI] [PubMed] [Google Scholar]
- 11.Rende R, Birmaher B, Axelson D, et al. Childhood-onset bipolar disorder: evidence for increased familial loading of psychiatric illness. J Am Acad Child Adolesc Psychiatry. 2007;46:197–204. doi: 10.1097/01.chi.0000246069.85577.9e. [DOI] [PMC free article] [PubMed] [Google Scholar]
- 12.Chen BK, Sassi R, Axelson D, et al. Cross-sectional study of abnormal amygdala development in adolescents and young adults with bipolar disorder. Biol Psychiatry. 2004;56:399–405. doi: 10.1016/j.biopsych.2004.06.024. [DOI] [PubMed] [Google Scholar]
- 13.Dickstein DP, Milham MP, Nugent AC, et al. Frontotemporal alterations in pediatric bipolar disorder: results of a voxel-based morphometry study. Arch Gen Psychiatry. 2005;62:734–741. doi: 10.1001/archpsyc.62.7.734. [DOI] [PubMed] [Google Scholar]
- 14.Chang K, Karchemskiy A, Barnea-Goraly N, et al. Reduced amygdalar gray matter volume in familial pediatric bipolar disorder. J Am Acad Child Adolesc Psychiatry. 2005;44:565–573. doi: 10.1097/01.chi.0000159948.75136.0d. [DOI] [PubMed] [Google Scholar]
- 15.Blumberg H, Kaufman J, Martin A, et al. Amygdala and hippocampal volumes in adolescents and adults with bipolar disorder. Arch Gen Psychiatry. 2003;60:1201–1208. doi: 10.1001/archpsyc.60.12.1201. [DOI] [PubMed] [Google Scholar]
- 16.Frazier JA, Chiu S, Breeze JL, et al. Structural brain magnetic resonance imaging of limbic and thalamic volumes in pediatric bipolar disorder. Am J Psychiatry. 2005;162:1256–1265. doi: 10.1176/appi.ajp.162.7.1256. [DOI] [PubMed] [Google Scholar]
- 17.Duvernoy H. The Human Hippocampus: An Atlas of Applied Anatomy. Munich, Germany: JF Bergman Verlag; 1988. [Google Scholar]
- 18.Gogtay N, Nugent TF, III, Herman DH, et al. Dynamic mapping of normal human hippocampal development. Hippocampus. 2006;16:664–672. doi: 10.1002/hipo.20193. [DOI] [PubMed] [Google Scholar]
- 19.Strange BA, Fletcher PC, Henson RN, Friston KJ, Dolan RJ. Segregating the functions of human hippocampus. Proc Natl Acad Sci U S A. 1999;96:4034–4039. doi: 10.1073/pnas.96.7.4034. [DOI] [PMC free article] [PubMed] [Google Scholar]
- 20.Thompson PM, Hayashi KM, De Zubicaray GI, et al. Mapping hippocampal and ventricular change in Alzheimer disease. Neuroimage. 2004;22:1754–1766. doi: 10.1016/j.neuroimage.2004.03.040. [DOI] [PubMed] [Google Scholar]
- 21.Nicolson R, DeVito TJ, Vidal CN, et al. Detection and mapping of hippocampal abnormalities in autism. Psychiatry Res. 2006;148:11–21. doi: 10.1016/j.pscychresns.2006.02.005. [DOI] [PubMed] [Google Scholar]
- 22.Kaur S, Sassi RB, Axelson D, et al. Cingulate cortex anatomical abnormalities in children and adolescents with bipolar disorder. Am J Psychiatry. 2005;162:1637–1643. doi: 10.1176/appi.ajp.162.9.1637. [DOI] [PubMed] [Google Scholar]
- 23.Sassi RB, Stanley JA, Axelson D, et al. Reduced NAA levels in the dorsolateral prefrontal cortex of young bipolar patients. Am J Psychiatry. 2005;162:2109–2115. doi: 10.1176/appi.ajp.162.11.2109. [DOI] [PubMed] [Google Scholar]
- 24.First MB, Spitzer RL, Gibbon M, Williams JBW. Structured Clinical Interview for DSM-IV Axis I Disorders, Research Version, Patient Edition. New York: Biometrics Research Department, New York State Psychiatric Institute; 1996. [Google Scholar]
- 25.Kaufman J, Birmaher B, Brent D, et al. Schedule for Affective Disorders and Schizophrenia for School-Age Children-Present and Lifetime Version (K-SADS-PL): initial reliability and validity data. J Am Acad Child Adolesc Psychiatry. 1997;36:980–988. doi: 10.1097/00004583-199707000-00021. [DOI] [PubMed] [Google Scholar]
- 26.Birmaher B, Axelson D, Strober M, et al. Clinical course of children and adolescents with bipolar spectrum disorders. Arch Gen Psychiatry. 2006;63:175–183. doi: 10.1001/archpsyc.63.2.175. [DOI] [PMC free article] [PubMed] [Google Scholar]
- 27.Thompson PM, Hayashi KM, Sowell ER, et al. Mapping cortical change in Alzheimer's disease, brain development, and schizophrenia. Neuroimage. 2004;23:S2–S18. doi: 10.1016/j.neuroimage.2004.07.071. [DOI] [PubMed] [Google Scholar]
- 28.Narr KL, Thompson PM, Szeszko P, et al. Regional specificity of hippocampal volume reductions in first-episode schizophrenia. Neuroimage. 2004;21:1563–1575. doi: 10.1016/j.neuroimage.2003.11.011. [DOI] [PubMed] [Google Scholar]
- 29.Apostolova LG, Dutton RA, Dinov ID, et al. Conversion of mild cognitive impairment to Alzheimer disease predicted by hippocampal atrophy maps. Arch Neurol. 2006;63:693–699. doi: 10.1001/archneur.63.5.693. [DOI] [PubMed] [Google Scholar]
- 30.Sled JG, Pike GB. Standing-wave and RF penetration artifacts caused by elliptic geometry: an electrodynamic analysis of MRI. IEEE Trans Med Imaging. 1998;17:653–662. doi: 10.1109/42.730409. [DOI] [PubMed] [Google Scholar]
- 31.Shattuck DW, Sandor-Leahy SR, Schaper KA, Rottenberg DA, Leahy RM. Magnetic resonance image tissue classification using a partial volume model. Neuroimage. 2001;13:856–876. doi: 10.1006/nimg.2000.0730. [DOI] [PubMed] [Google Scholar]
- 32.Woods RP. Multitracer: a Java-based tool for anatomic delineation of grayscale volumetric images. Neuroimage. 2003;19:1829–1834. doi: 10.1016/s1053-8119(03)00243-x. [DOI] [PubMed] [Google Scholar]
- 33.Becker JT, Davis SW, Hayashi KM, et al. Three-dimensional patterns of hippocampal atrophy in mild cognitive impairment. Arch Neurol. 2006;63:97–101. doi: 10.1001/archneur.63.1.97. [DOI] [PubMed] [Google Scholar]
- 34.Frisoni GB, Sabattoli F, Lee AD, et al. In vivo neuropathology of the hippocampal formation in AD: a radial mapping MR-based study. Neuroimage. 2006;32:104–110. doi: 10.1016/j.neuroimage.2006.03.015. [DOI] [PubMed] [Google Scholar]
- 35.Bearden C, Thompson P, Dutton R, et al. Three-dimensional mapping of hippocampal anatomy in unmedicated and lithium-treated patients with bipolar disorder. Neuropsychopharmacology. doi: 10.1038/sj.npp.1301507. in press. [DOI] [PMC free article] [PubMed] [Google Scholar]
- 36.Pantel J, Cretsinger K, Keefe H. Hippocampus tracing guidelines. [2005];2005 http://www.psychiatry.uiowa.edu/mhcrc/pdf/papers/hippocampus.pdf.
- 37.Thompson PM, Schwartz C, Toga AW. High-resolution random mesh algorithms for creating a probabilistic 3D surface atlas of the human brain. Neuroimage. 1996;3:19–34. doi: 10.1006/nimg.1996.0003. [DOI] [PubMed] [Google Scholar]
- 38.Apostolova LG, Dinov ID, Dutton RA, et al. 3D comparison of hippocampal atrophy in amnestic mild cognitive impairment and Alzheimer's disease. Brain. 2006;129:2867–2873. doi: 10.1093/brain/awl274. [DOI] [PubMed] [Google Scholar]
- 39.Csernansky JG, Wang L, Jones D, et al. Hippocampal deformities in schizophrenia characterized by high dimensional brain mapping. Am J Psychiatry. 2002;159:2000–2006. doi: 10.1176/appi.ajp.159.12.2000. [DOI] [PubMed] [Google Scholar]
- 40.Styner M, Lieberman JA, Pantazis D, Gerig G. Boundary and medial shape analysis of the hippocampus in schizophrenia. Med Image Anal. 2004;8:197–203. doi: 10.1016/j.media.2004.06.004. [DOI] [PubMed] [Google Scholar]
- 41.West MJ, Gundersen HJ. Unbiased stereological estimation of the number of neurons in the human hippocampus. J Comp Neurol. 1990;296:1–22. doi: 10.1002/cne.902960102. [DOI] [PubMed] [Google Scholar]
- 42.Goldman-Rakic PS, Selemon LD, Schwartz ML. Dual pathways connecting the dorsolateral prefrontal cortex with the hippocampal formation and parahippocampal cortex in the rhesus monkey. Neuroscience. 1984;12:719–743. doi: 10.1016/0306-4522(84)90166-0. [DOI] [PubMed] [Google Scholar]
- 43.Frazier JA, Ahn MS, DeJong S, et al. Magnetic resonance imaging studies in early-onset bipolar disorder: a critical review. Harv Rev Psychiatry. 2005;13:125–140. doi: 10.1080/10673220591003597. [DOI] [PubMed] [Google Scholar]
- 44.Nugent TF, 3rd, Herman DH, Ordonez A, et al. Dynamic mapping of hippocampal development in childhood onset schizophrenia. Schizophr Res. 2007;90:62–70. doi: 10.1016/j.schres.2006.10.014. [DOI] [PubMed] [Google Scholar]
- 45.Squire L. Memory systems of the brain: a brief history and current perspective. Neurobiol Learn Mem. 2004;82:171–177. doi: 10.1016/j.nlm.2004.06.005. [DOI] [PubMed] [Google Scholar]
- 46.Gabrieli JD, Brewer JB, Desmond JE, Glover GH. Separate neural bases of two fundamental memory processes in the human medial temporal lobe. Science. 1997;276:264–266. doi: 10.1126/science.276.5310.264. [DOI] [PubMed] [Google Scholar]
- 47.Bearden C, Glahn D, Caetano S, et al. Evidence for disruption in prefrontal cortical functions in juvenile bipolar disorder. Bipolar Disord. 2007;9:145–159. doi: 10.1111/j.1399-5618.2007.00453.x. [DOI] [PubMed] [Google Scholar]
- 48.Glahn DC, Bearden CE, Caetano S, et al. Declarative memory impairment in pediatric bipolar disorder. Bipolar Disord. 2005;7:546–554. doi: 10.1111/j.1399-5618.2005.00267.x. [DOI] [PubMed] [Google Scholar]
- 49.Pavuluri MN, Schenkel LS, Aryal S, et al. Neurocognitive function in unmedicated manic and medicated euthymic pediatric bipolar patients. Am J Psychiatry. 2006;163:286–293. doi: 10.1176/appi.ajp.163.2.286. [DOI] [PubMed] [Google Scholar]
- 50.McClure EB, Treland JE, Snow J, et al. Memory and learning in pediatric bipolar disorder. J Am Acad Child Adolesc Psychiatry. 2005;44:461–469. doi: 10.1097/01.chi.0000156660.30953.91. [DOI] [PubMed] [Google Scholar]
- 51.Sapolsky RM. The possibility of neurotoxicity in the hippocampus in major depression: a primer on neuron death. Biol Psychiatry. 2000;48:755–765. doi: 10.1016/s0006-3223(00)00971-9. [DOI] [PubMed] [Google Scholar]
- 52.Campbell S, Macqueen G. The role of the hippocampus in the pathophysiology of major depression. J Psychiatry Neurosci. 2004;29:417–426. [PMC free article] [PubMed] [Google Scholar]
- 53.Herman JP, Cullinan WE. Neurocircuitry of stress: central control of the hypothalamo-pituitary-adrenocortical axis. Trends Neurosci. 1997;20:78–84. doi: 10.1016/s0166-2236(96)10069-2. [DOI] [PubMed] [Google Scholar]
- 54.Bremner JD. Does stress damage the brain? Biol Psychiatry. 1999;45:797–805. doi: 10.1016/s0006-3223(99)00009-8. [DOI] [PubMed] [Google Scholar]
- 55.Sheline YI, Gado MH, Kraemer HC. Untreated depression and hippocampal volume loss. Am J Psychiatry. 2003;160:1516–1518. doi: 10.1176/appi.ajp.160.8.1516. [DOI] [PubMed] [Google Scholar]
- 56.McEwen BS, Magarinos AM. Stress and hippocampal plasticity: implications for the pathophysiology of affective disorders. Hum Psychopharmacol. 2001;16:S7–S19. doi: 10.1002/hup.266. [DOI] [PubMed] [Google Scholar]
- 57.MacQueen GM, Campbell S, McEwen BS, et al. Course of illness, hippocampal function, and hippocampal volume in major depression. Proc Natl Acad Sci U S A. 2003;100:1387–1392. doi: 10.1073/pnas.0337481100. [DOI] [PMC free article] [PubMed] [Google Scholar]
- 58.Benes FM, Turtle M, Khan Y, Farol P. Myelination of a key relay zone in the hippocampal formation occurs in the human brain during childhood, adolescence, and adulthood. Arch Gen Psychiatry. 1994;51:477–484. doi: 10.1001/archpsyc.1994.03950060041004. [DOI] [PubMed] [Google Scholar]
- 59.Giedd JN, Blumenthal J, Jeffries NO, et al. Brain development during childhood and adolescence: a longitudinal MRI study. Nat Neurosci. 1999;2:861–863. doi: 10.1038/13158. [DOI] [PubMed] [Google Scholar]
- 60.Giedd JN, Snell JW, Lange N, et al. Quantitative magnetic resonance imaging of human brain development: ages 4–18. Cereb Cortex. 1996;6:551–560. doi: 10.1093/cercor/6.4.551. [DOI] [PubMed] [Google Scholar]
- 61.Arnold SE, Trojanowski JQ. Human fetal hippocampal development: I. Cytoarchitecture, myeloarchitecture, and neuronal morphologic features. J Comp Neurol. 1996;367:274–292. doi: 10.1002/(SICI)1096-9861(19960401)367:2<274::AID-CNE9>3.0.CO;2-2. [DOI] [PubMed] [Google Scholar]
- 62.Arnold SE, Trojanowski JQ. Human fetal hippocampal development: II. The neuronal cytoskeleton. J Comp Neurol. 1996;367:293–307. doi: 10.1002/(SICI)1096-9861(19960401)367:2<293::AID-CNE10>3.0.CO;2-S. [DOI] [PubMed] [Google Scholar]
- 63.Benes FM. Myelination of cortical-hippocampal relays during late adolescence. Schizophr Bull. 1989;15:585–593. doi: 10.1093/schbul/15.4.585. [DOI] [PubMed] [Google Scholar]
- 64.Masi G, Perugi G, Millepiedi S, et al. Developmental differences according to age at onset in juvenile bipolar disorder. J Child Adolesc Psychopharmacol. 2006;16:679–685. doi: 10.1089/cap.2006.16.679. [DOI] [PubMed] [Google Scholar]
- 65.Yucel K, Taylor VH, McKinnon MC, et al. Bilateral hippocampal volume increase in patients with bipolar disorder and short-term lithium treatment. Neuropsychopharmacology. 2007 doi: 10.1038/sj.npp.1301405. [DOI] [PubMed] [Google Scholar]
- 66.Hamilton M. A rating scale for depression. J Neurol Neurosurg Psychiatry. 1960;23:56–62. doi: 10.1136/jnnp.23.1.56. [DOI] [PMC free article] [PubMed] [Google Scholar]