

Abstract
Purpose
Autofluorescence imaging is increasingly used to noninvasively identify neoplastic oral cavity lesions. Improving the diagnostic accuracy of these techniques requires a better understanding of the biological basis for optical changes associated with neoplastic transformation in oral tissue.
Experimental Design
A total of 49 oral biopsies were considered in this study. The autofluorescence patterns of viable normal, benign, and neoplastic oral tissue were imaged using high-resolution confocal fluorescence microscopy.
Results
The autofluorescence properties of oral tissue vary significantly based on anatomic site and pathologic diagnosis. In normal oral tissue, most of the epithelial autofluorescence originates from the cytoplasm of cells in the basal and intermediate regions, whereas structural fibers are responsible for most of the stromal fluorescence. A strongly fluorescent superficial layer was observed in tissues from the palate and the gingiva, which contrasts with the weakly fluorescent superficial layer found in other oral sites. Upon UV excitation, benign inflammation shows decreased epithelial fluorescence, whereas dysplasia displays increased epithelial fluorescence compared with normal oral tissue. Stromal fluorescence in both benign inflammation and dysplasia drops significantly at UV and 488 nm excitation.
Conclusion
Imaging oral lesions with optical devices/probes that sample mostly stromal fluorescence may result in a similar loss of fluorescence intensity and may fail to distinguish benign from precancerous lesions. Improved diagnostic accuracy may be achieved by designing optical probes/devices that distinguish epithelial fluorescence from stromal fluorescence and by using excitation wavelengths in the UV range.
Oral cancer is one of the most common malignancies worldwide, and carries one of the lowest overall survival rates (1, 2). Despite the easy accessibility of the oral cavity to examination, most patients present with advanced disease, when treatment is associated with higher morbidity, more expense, and less success than earlier interventions. Early detection of oral cancer can greatly improve treatment outcomes. Unfortunately, there is no method to adequately screen and diagnose early oral cancers and precancers because detection still relies on the clinicians' ability to visually identify subtle neoplastic changes, and to distinguish these changes from more common inflammatory conditions. Technologic advances are needed to assist clinical diagnosis of oral cancer.
Autofluorescence imaging has been used successfully to rapidly and noninvasively distinguish malignant oral lesions from surrounding tissue in several pilot studies (3–5). A low-cost device for visualization of oral autofluorescence was used to identify high-risk precancerous and cancerous lesions with 98% sensitivity and 100% specificity based on the loss of fluorescence in abnormal sites compared with normal tissue (6). This device is now commercially available.5 Autofluorescence spectroscopy has also emerged as a noninvasive technology for diagnosing precancers and cancers in several organ sites (7–12). In the oral cavity, several groups used fluorescence spectroscopy to distinguish oral lesions from normal tissue with high specificity and sensitivity (ranging from 81% to 100%; refs. 13–18). Despite preliminary clinical evidence indicating the potential role of fluorescence imaging and spectroscopy for improved detection of early neoplasia in the oral cavity, there is a limited understanding of the biological basis for optical changes associated with neoplastic transformation of oral tissue.
The diagnostic potential of fluorescence imaging and spectroscopy lies in the ability to noninvasively probe alterations in tissue morphology and biochemistry that occur during malignant progression. Fluorescence in epithelial tissue originates from multiple fluorophores (molecules that, when excited by light, emit energy in the form of fluorescence) and is influenced by absorption and scattering as light propagates through the epithelium and stroma. In the cervix, which is histologically similar to oral tissue in many respects, epithelial fluorescence originates from the cytoplasm of cells and is linked to the metabolic indicators reduced nicotinamide adenine dinucleotide (NADH) and flavin adenine dinucleotide (FAD), which increase as dysplasia develops (19–21). Neoplastic progression is also associated with increased nuclear size and chromatin texture, which leads to increased epithelial scattering (22, 23).
Carcinogenesis involves complex biochemical signaling between the epithelial cells and the surrounding extracellular matrix (24–26). Subepithelial chronic inflammatory microenvironments express products that induce angiogenesis and degradation of the extracellular matrix, which in turn, stimulates the promotion of cancer in the epithelium (27). Because altered stromal properties may precede epithelial changes during carcinogenesis (28), understanding the autofluorescence patterns in the stroma and the effect of inflammation on these patterns may help explain the spectral differences in normal oral mucosa and early dysplasia. Confocal images and spectroscopy analysis indicate that collagen crosslinks are the major fluorophore in stroma in the cervix (29). Remodeling of the stroma during cervical carcinogenesis leads to structural changes in the collagen matrix accompanied by loss of collagen fluorescence (19) and a decrease in stromal scattering (30). Thus, to harness the full potential of fluorescence-based diagnosis, it is important to clarify how both epithelial and stromal alterations in oral tissue contribute to the changes in the overall optical properties during carcinogenesis.
Epithelial and stromal autofluorescence patterns can be directly visualized using fluorescence microscopy of viable ex vivo oral tissue. High spatial resolution is necessary to assess variability in the microscopic origin of autofluorescence within the epithelial or stromal layer. Here, we qualitatively and quantitatively examined the distribution of autofluorescence at the cellular level in viable oral tissue using laser scanning confocal fluorescence microscopy. Our first objective was to characterize the origins of autofluorescence in normal oral mucosa and to assess how anatomic site variations affect these autofluorescence patterns. Second, we investigated how inflammation and dysplasia alter the autofluorescence properties of oral tissue. Third, we compared the autofluorescence patterns of oral cancers with different grades of differentiation. Understanding the biological basis underlying alteration in autofluorescence in epithelial and stromal layers during oral carcinogenesis will facilitate the development of accurate diagnostic algorithms to differentiate normal, benign, precancerous, and cancerous oral tissue; an important step needed to achieve the full diagnostic potential of this technology.
Materials and Methods
Oral tissue collection and preparation of fresh tissue slices
Clinical protocols were approved by the Institutional Review Boards at The University of Texas M. D. Anderson Cancer Center, The University of Texas at Austin, and Rice University. A clinically normal and one or more clinically abnormal biopsy were obtained from each consenting patient at the M. D. Anderson Cancer Center. Biopsies were immediately stored in iced phenol-free DMEM (Sigma-Aldrich) and kept there until examination. Transverse tissue slices ∼200 μm thick were obtained from each fresh biopsy using a Krumdieck tissue slicer (Alabama Research and Development, Munford, AL). Note that prior to fluorescence imaging, slices were not fixed or processed in any way. Each unstained and unprocessed tissue slice was imaged with an inverted Leica SP2 AOBS confocal laser scanning fluorescence microscope (Leica Microsystems) within 12 h after biopsy collection. Detailed procedures for tissue cutting and preparation for imaging are described elsewhere (19, 21).
Confocal microscopy and image collection
Optical sections from each tissue slice were obtained at both UV and 488 nm excitation using a 40× oil immersion objective. UV excitation was provided by an argon laser at 351 and 364 nm, and an argon/krypton laser was used for 488 nm excitation. Prior analysis on cervical tissue (29) has indicated that UV excitation (at 351 and 364 nm) targets predominantly NADH in the epithelium and collagen fibers in the stroma, whereas 488 nm excitation targets FAD in the epithelium in addition to stromal fibers. The oil immersion objective had a numerical aperture of 1.25 and a working distance of 80 μm. Single optical sections of each region of interest were obtained at a fixed depth of 15 μm beneath the coverslip. The fluorescence signal at UV excitation was collected from 380 to 500 nm, whereas at 488 nm excitation, fluorescence was collected from 505 to 650 nm. The field of view for each image was 375 × 375 μm. The lateral resolution was limited by the pixel size of the detector and was 0.73 μm. The axial step size varied from 1.0 to 1.2 μm. In order to perform quantitative comparisons, all images were taken with the same detector settings and corrections for laser power variations were done prior to analysis.
In tissue slices with well-defined layered structures (normal, inflammation, and dysplasia), adjacent images were acquired to include the whole thickness of the epithelium and the more superficial stromal regions down to ∼1 mm in depth. In tissue slices without a defined structure (invasive carcinoma), several images were taken, starting from what seemed to be the surface of the tissue slice and ending ∼1 mm below this edge. Adjacent confocal images were tiled together in order to provide a large-scale mosaic view of each region of interest. Some adjacent images had a considerable area of overlap, which was cropped off prior to assembly of the mosaic view. Brightness and contrast was readjusted by the same amount for all confocal images prior to display.
Histopathology
After imaging, tissue slices were fixed in 10% formalin and prepared for pathologic examination using standard protocols. H&E-stained sections were obtained from each imaged tissue slice and reviewed by experienced head and neck pathologists. A pathologic diagnosis of normal, dysplasia, or cancer was rendered; hyperkeratosis and hyperplasia were treated as normal for further analysis. In addition, the absence or presence (and degree) of inflammation was determined.
Image analysis including average fluorescence intensity and redox ratio calculations
An initial qualitative assessment of autofluorescence patterns was done, comparing variations by anatomic site and pathologic diagnosis. Then, the UV and 488 nm images were overlaid and examined visually. In normal and precancerous tissue slices, the fluorescence patterns were examined in the superficial, intermediate, and basal epithelium as well as in the superficial and deep stroma. Tissue slices diagnosed with invasive cancers displayed a loss of layered morphology. After visually identifying common morphologic and fluorescence patterns, tumor images were divided into subregions, including regions with tumor cells and surrounding fiber matrix.
Quantitative image analysis was done in the following manner: after background subtraction, the UV and 488 nm images for each tissue slice were overlaid. Several regions containing cells and stroma were outlined based on the appearance of the overlaid images. The average grayscale values of all pixels within an outlined region were calculated in order to obtain the mean fluorescence intensity value (FIV) for each region. These calculations were done for both the UV and 488 nm images. In addition, the average redox ratio value was calculated for the cellular regions in each tissue slice by dividing the mean FIV at 488 nm excitation for the region by the sum of the mean FIV at UV and the mean FIV at 488 nm excitation for the same region. The redox ratio reflects changes in the concentrations and redox potentials of the metabolic indicators NADH and FAD, and has been used in previous research to monitor cellular metabolism (20, 21).
Finally, all tissue slices were grouped according to their pathologic diagnosis, and the mean FIV and redox ratio were calculated for each diagnostic category. For normal, inflammatory, and dysplastic samples, which retain a well-defined layered morphology, tissue slices were grouped by both pathologic diagnosis and anatomic site. For tissue slices from cancerous lesions, samples were grouped by diagnosis regardless of anatomic site. The average FIV was calculated for cellular and stromal regions by averaging the mean FIV for each tissue slice for that diagnostic group and anatomic site. The average FIVs were used to compare changes in the fluorescence characteristics of oral tissue that occur in association with neoplastic development. In a similar manner, the average redox ratio was obtained for each diagnostic group.
Results
A total of 49 oral biopsies were obtained in this study. The biopsies were subdivided according to oral anatomic type and pathologic diagnosis. Oral biopsies from five different anatomic types were imaged including the tongue, palate, gingiva, buccal mucosa, and the floor of the mouth. Each biopsy was assigned to the following pathologic diagnostic subcategories: normal without inflammation (eight tongue biopsies, two palate biopsies, two gingival biopsies, two buccal mucosa biopsies, and four floor of the mouth biopsies), normal with mild to moderate inflammation (two tongue biopsies, two gingival biopsies, and three floor of the mouth biopsies), normal with severe inflammation (three tongue biopsies), dysplasia (six tongue biopsies and two palate biopsies), well-differentiated carcinoma (three tongue biopsies, one palate biopsy, and two floor of the mouth biopsies), moderately differentiated carcinoma (five tongue biopsies and one floor of the mouth biopsy), and poorly differentiated carcinoma (one palate biopsy).
Normal oral mucosa autofluorescence patterns
Figure 1 displays confocal images at UV and 488 nm excitation from a representative normal tongue tissue slice. At UV excitation, most of the epithelial fluorescence originates from the cytoplasm of cells occupying roughly the lower two-thirds of the epithelial layer (Fig. 1A). At 488 nm excitation, these same cells have less cytoplasmic fluorescence compared with the upper one-third of the epithelium (Fig. 1B). Strong stromal autofluorescence at both excitation wavelengths originates from a dense matrix of structural fibers and does not vary significantly with depth.
Fig. 1.
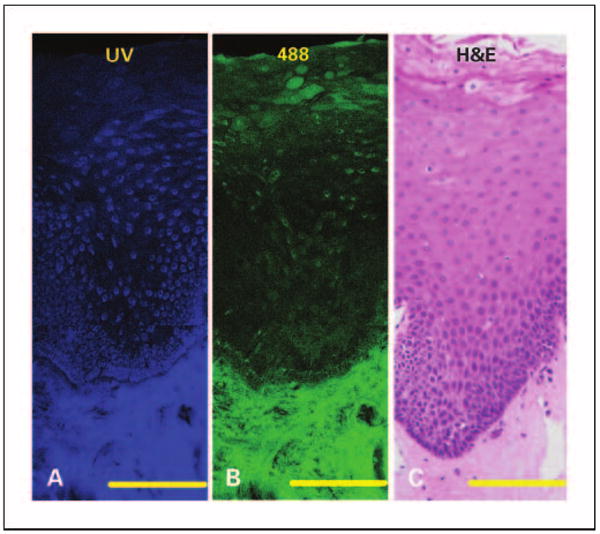
Fluorescence and histologic images of normal tongue without inflammation. Mosaic of confocal fluorescence images at UV excitation (A), 488 excitation (B), and H&E staining (C). Bars, 200 μm (in the confocal images); bars, 125 μm (in the H&E image).
The autofluorescence characteristics of normal oral mucosa from different anatomic sites are compared in Fig. 2. Oral epithelium often retains a superficial keratin-containing layer which is highly fluorescent. We observed the presence of this highly fluorescent superficial layer in epithelia from the palate and gingiva (Fig. 2A and B). In contrast, epithelia from the floor of the mouth, buccal mucosa, and the tongue (Fig. 2C and D, and Fig. 1) display a weakly fluorescent superficial layer. Deep in this superficial layer, the autofluorescence patterns of epithelia in all tissue sites except the gingiva are generally similar. Gingival epithelia, in contrast to other oral sites such as the tongue (Fig. 1), is dominated by cells that have low fluorescence at UV excitation but high fluorescence at 488 nm excitation. The diminished cytoplasmic fluorescence at UV excitation was observed in all gingival samples, although the number of gingival samples examined was limited.
Fig. 2.
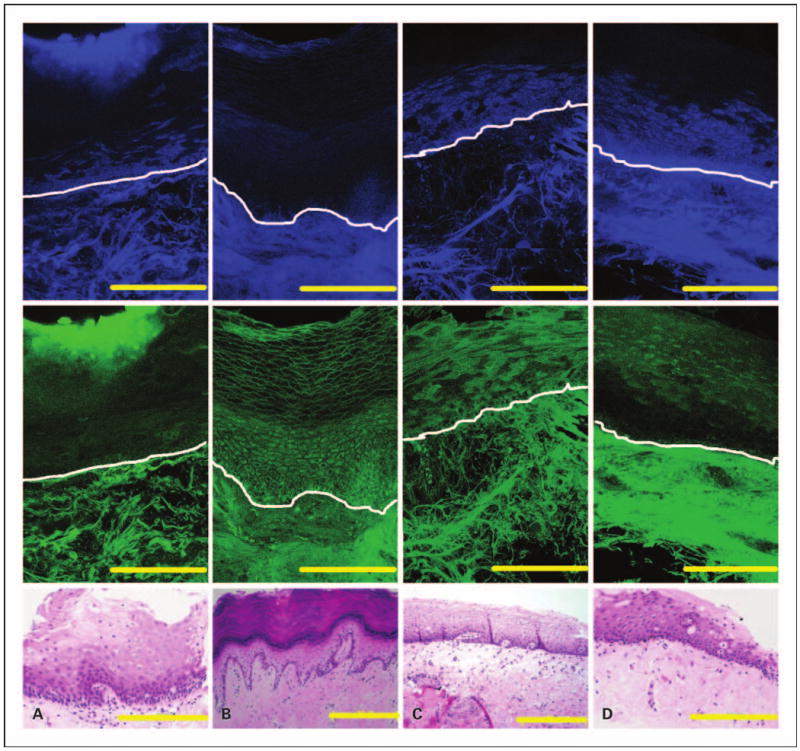
Fluorescence and histologic images of four normal oral sites without inflammation. Mosaic of confocal fluorescence images at both UV (top row) and 488 nm excitation (middle row), and H&E image (bottom row) from the palate (A), gingiva (B), floor of the mouth (C), and buccal mucosa (D). White lines, approximate location of the basement membrane. Bars, 200 μm.
Autofluorescence patterns in inflammatory and dysplastic oral tongue tissue
Representative fluorescence images of oral tongue lesions diagnosed as normal, nondysplastic epithelium with severe inflammation (Fig. 3A), and mildly dysplastic epithelium with mild to moderate inflammation (Fig. 3B) were compared. Mild dysplasia and severe inflammation could be distinguished based on differences in epithelial fluorescence at UV excitation. A large decrease in fluorescence at UV excitation is observed in the normal basal epithelium overlying inflammatory stroma compared with normal noninflammatory tongue epithelium (Fig. 1A). In contrast, dysplastic epithelium displays a small increase in fluorescence at UV excitation, compared with normal noninflammatory tongue epithelium. Thus, the representative images in Fig. 3 indicate that dysplastic epithelium is significantly more fluorescent than the normal basal epithelium overlying severely inflamed stroma. Images from a nondysplastic floor of the mouth sample with mild to moderate inflammation in the stroma show a similar loss of epithelial fluorescence at UV excitation as in the tongue (data not shown).
Fig. 3.
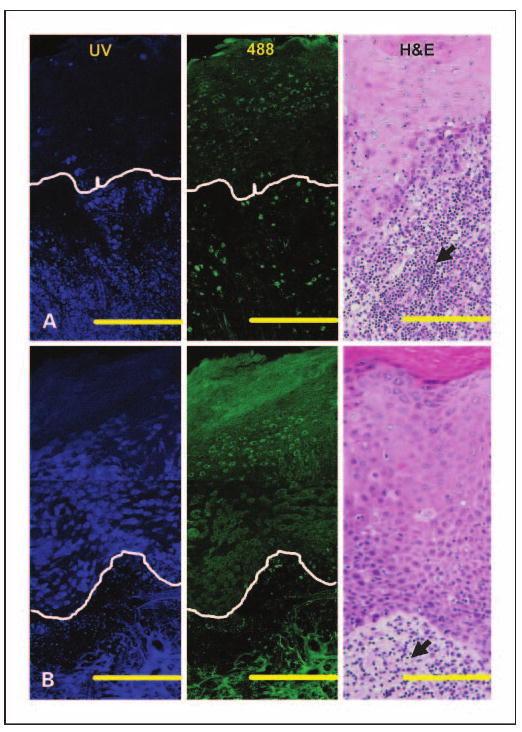
Fluorescence patterns of inflammation (A) and mild dysplasia (B) in the tongue. Mosaic of confocal fluorescence images at UV (left), 488 nm excitation (middle), and H&E (right) images. The histopathologic diagnosis of (A) is normal, nondysplastic epithelium with severe inflammation and of (B) is mildly dysplastic epithelium with mild to moderate inflammation. White lines, the approximate location of the basement membrane. Bars, 200 μm (in the confocal images); bars, 120 μm (in the H&E images). Arrowheads, lymphocytic infiltration; N, normal without inflammation; NSI, normal with severe inflammation; DMI, mild dysplasia.
Stromal areas directly beneath the basement membrane in both the inflammatory and the dysplastic examples exhibit a large loss in fluorescence at UV and 488 nm excitation. In the loose stromal matrix evident in both samples, autofluorescence signals originate predominantly from cells rather than from fibers as seen in normal oral tissue. This shift in origin of stromal fluorescence from fibers to cells, which is more obvious in the severe inflammation case, seems to be associated with the influx of inflammatory cells in this area, as confirmed in H&E images (black arrows in Fig. 3). In the dysplastic example, these stromal changes affect only the region 100 to 200 μm below the basement membrane. In particular, stromal fluorescence and fiber density decrease predominantly in areas underling the epithelium, whereas autofluorescence patterns of deeper stroma seem to be similar to normal stroma.
Quantitative analysis of fluorescence in normal, benign, and dysplastic oral tongue slices
Figure 4A and B illustrate how images of tissue slices with well-defined layered morphology were divided into subregions for quantitative analysis. The superficial epithelial region includes cells that retain keratin (white area in Fig. 4B). Nonkeratinized epithelial cells displaying a weak cytoplasmic fluorescence signal at UV excitation are defined as type 1 cells (green area in Fig. 4B). At 488 nm excitation; type 1 cells display an increased cytoplasmic fluorescence signal compared with the rest of the nonkeratinized epithelium. Epithelial cells with a strong cytoplasmic fluorescence signal at UV excitation are defined as type 2 cells (blue area in Fig. 4B). Stromal region 1 occupies an area ∼100 to 200 μm below the basement membrane. Stromal region 2 is situated below stromal region 1, and occupies an area that is ∼200 to 500 μm deep. For all tissue slices obtained from the tongue, the mean FIV was calculated for each region by diagnostic category for slices diagnosed as normal, inflammatory or dysplastic; results are shown in Fig. 4C and D.
Fig. 4.
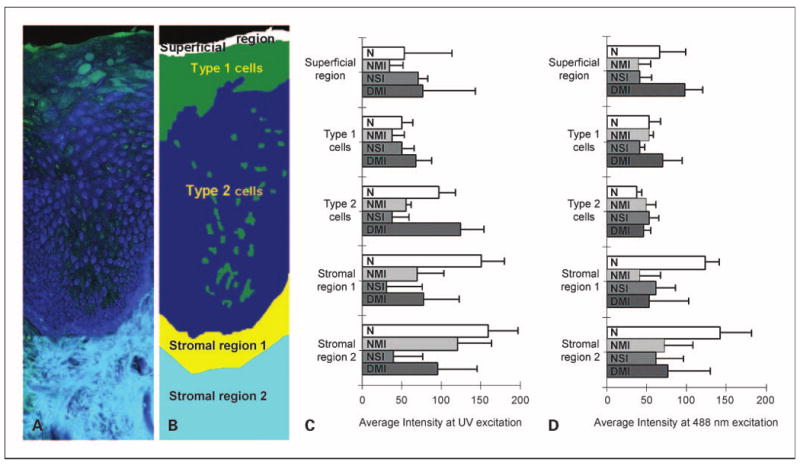
Quantitative analysis of average fluorescent intensities of normal, inflammatory, and dysplastic tongue tissue. Overlaid UV and 488 nm excited fluorescence images (A) and a simplified cartoon of normal tongue (B) showing the approximate distribution of the epithelial and stromal regions. Type 1 cells represent cells with weak cytoplasmic fluorescence at UV excitation. Type 2 cells represent cells with strong cytoplasmic fluorescence at UV excitation. Stromal region 1 includes stroma that is 100 to 200 μm below the basement membrane, whereas stromal region 2 represents deeper stroma. Average fluorescence intensities at UVexcitation (C) and 488 nm excitation (D) for each epithelial and stromal subregion. Bars, 1 SD. N, normal without inflammation (n = 8); NMI, normal with mild to moderate inflammation (n = 2); NSI, normal with severe inflammation (n = 3); DMI, dysplasia with mild to moderate inflammation (n = 6).
In normal tongue epithelium, type 2 cells display the highest average fluorescence intensity at UV excitation but the lowest value at 488 nm excitation. The average redox values for type 2 cells are 1.8 times lower than the redox values for type 1 cells (data not shown) indicating an increased metabolic activity in this region of the epithelium. In all normal tongue samples, type 2 cells occupied more than half of the nonkeratinized part of the epithelium. These data suggest that a majority of the normal tongue epithelium is occupied by cells with bright UV cytoplasmic fluorescence and weak 488 nm cytoplasmic fluorescence.
Average fluorescence intensities for type 2 cells at UV excitation (Fig. 4C) illustrate the differences in epithelial fluorescence between normal, inflammatory, and dysplastic tongue samples. In dysplasias, fluorescence from type 2 cells increases by a factor of 1.3 on average compared with the normal tongue. In contrast, inflammatory tongue tissue displays a large drop in the average fluorescence intensity of type 2 cells, which is more pronounced for samples with severe inflammation. Thus, type 2 cells in dysplastic lesions exhibit an increase in UV-excited fluorescence by a factor of >4 compared with lesions with severe inflammation. These modifications in epithelial fluorescence at UV excitation are not accompanied by significant changes in the 488 nm excited fluorescence.
Average fluorescence values from stromal region 1 (Fig. 4C and D) reveal that both inflammatory and dysplastic lesions are characterized by a large loss of stromal fluorescence at both excitations. Mild to moderate inflammation and dysplasia show a similar drop in fluorescence at UV excitation (by a factor of >2) compared with normal values. Severe inflammation displays an even more pronounced decrease (by factor of 4 at UV excitation) compared with mild to moderate inflammation and dysplasia. The degree of inflammation also determines the depth of the affected stromal areas. Severe inflammation displays a very large loss of fluorescence in both stromal regions 1 and 2. In mild to moderate inflammation and dysplasia, fluorescence from stromal region 2 is higher compared with severe inflammation.
Autofluorescence patterns of well, moderately, and poorly differentiated carcinomas
Figure 5 displays representative confocal fluorescence images of well, moderately, and poorly differentiated carcinomas, whereas Fig. 6A and B show how images of cancers were divided into three subregions. A common feature present in all cancers is the absence of a layered morphology and the aggregation of cancer cells in clearly defined regions (Fig. 6A and B). Type 1 cancer cells are characterized by an absence of cytoplasmic fluorescence at UV excitation but a strong cytoplasmic signal at 488 nm excitation. Type 2 cancer cells display an easily visualized cytoplasmic fluorescence at UV excitation. Cancer cells are surrounded by matrix fibers. Matrix regions with dense, brightly fluorescent fibers, and those without a significant cellular component are defined here as fibrous stroma (light blue region in Fig. 6B). Matrix regions with a dominant cellular component, consisting of inflammation and atypical cells, are very heterogeneous and difficult to outline. These regions were excluded from the analysis of cancer images and are not shown in Fig. 6. Some tissue slices contained submucosal tumors. Figure 5A shows an example of a well-differentiated submucosal tumor underneath a mildly dysplastic surface epithelium. Cells from the surface epithelium overlying submucosal tumors were excluded from quantitative analysis of carcinomas.
Fig. 5.
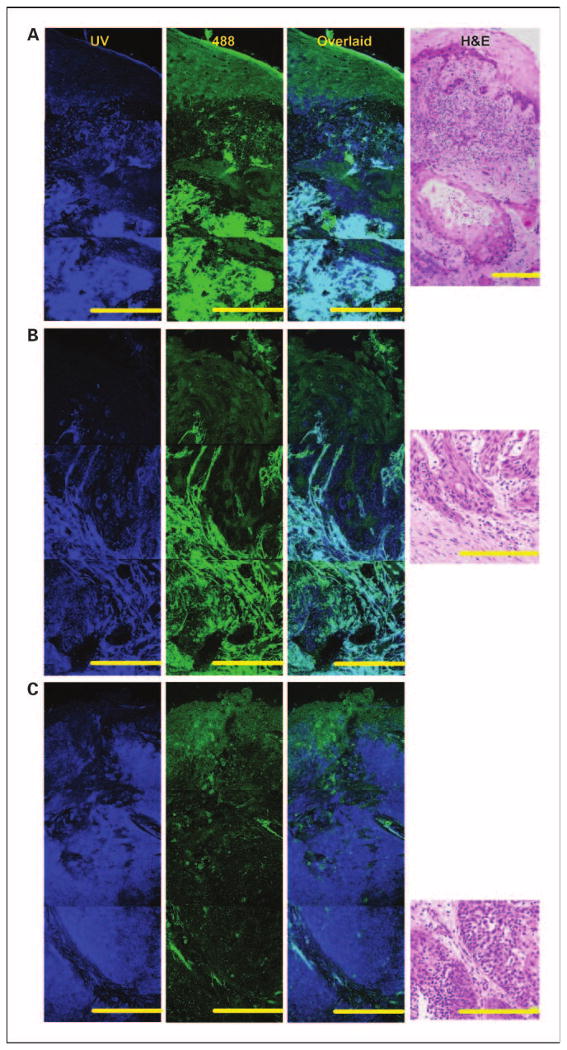
Fluorescence patterns of invasive tumors in the oral cavity. Mosaic of confocal fluorescence images at UV (first column) and 488 nm excitation (second column); overlaid UVand 488 nm images (third column) and H&E images (fourth column). A, mildly dysplastic epithelium overlaying well-differentiated submucosal carcinoma in the tongue. B, moderately differentiated carcinoma in the tongue. C, poorly differentiated carcinoma in the palate. Bars, 200 μm.
Fig. 6.
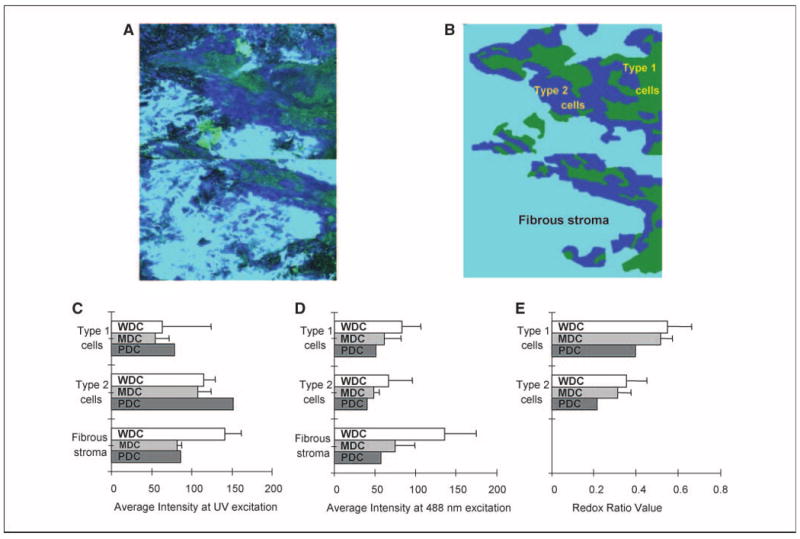
Quantitative analysis of invasive tumors. Overlaid UV and 488 nm excited fluorescence images (A) and a simplified cartoon of an invasive tumor (B) showing the distribution of type 1 (green) and type 2 (dark blue) cancer cells surrounded by fibrous stroma (light blue). Type 1cells represent cells with weak cytoplasmic fluorescence at UV excitation. Type 2 cells represent cells with strong cytoplasmic fluorescence at UV excitation. Fibrous stroma includes matrix with a dominant fiber component (see Results for details). Average fluorescence intensities at UV (C) and 488 nm (D) excitation for each subregion and average redox ratio (E) values for type 1 and type 2 cancer cells. Bars, 1SD.WDC, well-differentiated carcinoma; MDC, moderately differentiated carcinoma; PDC, poorly differentiated carcinoma.
Average FIVs for type 1 and type 2 cancer cells are compared in Fig. 6C and D. The poorly differentiated tumor shows the highest fluorescence intensity at UV excitation for both cell types and the lowest fluorescence at 488 nm excitation. Average redox values for type 1 and 2 cancer cells are shown in Fig. 6D. The poorly differentiated carcinoma displays the lowest redox values, especially for type 2 cells. Because redox values are inversely proportional to metabolic activity, these results provide support for the clinical tenet that poorly differentiated carcinoma cells are more metabolically active, on average, than cells in more differentiated tumors. In addition, average FIVs show that fibrous stroma in well-differentiated tumors generally have higher fluorescence at both excitation wavelengths when compared with less differentiated carcinomas.
Discussion
Understanding how optical properties are altered during oral carcinogenesis is critical for optimizing diagnostic technologies for oral cancer detection based on autofluorescence imaging and spectroscopy. In this study, we used high-resolution microscopy to investigate patterns of autofluorescence in normal oral mucosa and in benign and neoplastic oral lesions. Our results show that the autofluorescence properties of oral tissue vary based on the anatomic site within the oral cavity and the pathologic diagnosis. The fluorescence signals from epithelial and stromal layers can change independently of other tissue layers. This has important implications for the clinical diagnosis of oral lesions using fluorescence imaging and spectroscopy.
When normal oral tissue is illuminated by UV light, most of the epithelial autofluorescence that is generated originates from the cytoplasm of cells occupying the basal and intermediate layers. Similar findings were found using confocal images of cervical tissue, in which the epithelial fluorescence at UV excitation originates partially from the cytoplasm of metabolically active cells, and the main fluorophore responsible for this signal was shown to be NADH (19, 29). In normal, nondysplastic tongue and floor of the mouth tissue, the presence of inflammation within the lamina propria is characterized by a significant decrease in fluorescence from the lower epithelial layers upon UV excitation. Several investigators have suggested that in benign lesions such as lichen planus, the large influx of inflammatory cells under the basement membrane triggers apoptosis and changes the proliferation rate of epithelial cells, which would also affect the autofluorescence of these cells (31, 32). In contrast, epithelial dysplasia in the tongue exhibited a small increase in epithelial fluorescence at UV excitation. A similar pattern was previously observed in dysplastic cervical tissue and was attributed to increased cellular metabolism (21).
In normal oral tissue, stromal fluorescence originates from structural fibers such as collagen. Indeed, collagen crosslinks are believed to be the dominant fluorophores in normal stroma and the optical signatures of these crosslinks are quite different from that of epithelial NADH and FAD (29). With the appearance of inflammation, a large loss of stromal fluorescence was noticed, especially in areas close to the basement membrane. This trend was observed in inflammatory tissue, regardless of anatomic site and the degree of inflammation correlates well with the extent of the fluorescence loss. We speculate that the reduction in stromal fluorescence in the presence of chronic inflammation was linked to the displacement of structural fibers by the infiltrating lymphocytes which are much less fluorescent, and also promote the expression of matrix-degrading proteases leading to the breakdown of collagen crosslinks (27). A study of the distribution of collagen fibers in human gingiva found that collagen types I and III are lost in stromal tissue with progression of inflammation (33). In vivo multiphoton microscopy images of hamster cheek pouch tissue showed that the number and length of collagen fibers was greatly diminished with increasing severity of inflammation (34).
Our results showed a marked loss of stromal fluorescence in dysplastic lesions similar to that observed in normal mucosa with mild to moderate inflammation. Because most of the dysplastic samples in this study also had mild to moderate inflammatory infiltrate in the lamina propria, the reduction of stromal fluorescence is most likely due to the presence of chronic inflammatory cells. Gannot et al. also documented increasing levels of subepithelial inflammatory infiltrate (sometimes referred to as lichenoid inflammation) in oral tissue during progression from normal to dysplasia to carcinoma (35). A second investigation found that stromal T cells increased by roughly a factor of 2 in mild dysplasias, and by ∼5-fold in moderate and severe dysplasia compared with normal oral tissue (36).
In vivo fluorescence spectroscopy and imaging evaluations consistently find that oral lesions display a loss of fluorescence intensity when compared with normal oral tissue. Some investigators have extracted the intrinsic fluorescence spectra from in vivo fluorescence spectra in the cervix (37) and the oral cavity (15) with a mathematical model. They have found that in the cervix and the oral cavity, the intrinsic fluorescence spectra could be composed of two spectra components, NADH and collagen, and that the NADH contribution increases whereas the collagen contribution decreases as lesions become more malignant. In both the cervix and oral cavity, the decrease in collagen contribution was larger then the increase in NADH contribution. These results are in agreement with the autofluorescence patterns from normal and dysplastic oral tongue tissue summarized in this study. Moreover, the loss of fluorescence intensity in oral lesions, as observed in both autofluorescence spectra and images, can be explained mostly by changes in stromal optical and morphologic properties. Lane et al. attribute the loss of autofluorescence signal in images of oral precancerous and cancerous lesions primarily to the breakdown of the collagen matrix and increased hemoglobin absorption and secondarily to epithelial factors, such as increased epithelial scattering and thickness (6). Previously, Drezek et al. have shown with Monte Carlo simulations of fluorescence spectra that most of the in vivo fluorescence signal in cervical tissue (∼80% in normal cervix tissue and 70% in dysplastic tissue) originates from the stroma. She concludes that the decreased fluorescence in dysplastic cervical tissue is due more to the reduction of stromal collagen fluorescence than changes in the contribution from epithelial NADH fluorescence (38).
Here, we show that both inflammatory and dysplastic oral tongue tissue display a large decrease in stromal fluorescence, especially in the superficial stroma, but have very different fluorescence patterns in the epithelium. Imaging such lesions with optical devices or probes that measure mostly stromal fluorescence may result in similar findings of loss of fluorescence intensity and thus fail to distinguish benign inflammation from dysplasia. Our results suggest that a possible way to distinguish benign inflammation from dysplastic lesions is to probe differences in epithelial fluorescence in addition to stromal fluorescence. Moreover, whereas stromal fluorescence decreases with malignant progression at both UV and 488 nm excitations, significant differences in epithelial fluorescence are observed only at UV excitation. Thus, the diagnostic ability of fluorescence imaging and spectroscopy for differentiating benign inflammations from dysplastic lesions could be improved by using excitation wavelengths in the UV range. Recently, it was shown that a simple imaging device could be used as an aid to successfully detect and identify high-risk preinvasive lesions with excitation wavelengths in the 400 to 460 nm range (6). Although the success of this device is quite exciting, our results suggest that the accuracy of such imaging devices in distinguishing different types of oral lesions, such as benign inflammation and dysplasia, might be enhanced by using UV excitation in addition to higher excitation wavelengths.
Bright autofluorescence was noted from the superficial, keratinized epithelial layer, which is often present in normal oral tissue from specific anatomic sites such as the palate and the gingiva, as well as in clinically apparent leukoplakia. This superficial layer is composed of keratinized cells that have different scattering (23) and fluorescence signatures (39) than the rest of the epithelium. The presence of a thick, keratinized superficial layer could influence both the intensity and emission peak of in vivo fluorescence spectra. Muller et al. reported that fluorescence spectra from keratinized oral mucosa exhibit a shift to the red and a lower intensity compared with nonkeratinized tissue. They explained these differences by a reduction of the depth of penetration of light excitation due to scattering from the keratin layer, which results in an increased NADH and decreased collagen contribution to the measured spectra. Thus, in order to classify dysplastic tissue from cancers with good accuracy, they advocated that nonkeratinized and keratinized mucosa should be divided into different groups (15). Our results support this view, and also suggest that this subdivision would be important for distinguishing nondysplastic from dysplastic oral mucosa.
The results here suggest that the diagnostic potential of fluorescence spectroscopy and imaging can be improved by designing optical probes or devices that can selectively measure signals from either the epithelium or the stroma. Excitation wavelengths in the UV range may also improve the accurate diagnosis of different types of oral lesions.
Acknowledgments
Grant support: NIH grant R01CA095604.
Footnotes
References
- 1.Parkin DM, Bray F, Ferlay J, Pisani P. Global cancer statistics, 2002. CA Cancer J Clin. 2005;55:74–108. doi: 10.3322/canjclin.55.2.74. [DOI] [PubMed] [Google Scholar]
- 2.American Cancer Society. Cancer facts and figures 2006. Atlanta: American Cancer Society; 2006. [Google Scholar]
- 3.Betz CS, Mehlmann M, Rick K, et al. Autofluorescence imaging and spectroscopy of normal and malignant mucosa in patients with head and neck cancer. Lasers Surg Med. 1999;25:323–34. doi: 10.1002/(sici)1096-9101(1999)25:4<323::aid-lsm7>3.0.co;2-p. [DOI] [PubMed] [Google Scholar]
- 4.Paczona R, Temam S, Janot F, Marandas P, Luboinski B. Autofluorescence videoendoscopy for photodiagnosis of head and neck squamous cell carcinoma. Eur Arch Otorhinolaryngol. 2003;260:544–8. doi: 10.1007/s00405-003-0635-6. [DOI] [PubMed] [Google Scholar]
- 5.Kulapaditharom B, Boonkitticharoen V. Performance characteristics of fluorescence endoscope in detection of head and neck cancers. Ann Otol Rhinol Laryngol. 2001;110:45–52. doi: 10.1177/000348940111000109. [DOI] [PubMed] [Google Scholar]
- 6.Lane PM, Gilhuly T, Whitehead P, et al. Simple device for the direct visualization of oral-cavity tissue fluorescence. J Biomed Opt. 2006;11:024006-1–7. doi: 10.1117/1.2193157. [DOI] [PubMed] [Google Scholar]
- 7.Ramanujam N, Mitchell MF, Mahadevan A, et al. Spectroscopic diagnosis of cervical intraepithelial neoplasia CIN in vivo using laser-induced fluorescence spectra at multiple excitation wavelengths. Lasers Surg Med. 1996;19:63–74. doi: 10.1002/(SICI)1096-9101(1996)19:1<63::AID-LSM8>3.0.CO;2-O. [DOI] [PubMed] [Google Scholar]
- 8.Palmer GM, Zhu C, Breslin TM, Xu F, Gilchrist KW, Ramanujam N. Comparison of multi-excitation fluorescence and diffuse reflectance spectroscopy for the diagnosis of breast cancer. IEEE Trans Biomed Eng. 2003;50:1233–42. doi: 10.1109/TBME.2003.818488. [DOI] [PubMed] [Google Scholar]
- 9.Nordstrum RJ, Burke L, Niloff JM, Myrtle JF. Identification of cervical intraepithelial neoplasia (CIN) using UV-excited fluorescence and diffuse-reflectance tissue spectroscopy. Lasers Surg Med. 2001;29:118–27. doi: 10.1002/lsm.1097. [DOI] [PubMed] [Google Scholar]
- 10.Chang SK, Follen M, Malpica A, et al. Optimal excitation wavelengths for discrimination of cervical neoplasia. IEEE Trans Biomed Eng. 2002;49:1102–11. doi: 10.1109/TBME.2002.803597. [DOI] [PubMed] [Google Scholar]
- 11.Georgakoudi I, Sheets EE, Müller MG, et al. Trimodal spectroscopy for the detection and characterization of cervical precancers in vivo. Am J Obstet Gynecol. 2002;186:374–82. doi: 10.1067/mob.2002.121075. [DOI] [PubMed] [Google Scholar]
- 12.Georgakoudi I, Jacobson BC, Van Dam J, et al. Fluorescence, reflectance, and light-scattering spectroscopy for evaluating dysplasia in patients with Barrett's esophagus. Gastroenterology. 2001;120:1620–9. doi: 10.1053/gast.2001.24842. [DOI] [PubMed] [Google Scholar]
- 13.Gillenwater A, Jacob R, Ganeshappa R, et al. Noninvasive diagnosis of oral neoplasia based on fluorescence spectroscopy and native tissue autofluorescence. Arch Otolaryngol Head Neck Surg. 1998;124:1251–8. doi: 10.1001/archotol.124.11.1251. [DOI] [PubMed] [Google Scholar]
- 14.Heintzelman DL, Utzinger U, Fuchs H, et al. Optimal excitation wavelengths for in vivo detection of oral neoplasia using fluorescence spectroscopy. Photochem Photobiol. 2000;72:103–13. doi: 10.1562/0031-8655(2000)072<0103:OEWFIV>2.0.CO;2. [DOI] [PubMed] [Google Scholar]
- 15.Muller MG, Valdez TA, Georgakoudi I, et al. Spectroscopic detection and evaluation of morphologic and biochemical changes in early human oral carcinoma. Cancer. 2003;97:1681–92. doi: 10.1002/cncr.11255. [DOI] [PubMed] [Google Scholar]
- 16.De Veld DC, Skurichina M, Witjes MJ, Duin RP, Sterenborg HJ, Roodenburg JL. Autofluorescence and diffuse reflectance spectroscopy for oral oncology. Lasers Surg Med. 2005;36:356–4. doi: 10.1002/lsm.20122. [DOI] [PubMed] [Google Scholar]
- 17.Wang CY, Tsai T, Chen HM, Chen CT, Chiang CP. PLS-ANN based classification model for oral submucous fibrosis and oral carcinogenesis. Lasers Surg Med. 2003;32:318–26. doi: 10.1002/lsm.10153. [DOI] [PubMed] [Google Scholar]
- 18.De Veld DC, Skurichina M, Witjes MJ, Duin RP, Sterenborg HJ, Roodenburg JL. Clinical study for classification of benign, dysplastic and malignant oral lesions using autofluorescence spectroscopy. J Biomed Opt. 2004;9:940–50. doi: 10.1117/1.1782611. [DOI] [PubMed] [Google Scholar]
- 19.Pavlova I, Sokolov K, Drezek R, et al. Microanatomical and biochemical origins of normal and precancerous cervical autofluorescence using laser-scanning fluorescence confocal microscopy. Photochem Photobiol. 2003;77:550–5. doi: 10.1562/0031-8655(2003)077<0550:maboon>2.0.co;2. [DOI] [PubMed] [Google Scholar]
- 20.Chance B, Thorell B. Localization and kinetics of reduced pyridine nucleotide in living cells by microfluorometry. Biol Chem. 1959;234:3044–50. [PubMed] [Google Scholar]
- 21.Drezek R, Brookner C, Pavlova I, et al. Autofluorescence microscopy of fresh cervical tissue sections reveals alterations in tissue biochemistry with dysplasia. Photochem Photobiol. 2001;73:636–41. doi: 10.1562/0031-8655(2001)073<0636:AMOFCT>2.0.CO;2. [DOI] [PubMed] [Google Scholar]
- 22.Collier T, Arifler D, Malpica A, Follen M, Richards-Kortum R. Determination of epithelial tissue scattering coefficient using confocal microscopy. IEEE J Sel Top Quantum Electron. 2003;9:307–13. [Google Scholar]
- 23.Clark AL, Gillenwater A, Alizadeh-Naderi R, El-Naggar AK, Richards-Kortum R. Detection and diagnosis of oral neoplasia with an optical coherence microscope. J Biomed Opt. 2004;9:1271–80. doi: 10.1117/1.1805558. [DOI] [PMC free article] [PubMed] [Google Scholar]
- 24.Bhowmick NA, Moses HL. Tumor-stroma interactions. Curr Opin Genet Dev. 2005;15:97–101. doi: 10.1016/j.gde.2004.12.003. [DOI] [PMC free article] [PubMed] [Google Scholar]
- 25.Zigrino P, Löffek S, Mauch C. Tumor-stroma interactions: their role in the control of tumor cell invasion. Biochimie. 2005;87:321–8. doi: 10.1016/j.biochi.2004.10.025. [DOI] [PubMed] [Google Scholar]
- 26.Hong WK, Sporn MB. Recent advances in chemoprevention of cancer. Science. 1997;278:1073–7. doi: 10.1126/science.278.5340.1073. [DOI] [PubMed] [Google Scholar]
- 27.Mignogna MD, Fedele S, Lo Russo L, Lo Muzio L, Bucci E. Immune activation and chronic inflammation as the cause of malignancy in oral lichen planus: is there any evidence? Oral Oncol. 2004;40:120–30. doi: 10.1016/j.oraloncology.2003.08.001. [DOI] [PubMed] [Google Scholar]
- 28.Ingber DE. Cancer as a disease of epithelial-mesenchymal interactions and extracellular matrix regulation. Differentiation. 2002;70:547–60. doi: 10.1046/j.1432-0436.2002.700908.x. [DOI] [PubMed] [Google Scholar]
- 29.Sokolov K, Galvan J, Myakov A, Lacy A, Lotan R, Richards-Kortum R. Realistic three-dimensional epithelial tissue phantoms for biomedical optics. J Biomed Opt. 2002;7:148–56. doi: 10.1117/1.1427052. [DOI] [PubMed] [Google Scholar]
- 30.Arifler D, Pavlova I, Gillenwater A, Richards-Kortum R. Light scattering from collagen fiber networks: micro-optical properties of normal and neoplastic stroma. Biophys J. 2007;92:3260–74. doi: 10.1529/biophysj.106.089839. [DOI] [PMC free article] [PubMed] [Google Scholar]
- 31.Sugerman PB, Savage NW, Walsh LJ, et al. The pathogenesis of oral lichen planus. Crit Rev Oral Biol Med. 2002;13:350–65. doi: 10.1177/154411130201300405. [DOI] [PubMed] [Google Scholar]
- 32.Montebugnoli L, Farnedi A, Marchetti C, Magrini E, Pession A, Foschini MP. High proliferative activity and chromosomal instability in oral lichen planus. Int J Oral Maxillofac Surg. 2006;35:1140–4. doi: 10.1016/j.ijom.2006.07.018. [DOI] [PubMed] [Google Scholar]
- 33.Narayanan AS, Clagett JA, Page RC. Effect on Inflammation on the distribution of collagen types I, III, IV, V, type I. Trimer and fibronectin in human gingivae. J Dent Res. 1985;64:1111–6. [Google Scholar]
- 34.Wilder-Smith P, Osann K, Hanna N, et al. In vivo multiphoton fluorescence imaging: a novel approach to oral malignancy. Lasers Surg Med. 2004;35:96–103. doi: 10.1002/lsm.20079. [DOI] [PubMed] [Google Scholar]
- 35.Gannot G, Gannot I, Vered H, Buchner A, Keisari Y. Increase in immune cell infiltration with progression of oral epithelium from hyperkeratosis to dysplasia and carcinoma. Br J Cancer. 2002;86:1444–8. doi: 10.1038/sj.bjc.6600282. [DOI] [PMC free article] [PubMed] [Google Scholar]
- 36.Syafriadi M, Cheng J, Jen KY, Ida-Yonemochi H, Suzuki M, Saku T. Two-phase appearance of oral epithelial dysplasia resulting from focal proliferation of parabasal cells and apoptosis of prickle cells. J Oral Pathol Med. 2005;34:140–9. doi: 10.1111/j.1600-0714.2004.00283.x. [DOI] [PubMed] [Google Scholar]
- 37.Georgakoudi I, Jacobson BC, Muller MG, et al. NADH and collagen as in vivo quantitative fluorescent biomarkers of epithelial precancerous changes. Cancer Res. 2002;62:682–7. [PubMed] [Google Scholar]
- 38.Drezek R, Sokolov K, Utzinger U, et al. Understanding the contributions of NADH and collagen to cervical tissue fluorescence spectra: modeling, measurements, and implications. J Biomed Opt. 2001;6:385–96. doi: 10.1117/1.1413209. [DOI] [PubMed] [Google Scholar]
- 39.Wu Y, Qu JY. Combined depth- and time-resolved autofluorescence spectroscopy of epithelial tissue. Opt Lett. 2006;31:1833–5. doi: 10.1364/ol.31.001833. [DOI] [PubMed] [Google Scholar]