

Abstract
Inhibitory local interneurons (LNs) play a critical role in shaping the output of olfactory glomeruli in both the olfactory bulb of vertebrates and the antennal lobe of insects and other invertebrates. In order to examine how the complex geometry of LNs may affect signaling in the antennal lobe, we constructed detailed multi-compartmental models of single LNs from the sphinx moth, Manduca sexta, using morphometric data from confocal-microscopic images. Simulations clearly revealed a directionality in LNs that impeded the propagation of injected currents from the sub-micron-diameter glomerular dendrites toward the much larger-diameter integrating segment (IS) in the coarse neuropil. Furthermore, the addition of randomly-firing synapses distributed across the LN dendrites (simulating the noisy baseline activity of afferent input recorded from LNs in the odor-free state) led to a significant depolarization of the LN. Thus the background activity typically recorded from LNs in vivo could influence synaptic integration and spike transformation in LNs through voltage-dependent mechanisms. Other model manipulations showed that active currents inserted into the IS can help synchronize the activation of inhibitory synapses in glomeruli across the antennal lobe. These data, therefore, support experimental findings suggesting that spiking inhibitory LNs can operate as multifunctional units under different ambient odor conditions. At low odor intensities, (i.e. subthreshold for IS spiking), they participate in local, mostly intra-glomerular processing. When activated by elevated odor concentrations, however, the same neurons will fire overshooting action potentials, resulting in the spread of inhibition more globally across the antennal lobe. Modulation of the passive and active properties of LNs may, therefore, be a deciding factor in defining the multi-glomerular representations of odors in the brain.
Keywords: Glomeruli, Olfaction, Odor processing, Modulation, Synaptic integration
1. Introduction
Olfactory glomeruli, the dense knots of synaptic neuropil that characterize early olfactory centers in diverse organisms, are believed to play a key role in the recognition and discrimination of odors (Schild and Riedel, 1992; Hildebrand and Shepherd, 1997; Christensen and White, 2000), but the details of their involvement is unclear. Little is known, for example, about the cellular and synaptic mechanisms underlying inter-glomerular communication and how these interactions help create a unique neural representation of each olfactory stimulus in the brain. Insect glomeruli are interconnected by a diverse network of multi-branched, GABAergic local interneurons (LNs; Fig. 1A) (Christensen et al., 1993; Leitch and Laurent, 1996). Unlike the periglomerular and granule cells in the olfactory bulb of mammals and other vertebrates (Shipley and Ennis, 1996), insect LNs branch profusely, and many extend processes into every glomerulus in the first-order processing center, the antennal lobe (Fig. 1B). Networks of LNs provide the major source of inhibitory input to projection neurons (PNs), and these connections are thought to serve a major function in shaping the multiglomerular patterns of activity evoked by olfactory stimuli (review: Christensen and White, 2000). Their characteristic wide-field organization suggests that LNs may function by distributing their inhibitory influence throughout the antennal lobe, thus globally modulating the output of the entire glomerular array (Fig. 1A, B). At present, however, there is no experimental evidence to support this general function.
Fig. 1.

Morphology and physiology of LNs in the moth antennal lobe. (A) Confocal microscopic reconstruction of a single multiglomerular LN (negative image), stained intracellularly with Lucifer Yellow. This projection of 15 optical sections (each 2 μm thick) illustrates the extensive stellate branching pattern of this neuron throughout the antennal lobe glomeruli in a male moth. (B) Diagram of the moth head, showing the position of the brain and the paired antennal lobes (AL). AL on the right illustrates the glomerular neuropil; that on the left shows the position of a single LN. Also shown are the optic lobes (OL), protocerebrum (PR), and subesophageal ganglion (SEG). (C) Intracellular record from the LN in A showing the complex response to antennal stimulation with the female sex pheromone (time course shown in bottom trace). Among the distinguishing features of LN responses are the multiple waveforms of more than one amplitude (see text).
Intracellular recordings from identified LNs in moths revealed that even in the absence of odor, LNs exhibit a steady level of background activity resulting from the convergence of axons from many olfactory receptor neurons (Christensen et al., 1993). When stimulated with odor, LNs respond with both graded synaptic potentials and action potentials (Fig. 1C). Furthermore, action potentials of more than one amplitude have been observed in many LNs (Matsumoto and Hildebrand, 1981; Christensen et al., 1993), suggesting the possible existence of active dendritic properties and dendritic spikes intermingled with larger overshooting spikes generated in the IS more proximally to the soma (Shen et al., 1999) (Fig. 1C). Thus it is possible that LNs participate in both local interactions with neurons in the same glomerulus that receives the sensory input, as well as more global interactions with neurons in neighboring glomeruli in the antennal lobe. In order to begin to address these issues, we examined the passive electrical properties of LNs using multi-compartmental models based on morphometric and electrophysiological data from identified LNs in the antennal lobe of the moth Manduca sexta.
2. Materials and methods
2.1. Preparation for LN staining
Manduca sexta (Lepidoptera: Sphingidae) were reared on artificial diet under a long-day photoperiod (17-h light:7-h dark). All animals were used within 3–5 days following adult emergence, and the experimental procedures to access the brain have been detailed previously (Christensen et al., 1998). Lucifer Yellow CH was used to stain impaled neurons via intracellular electrodes for subsequent confocal microscopy (King et al., 2000). Neurons were stained by passing hyperpolarizing direct current (1–2 nA) for 10 min. The brain was then dissected, fixed in 4% buffered paraformaldehyde, dehydrated in an ethanol series and finally cleared in methyl salicylate for viewing as a wholemount in the confocal microscope (BioRad MRC-600). In some cases, to obtain enhanced-resolution images for detailed morphometric analyses, brains were returned to 100% ethanol, embedded in Spurr’s resin (Electron Microscopy Sciences, Ft. Washington, PA), and sectioned at 48 μm. A series of images was then collected at 2 μm optical steps with the confocal microscope.
2.2. Single-neuron compartmental modeling
After staining and viewing, anatomically accurate compartmental representations of LNs (or multiglomerular segments of LNs) were constructed using NEURON (Hines and Carnevale, 1997). Numerical simulations were performed using a wide range of values for the passive electrical parameters (see below). Active zones using standard Hodgkin–Huxley parameter values were incorporated into the IS in some simulations.
Each neuron compartment was considered isopotential, and was represented as a cylinder of fixed diameter, axial resistance, membrane capacitance and membrane conductance. Changes in these parameters occurred between rather than within compartments. Kirchhoff’s current laws were used to describe conservation of charges in each compartment, leading to an equation of the following form for the electric potential Vj of compartment j:
| (1) |
where Cj is the membrane capacitance of compartment j, Ij(ion) is the sum of all currents exiting compartment j through ion channels, Ij(stimulus) corresponds to additional currents due, for example, to synaptic input, and gj,j+1 is the axial conductance between compartments j and j+1. Boundary conditions were ‘sealed-end’, meaning that no current flowed through the end of terminal dendrites. For the last compartment of each terminal branch of the modeled neuron, the right-hand-side of Eq. (1) above, therefore, contains only one term.
We used the first-order (backward Euler) temporal scheme of NEURON to integrate the dynamic equations for each compartment (Hines and Carnevale, 1997). Simulations were systematically checked by verifying that runs with smaller time steps and mesh sizes produced comparable results. A typical time step was t=0.01 ms for compartmental models in which the size of each compartment was at most one-tenth of the corresponding electrotonic length.
Custom programs were written using the hoc interpreter (Kernighan and Pike, 1984). Each program was intended to test a specific property of the LN under study. These programs were object-oriented and their design made it possible to use the same program on different sets of morphometric data by changing the name of the input data set.
The capacitance of a compartment of length lj and diameter dj is given by Cj=Cmπdjlj, where Cm is the membrane capacitance per unit area. A typical value for Cm is 1 μF cm−2, and this value was used here also. Conductances gj, j+1 are given by:
where Ra is the specific resistivity of the axoplasm. We investigated a large parameter range for Ra, which varied between 10 and 1000 Ω cm. Since the membrane conductance may also vary within a given neuron, and also depends on external parameters, we considered values of gpas ranging between 10−5 and 10−3 Ω−1 cm−2. Channel dynamics were described by an appropriate choice of Ij(ion). This study examines mainly passive membrane properties, which are represented by the equation Ij(ion)=gleak(Vj−Eleak), where gleak= πljdjgpas. Unless otherwise stated the channels were uniformly distributed across the dendritic tree.
2.3. Modeling synaptic input
Synaptic input corresponding to a nonzero Ij(stimulus) in Eq. (1) above, was modeled by:
| (2) |
where
| (3) |
for positive values of t−tf (otherwise gsyn=0). In other words, the synapse has a nonzero conductance for times t larger than tf, and reaches its maximum value (gmax) when t−tf=τ. For large values of t, the exponential term makes the conductance decay to zero. Such synapses are called ‘alpha’ synapses (Koch and Segev, 1998). We used two types of alpha synapses, distinguished by their temporal patterning and conductances:
‘random’ alpha synapses were used to simulate the background level of input to the olfactory glomeruli in the resting state. These synapses fired at random: that is, tf was set to a new randomly-selected value each time the synapse fired. In our simulations, the values of tf followed a Poisson distribution with a mean set by the user. These synapses had relatively small gmax (generally on the order of 10−4 μS) and τ (typically 0.1 ms). The placement of these synapses along a dendritic branch followed a uniform, random distribution; and
‘synchronized’ alpha synapses simulated brief periods of synchronous olfactory input that typically occur in the presence of a natural, intermittent odor stimulus (Vickers et al., 2001). For these synapses we used larger values of gmax (typically 3×10⁻³ μS) and τ (0.5 ms) in order to more accurately simulate the elevated currents associated with olfactory input. Synchronized alpha synapses were connected to a spike generator that created brief trains of spikes in order to simulate discrete odor pulses. The time between spikes within a given train, as well as the average separation between consecutive trains, was random and followed a Poisson distribution.
2.4. Attenograms
Attenograms are spatial representations of a modeled neuron that reflect the passive electrical properties of the cell (Carnevale et al., 1997). In an attenogram, distances are scaled so that one distance unit between two points corresponds to an attenuation of the respective membrane potential by a factor of 1/e. We used the NEURON impedance/shape tool to plot attenograms. They were constructed by applying a current clamp at one reference point in the cell, and computing the induced membrane potential at each of the end points of the branched dendritic tree. The length of each branch was then replaced by the logarithm of the ratio of the values of the potentials at the two end points of the branch. Since the attenogram depends on the direction of current propagation in the tree, we typically produced two types of attenograms: one for current propagating from the IS towards the distal dendrites; the other for current propagating from a distal dendrite towards the IS. Such diagrams are extremely useful to analyze the role of local changes in the membrane parameters on the transmission of information between two points in the neuron.
3. Results
In order to simulate a depolarizing potential propagating from glomeruli on one side of the antennal lobe to glomeruli on the other, we applied a voltage clamp in the IS at a point in the coarse, non-synaptic neuropil region of the LN (clamp C in Fig. 2B). The traces in Fig. 2C show that the membrane voltage at different points in the dendritic tree follows a similar time course, and this is confirmed by the compact attenogram to the left of the traces. As expected, attenograms revealed that electrotonic potentials are propagated with little attenuation into the main trunk feeding the target glomerulus (point 2 in Fig. 2B), and they furthermore can survive into the finer dendritic branches of the glomerulus (point 4), where previous evidence shows that some output synapses are located (Malun, 1991). In contrast, if a simulated synaptic input to the glomerulus originated at a distal dendrite (clamp D in Fig. 2B), it was clear that the evoked potential traveling orthodromically would be greatly attenuated (Fig. 2D) before it reached the main process innervating the input glomerulus (point 3). It would be significantly more attenuated before it reached the larger trunk (point 2) that splits to feed both the input glomerulus (b) as well as its neighbor (c). This result is illustrated by both the greatly elongated attenogram and the attenuated voltage traces in Fig. 2D (note different distance and time scales compared with Fig. 2C). Detailed models depicting the complete dendritic trees of different LNs yielded similar results (Fig. 3). That is, input signals generated at distal dendrites have a higher likelihood of influencing intra-glomerular than inter-glomerular activity, even if the communication is between neighboring glomeruli.
Fig. 2.

Detailed morphology of a wide-field, spiking LN in the antennal lobe, and analysis of computer simulations derived from these geometric data. (A) Laser-scanning confocal view (negative image) of a section through a segment of a dye-filled LN that was selected for computer simulation. A single trunk gives rise to three major dendritic branches, each innervating different glomeruli. (B) Reconstruction of the segment from three consecutive sections, illustrating the major dendritic branches that were used in the simulations, along with the glomeruli that these branches innervate (a–e). Two points on the tree where a current or voltage clamp was applied (clamps C and D), and four points where voltages were calculated (1–4) are indicated. (C, D) Numerical attenograms for the LN and corresponding voltage traces. Results from applying a current or voltage clamp at the IS are shown in C; results from clamping at the tip of a dendrite are shown in D. In both C and D, the left panel shows the attenogram (obtained by applying a current clamp), the right panel shows the time course of the change in membrane voltage at the four recording sites indicated in B when a voltage clamp is applied. The dimensions of the attenograms are scaled so that a distance of one unit between two points corresponds to an attenuation of the respective membrane potential by a factor of 1/e. The dashed line in each attenogram represents the dendrite to which a current clamp was applied, and the direction of current flow is indicated by an arrow. The differences between the voltage traces on the right illustrate the magnitude of the attenuation at four locations across the dendritic tree. The passive parameters for the equivalent cable were as follows: Ra=50 Ω cm, gpas=10−4 Ω−1cm−2, Eleak=epas=−65 mV.
Fig. 3.

Reconstruction and attenograms calculated from the LN shown in Fig. 1. (Box) Neuron reconstruction from confocal sections. Starting with the soma at A, and working counter-clockwise, the current clamp was applied at multiple sites, labeled B–F. The attenograms obtained from these simulations are arranged around the reconstruction. The dashed line in each attenogram represents the dendrite to which the clamp was applied.
We next examined how changing the local conductance of a single segment of the modeled LN would affect the shape of the attenograms. As expected, irrespective of the direction of current flow, a decrease in the membrane conductance gpas led to a progressive collapse of the attenogram, and a more electrically compact dendritic tree. The model nevertheless maintained a significant degree of bidirectionality which depended on the direction of current flow (Fig. 4).
Fig. 4.

Influence of local changes in the membrane conductance, gpas, on attenograms from the model in Fig. 2. (A, B) Effects of changing the passive conductance of one segment of the dendritic tree (dashed line). Attenograms in A were generated with a current clamp at the IS; those in B with the clamp at the tip of a distal dendrite (as shown in Fig. 2B). The passive parameters for the equivalent cable were the same as in Fig. 2 for all dendrites except for the segment indicated by the dashed line: gpas (in Ω−1 cm−2)=10−3 for the left panels, 10−4 for the middle panels, and 10−5 for the right panels. Note the difference in scales in A and B. The segment in which electrotonic length was affected by the change in membrane conductance is represented by a thick line. Note that there is little difference between the middle and right panels because as gpas becomes smaller, the axial resistance (Ra=50 Ω cm) becomes the dominant factor in determining the electrotonic length of the dendrite.
LNs are often spontaneously active, but the observed patterns of activity are different for different neurons (Christensen et al., 1993). Some LNs display mainly small-amplitude spikes, while in others, large-amplitude overshooting spikes are predominant. In most LNs, however, both large and small amplitude spikes are typically observed in the same recording (e.g. Fig. 1C), and the appearance of one spike type is independent of the other (Christensen et al., 1993). Therefore, many LNs, even in the absence of an olfactory stimulus, receive a steady but semi-random barrage of synaptic activity from other neurons, including, but not necessarily limited to, the spontaneously active antennal receptor neurons (Shields and Hildebrand, 2001). We wanted to examine what influence this ongoing spontaneous input might have on the functional properties of LNs. To study this question, we constructed LN models that incorporated groups of randomly firing alpha synapses distributed over the surface of each distal dendrite to simulate synaptic inputs to the LN (see Section 2). The addition of this background synaptic activity had a dramatic effect on the LN, leading to a significant membrane depolarization of almost 10 mV from rest (Fig. 5A). As expected from our earlier results, the random fluctuations in membrane potential were better preserved in the dendritic regions than in the IS (compare dashed and solid curves in Fig. 5A). Note also that for the values of the passive parameters used in Fig. 5A, there is little difference between the resting potential at the distal dendrites and at the IS. However, as shown in Fig. 6, which explores a wider range of passive parameter values, we verified that at higher values of Ra and gpas, the LN resting potential was non-uniform, with the IS at a potential significantly closer to the resting potential than that of the dendrites.
Fig. 5.

Effect of distal synaptic noise on the LN resting potential calculated at different points in a dendritic tree. (A) Random noise. Voltage plot showing the membrane potential recorded at the base of the main trunk (clamp C in Fig. 2B), and at a distal dendrite (clamp D in Fig. 2B). Noise (modeled by random synaptic input to all distal dendrites) is switched on at time t=10 ms, leading to a significant membrane depolarization to approximately −57 mV. In this and all subsequent records, the solid curve shows the response recorded at the base of the main trunk, while the dotted curve shows the response at the distal dendrite. Note that the random fluctuations in synaptic currents are much better preserved at the level of the dendrites. Ra=50 Ω cm, gpas>=10−4 Ω−1 cm−2, Eleak=epas=−65 mV. Ten randomly-firing and independent alpha synapses, with gmax=10−4 μS and τ=0.1 ms, were placed at random into each terminal branch of each dendrite. The firing interval for each synapse was determined using a Poisson distribution of mean equal to 5 ms. (B) Coordinated synaptic input. To model more accurately the effects of a natural olfactory stimulus, each of the distal dendrites in a glomerulus received bursting synaptic input from a spike generator that simulated input from odor receptor neurons. Note the attenuation and filtering of EPSPs recorded at the main trunk. The synchronized synapses linked to the spike generator used the parameters gmax=3×10⁻³ μS and τ=0.5 ms. (C) Addition of active currents. This model is similar to that in B, but the spike generator produces bursts which contain an average of 20 spikes (Poisson distribution) separated by 2 ms, and the gap between consecutive bursts is wider. Moreover, active Hodgkin–Huxley channels are inserted in the IS of the dendritic tree. In this configuration, bursts of EPSPs generated at the dendrites can summate and trigger action potentials in the IS. The default Hodgkin–Huxley parameter values used for this simulation are gK=0.036 Ω−1 cm−2, gNa=0.12 Ω−1 cm−2, gleak=3×10⁻⁴ Ω−1 cm−2, and eleak=−54 mV. (D) Detail of the outlined area in C.
Fig. 6.
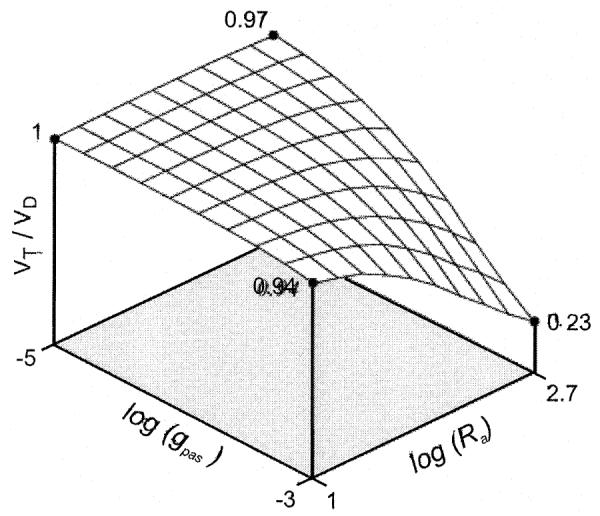
The average resting potential recorded at the main trunk of an LN tree, in the presence of background synaptic input, as a function of changes in passive membrane parameters. This plot shows the ratio VT/VD as a function of the logarithm of Ra and gpas. Here, VT is the time average of the resting potential recorded at the base of the main trunk, and VD is the time average of the potential recorded at a distal dendrite. Both potentials are measured with respect to the resting potential (eleak=−65 mV). Ten noisy alpha synapses were inserted into each distal dendrite (gmax=2×10⁻⁴ μS; τ=0.1 ms; average firing interval τ=10 ms). When Ra is small (10 Ω cm) or when gpas is small (10−5 Ω−1 cm−2), VT=VD, but for larger values of gpas and Ra, the signal due to random synaptic input is greatly attenuated when it reaches the main trunk of the dendritic tree and, therefore, VT is significantly smaller than VD.
Another model examined LN responses to olfactory input by adding alpha synapses linked to a spike generator to the simulation. The spike generator produced coordinated and sporadic bursts (Fig. 5B), thereby mimicking naturally intermittent odor input (Vickers et al., 2001). As shown in Fig. 2 earlier, we again found that EPSPs generated in the LN dendrites are significantly filtered and attenuated by the time they reach the IS. However, when active Hodgkin–Huxley membrane dynamics were added to a segment of the IS, it was clear that dendritic EPSPs could nevertheless summate and trigger action potentials that then could spread to other parts of the LN, potentially leading to GABA release in many glomeruli across the antennal lobe (Figs. 5C and 7).
Fig. 7.
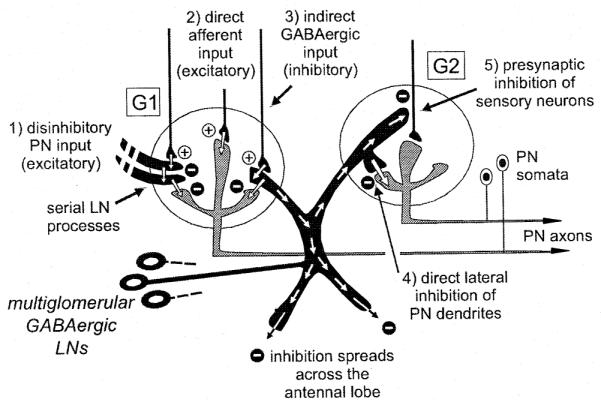
Summary diagram of the multiglomerular olfactory network underlying odor discrimination in the antennal lobe of Manduca sexta (only two of the approximately 65 glomeruli are shown). All connections in the circuit are based on synaptic relationships that are based on electron microscopic or electrophysiological data. The specific population of sensory neurons converging on glomerulus G1 passes information to projection neurons (PNs) in the same glomerulus through one of several synaptic pathways. From left to right, these are: (1) excitation through disinhibition; (2) monosynaptic primary afferent input; (3) feedforward inhibition through GABAergic local interneurons (LNs). At each synapse, ‘+’=excitatory, and ‘−’=inhibitory input. Activation of G1 also affects the excitability of neighboring glomeruli (here depicted by G2) through several possible pathways involving multiglomerular LNs. From left to right: (4) lateral inhibition of PN dendrites; (5) presynaptic inhibition of sensory neuron terminals. Computational simulations of LNs now suggest that they could participate locally (in mostly intra-glomerular processing) or more globally (widespread glomerular inhibition) depending on how strongly they are activated by an olfactory stimulus.
4. Discussion
Detailed compartmental models of LNs in the olfactory system of Manduca sexta are beginning to reveal important insights into the functional roles of inhibition in regulating glomerular activity at the earliest stage of odor-information processing in the brain. In the absence of anatomical data, while it is possible to make predictions about the attenuation of signals propagating through a dendrite, accurate morphometric data of the type we present here allows one to calculate the magnitude of this attenuation in the different segments of a complex branching neuron, like olfactory LNs. Our models of the passive properties of LNs revealed evidence for strong directionality in the patterns of current flow between different points in their multiply-branched dendritic trees. The shape and the scale of the two attenograms shown in Fig. 2 indicate that signals traveling through the LN from the IS toward the dendrites are much less attenuated than signals propagating from a distal dendrite toward the IS (Figs. 2C and 2D, respectively). This suggests that sensory input from the antennal axons to the LN dendrites may be largely confined to the target glomerulus, leading to local inhibitory modulation of PN excitability, rather than more global inter-glomerular effects.
When active properties are considered, however, it is obvious that the location of active membrane is a critical parameter that will determine whether a signal propagates or fails as it crosses from one side of the antennal lobe to the other. There is good evidence in both vertebrate and invertebrate olfactory systems that GABAergic inhibitory synapses play a role in lateral inter-glomerular interactions that serve to enhance the molecular contrast between odor messages represented in neighboring glomeruli (reviewed in Christensen and White, 2000). Our simulations provide additional insight into how these lateral interactions may occur. The attenograms in Figs. 2-4 revealed that a signal present at the level of the IS in the coarse neuropil will spread largely unattenuated throughout the LN; that is, the electrotonic size of the neuron as seen from the IS is very small. This result implies that if global interaction between all the glomeruli innervated by the LN is to occur, it is essential that a signal traveling from across the antennal lobe be able to invade the IS. While signals that reach the IS may propagate relatively freely throughout the LN, active membrane may also help to ensure, with the least attenuation, the synchronous activation of inhibitory output synapses in the most distant glomeruli across the AL.
A signal that arises in the small-diameter distal dendrites is attenuated after only a short distance, but the degree to which the signal is dampened is strongly dependent on the dimensions of the dendrite and the geometry of the glomerular tuft it belongs to. Thus, when olfactory input triggers activity in a particular glomerulus (e.g. glomerulus b in Fig. 2), those glomeruli that share connections with the active glomerulus through a common branch (glomerulus c in Fig. 2) are more likely to be influenced by such input. Of course, if the membrane conductance of a particular segment of the dendrite is made to increase, the effective electrotonic length of all segments proximal to the modified segment will be increased as well, thus further isolating the glomerulus from its neighbors (Fig. 4B). One possible candidate for the modulation of LN membrane conductance is the biogenic amine, serotonin. At low concentrations serotonin reduces, and at high concentrations, augments the excitability of LNs in M. sexta (Kloppenburg and Hildebrand, 1995).
Another important finding is that synaptic ‘noise’ plays an important role in the behavior of simulated LNs. The addition to the model of randomly-firing alpha synapses raised the LN resting potential, thus increasing excitability (Fig. 5A), and this mechanism could, therefore, be an effective means to regulate spike initiation in the LN dendrites. Evidence for presynaptic inhibition of olfactory receptor neurons has been found in a number of olfactory systems (Shipley and Ennis, 1996; Distler and Boeckh, 1997a, Distler and Boeckh, 1997b; Wachowiak and Ache, 1998), and thus one possible function of these connections could be to adjust the level of background activity (and consequently, resting potential) in LNs. In this way, laterally inhibitory LN processes in one glomerulus could reduce the excitability of a neighboring glomerulus by specifically targeting the terminals of its olfactory receptor neurons (Fig. 7).
As seen in Eq. (2), the amplitude of synaptic noise also changes as a function of the membrane potential. As the membrane potential approaches the reversal potential for the sporadically activated synapses, esyn,, the net current injected at these synapses will decrease. This implies that a strong input signal that raises the membrane potential close to esyn will effectively quench the noise. The fact that most LNs are spontaneously active (Christensen et al., 1993) may reflect an effective strategy for increasing the signal-to-noise ratio in the glomerulus: with increasing odor stimulation, the ratio will improve not only because the postsynaptic potentials in the LN have a larger amplitude, but also because the background noise level will be further suppressed.
Computer simulations of the olfactory system have called attention to the specific intrinsic and synaptic properties of glomerular networks that produce complex, patterned spiking output (Meredith, 1992; Bhalla and Bower, 1993; White et al., 1992, 1998; Getz and Lutz, 1999). Several recent computational models focusing on the moth antennal lobe have suggested how odor information may be processed in this neuropil, and these network simulations are in agreement with our published experimental findings (Av-Ron and Vibert, 1996; Linster et al., 1993, 1994). That is, such models can faithfully reproduce some of the physiological response patterns of antennal lobe neurons in Manduca (Christensen et al., 1993, 1998). These simulations, however, have not taken into account the complex geometry of these glomerular circuits, nor have they incorporated many details of the complex circuit connectivity found in this neuropil (Sun et al., 1995, 1997; Christensen et al., 1998, Fig. 7). The data we present here represent a first step toward further understanding the mechanisms underlying inter-glomerular communication by developing accurate single-neuron models of multiglomerular LNs. Future studies will examine network models based on our knowledge of the complex synaptic interactions among antennal neurons, LNs and PNs in the insect antennal lobe.
Acknowledgements
We are very grateful to Dr Ted Carnevale and Dr Al Scott for many helpful discussions and valuable advice, and to Jason Lashbrook and Brandon Williams for technical assistance. Supported in part by NIH/NIDCD grant DC02751 (JGH).
Abbreviations
- EPSP
excitatory postsynaptic potential
- IS
integrating segment
- LN
local interneuron
- PN
projection neuron
References
- Av-Ron E, Vibert J-F. A model for temporal and intensity coding in insect olfaction by a network of inhibitory neurons. Biosystems. 1996;39:241–250. doi: 10.1016/0303-2647(96)01620-6. [DOI] [PubMed] [Google Scholar]
- Bhalla US, Bower JM. Exploring parameter space in detailed single neuron models: simulations of the mitral and granule cells of the olfactory bulb. J. Neurophysiol. 1993;69:1948–1965. doi: 10.1152/jn.1993.69.6.1948. [DOI] [PubMed] [Google Scholar]
- Carnevale NT, Tsai KY, Claiborne BJ, Brown TH. Comparative electrotonic analysis of three classes of rat hippocampal neurons. J. Neurophysiol. 1997;78:703–720. doi: 10.1152/jn.1997.78.2.703. [DOI] [PubMed] [Google Scholar]
- Christensen TA, White J. Representation of olfactory information in the brain. In: Finger TE, Silver WL, Restrepo D, editors. The Neurobiology of Taste and Smell. vol. 2. Wiley; New York: 2000. pp. 201–232. [Google Scholar]
- Christensen TA, Waldrop BR, Harrow ID, Hildebrand JG. Local interneurons and information processing in the olfactory glomeruli of the moth Manduca sexta. J. Comp. Physiol. A. 1993;173:385–399. doi: 10.1007/BF00193512. [DOI] [PubMed] [Google Scholar]
- Christensen TA, Waldrop BR, Hildebrand JG. Multitasking in the olfactory system: context-dependent responses to odors reveal dual GABA-regulated coding mechanisms in single olfactory projecion neurons. J. Neurosci. 1998;18:5999–6008. doi: 10.1523/JNEUROSCI.18-15-05999.1998. [DOI] [PMC free article] [PubMed] [Google Scholar]
- Distler PG, Boeckh J. Synaptic connection between identified neuron types in the antennal lobe glomeruli of the cockroach, Periplaneta americana. I. Uniglomerular projection neurons. J. Comp. Neurol. 1997a;378:307–319. [PubMed] [Google Scholar]
- Distler PG, Boeckh J. Synaptic connection between identified neuron types in the antennal lobe glomeruli of the cockroach, Periplaneta americana. II. Local multiglomerular interneurons. J. Comp. Neurol. 1997b;383:529–540. doi: 10.1002/(sici)1096-9861(19970714)383:4<529::aid-cne9>3.0.co;2-4. [DOI] [PubMed] [Google Scholar]
- Getz WM, Lutz A. A neural network model of general olfactory coding in the insect antennal lobe. Chem. Senses. 1999;24:351–372. doi: 10.1093/chemse/24.4.351. [DOI] [PubMed] [Google Scholar]
- Hildebrand JG, Shepherd GM. Mechanisms of olfactory discrimination: converging evidence for common principles across phyla. Annu. Rev. Neurosci. 1997;20:595–631. doi: 10.1146/annurev.neuro.20.1.595. [DOI] [PubMed] [Google Scholar]
- Hines ML, Carnevale NT. The NEURON simulation environment. Neural Comput. 1997;9:1179–1209. doi: 10.1162/neco.1997.9.6.1179. [DOI] [PubMed] [Google Scholar]
- Kernighan BW, Pike R. The UNIX Programming Environment. Appendix 2: Hoc manual. Prentice Hall; Englewood Cliffs, NJ: 1984. pp. 329–333. [Google Scholar]
- King JR, Christensen TA, Hildebrand JG. Response characteristics of an identified, sexually dimorphic olfactory glomerulus. J. Neurosci. 2000;20:2391–2399. doi: 10.1523/JNEUROSCI.20-06-02391.2000. [DOI] [PMC free article] [PubMed] [Google Scholar]
- Kloppenburg P, Hildebrand JG. Neuromodulation by 5-hydroxytryptamine in the antennal lobe of the sphinx moth Manduca sexta. J. Exp. Biol. 1995;198:603–611. doi: 10.1242/jeb.198.3.603. [DOI] [PubMed] [Google Scholar]
- Koch C, Segev I. Methods in Neuronal Modeling: From Ions to Networks. M.I.T. Press; Cambridge, MA: 1998. [Google Scholar]
- Leitch B, Laurent G. GABAergic synapses in the antennal lobe and mushroom body of the locust olfactory system. J. Comp. Neurol. 1996;372:487–514. doi: 10.1002/(SICI)1096-9861(19960902)372:4<487::AID-CNE1>3.0.CO;2-0. [DOI] [PubMed] [Google Scholar]
- Linster C, Kerszberg M, Masson C. How neurons may compute: the case of insect sexual pheromone discrimination. J. Comput. Neurosci. 1994;1:231–238. doi: 10.1007/BF00961735. [DOI] [PubMed] [Google Scholar]
- Linster C, Masson C, Kerszberg M, Personnaz L, Dreyfus G. Computational diversity in a formal model of the insect macroglomerulus. Neural Comput. 1993;5:239–252. [Google Scholar]
- Malun D. Inventory and distribution of synapses of identified uniglomerular projection neurons in the antennal lobe of Periplaneta americana. J. Comp. Neurol. 1991;305:348–360. doi: 10.1002/cne.903050215. [DOI] [PubMed] [Google Scholar]
- Matsumoto SG, Hildebrand JG. Olfactory mechanisms in the moth Manduca sexta: response characteristics and morphology of central neurons in the antennal lobes. Proc. R. Soc. London B. 1981;213:249–277. [Google Scholar]
- Meredith M. Neural circuit computation: Complex patterns in the olfactory bulb. Brain Res. Bull. 1992;29:111–117. doi: 10.1016/0361-9230(92)90014-o. [DOI] [PubMed] [Google Scholar]
- Schild D, Riedel H. Significance of glomerular compartmentalization for olfactory coding. Biophys. J. 1992;61:704–715. doi: 10.1016/S0006-3495(92)81875-1. [DOI] [PMC free article] [PubMed] [Google Scholar]
- Shen GY, Chen WR, Midtgaard J, Shepherd GM, Hines ML. Computational analysis of action potential initiation in mitral cell soma and dendrites based on dual patch recordings. J. Neurophysiol. 1999;82:3006–3020. doi: 10.1152/jn.1999.82.6.3006. [DOI] [PubMed] [Google Scholar]
- Shields VDC, Hildebrand JG. Responses of a population of antennal olfactory receptor cells in the female moth Manduca sexta to plant-associated volatile organic compounds. J. Comp. Physiol. A. 2001;186:1135–1151. doi: 10.1007/s003590000165. [DOI] [PubMed] [Google Scholar]
- Shipley MT, Ennis M. Functional organization of olfactory system. J. Neurobiol. 1996;30:123–176. doi: 10.1002/(SICI)1097-4695(199605)30:1<123::AID-NEU11>3.0.CO;2-N. [DOI] [PubMed] [Google Scholar]
- Sun XJ, Tolbert LP, Hildebrand JG. Using laser scanning confocal microscopy as a guide for electron microscopic study: a simple method for correlation of light and electron microscopy. J. Histochem. Cytochem. 1995;43:329–335. doi: 10.1177/43.3.7868862. [DOI] [PubMed] [Google Scholar]
- Sun XJ, Tolbert LP, Hildebrand JG. Synaptic organization of the uniglomerular projection neurons of the antennal lobe of the moth Manduca sexta: a laser scanning confocal and electron microscopic study. J. Comp. Neurol. 1997;379:2–20. doi: 10.1002/(sici)1096-9861(19970303)379:1<2::aid-cne2>3.0.co;2-8. [DOI] [PubMed] [Google Scholar]
- Vickers NJ, Christensen TA, Baker TC, Hildebrand JG. Odour-plume dynamics influence the brain’s olfactory code. Nature. 2001;410:466–470. doi: 10.1038/35068559. [DOI] [PubMed] [Google Scholar]
- Wachowiak M, Ache BW. Multiple inhibitory pathways shape odor-evoked responses in lobster olfactory projection neurons. J. Comp. Neurol. 1998;182:425–434. [Google Scholar]
- White J, Hamilton KA, Neff SR, Kauer JS. Emergent properties of odor information coding in a representational model of the salamander olfactory bulb. J. Neurosci. 1992;12:1772–1780. doi: 10.1523/JNEUROSCI.12-05-01772.1992. [DOI] [PMC free article] [PubMed] [Google Scholar]
- White J, Dickinson TA, Walt DR, Kauer JS. An olfactory neuronal network for vapor recognition in an artificial nose. Biol. Cybern. 1998;78:245–251. doi: 10.1007/s004220050430. [DOI] [PubMed] [Google Scholar]