Abstract
Objective
Few studies on the clinical spectrum of automated pressure-controlled discography (APCD)-defined positive discs have been reported to date. Thus, the present study was undertaken to analyze clinical parameters critical for diagnosis of discogenic pain and to correlate imaging findings with intradiscal pressures and pain responses in patients with APCD-positive discs.
Methods
Twenty-three patients who showed APCD-positive discs were selected for analysis. CT discogram findings and the degrees of nuclear degeneration seen on MRI were analyzed in comparison to changes of intradiscal pressure that provoked pain responses; and clinical pain patterns and dynamic factors were evaluated in relation to pain provocation.
Results
Low back pain (LBP), usually centralized, with diffuse leg pain was the most frequently reported pattern of pain in these patients. Overall, LBP was most commonly induced by sitting posture, however, standing was highly correlated with L5/S1 disc lesions (p < 0.01). MRI abnormalities were statistically correlated with grading of CT discogram results (p < 0.05); with most pain response observed in CT discogram Grades 3 and 4. Pain-provoking pressure was not statistically correlated with MRI grading. However, it was higher in Grade 3 than Grade 4.
Conclusion
APCD-positive discs were demonstrated in patients reporting centralized low back pain with diffuse leg pain, aggravated by sitting and standing. MRI was helpful to assess the degree of nuclear degeneration, yet it could not guarantee exact localization of the painful discs. APCD was considered to be more useful than conventional discography for diagnosis of discogenic pain.
Keywords: Low back pain, Intervertebral disc, Discography, MRI, Discogenic pain
INTRODUCTION
Lumbar disc pathology has long been recognized as one of the main causes of chronic low back pain (CLBP)1,21). Recent reports indicate CLBP can be caused by structure-specific etiologies including zygapophyseal joint abnormality, disc pathology, and sacroiliac joint arthropathy; and that about 26-40% of CLBP patients were known to have discogenic pain8,13,17). Recent development of high-resolution neuroimaging methods has facilitated diagnostic work-up for discogenic pain. This has been especially effective in the case of herniated nucleus pulposus and degenerated disc pathology if patients' symptoms and signs are closely correlated with neuroimaging findings. However, even modern neuroimaging equipment such as magnetic resonance imaging (MRI) and computerized tomography (CT) do not reach the level of resolution needed to visualize great detail and tiny abnormalities of spinal structures. Thus, for example, the diagnosis of internal disc disruption (IDD) which contains tiny fissures in the annulus pulposus may be missed. Furthermore, as shown by Boos et al.3), neuroimaging abnormalities are not often correlated with pain source in patients with spinal pain.
In early days of discography, it was performed to demonstrate disc morphology and to diagnose disc herniation in CLBP. However, this technique is no longer used for diagnosing disc herniation and result do not correlate well with morphology of intradiscal degeneration2). Instead, provocation discography often referred as "disc stimulation" is currently used to stimulate individual "painful discs" to determine whether they are sources of patients' spinal pain2,25). In modern provocation discography, slow increase of intradiscal pressure by injecting contrast media into the nucleus pulposus can produce patient's accustomed pain if the disc is painful, while stimulation of normal disc does not produce any pain. Provocation discography has been recognized to be a very specific diagnostic test for discogenic pain. However, Seo et al.23) demonstrated that there is a difference between static pressure and real time dynamic pressure if the injection speed is fast. This pressure discrepancy makes it difficult to obtain a uniform result and interpretation of the discography procedure. An automated discography device can accurately control the speed of contrast medium injection and simultaneously display the peak pressure. Therefore, it is known to decrease potential errors produced by inexperienced discographers. Further, it is assumed that automated discography devices such as APCD system will allow more accurate isolation of the subgroups of positive or negative discs. The purpose of this study was to find characteristic clinical parameters associated with pain-aggravating factors using automated discography, and to determine the relationship of MRI and CT discogram findings with intradiscal pressure and pain responses thus observed.
MATERIALS AND METHODS
Patient population
A total of 24 discs showing positive response using automated discography in 23 patients were collected from a consecutive series of 65 patients. A positive disc was defined in accordance with the criteria of International Association for the Study of Pain; ≥ 6/10 concordant pain elicited at ≤ 50 psi above opening pressure with at least one painless control level18). Patients who did not meet these criteria were not included. All patients had more than 12 weeks of unremitting LBP despite appropriate conservative management. Inclusion criteria were as follows : 1) only midline LBP, 2) midline LBP with leg pain, 3) LBP, confirmed not to have pain source in zygapophyseal joint or nerve root, 4) no obvious evidence of herniation and extrusion of disc on neuroimaging with corresponding neurological signs.
Provocation discography
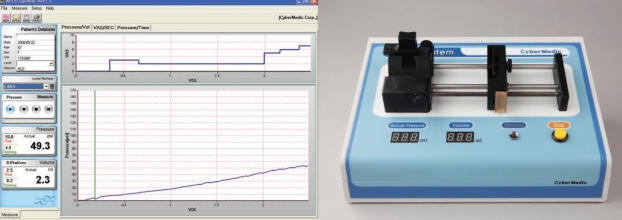
Patients underwent discography in the operating room under guidance of a C-arm image intensifier (Series 9600, GE OEC medical systems, UT, USA). Discography injection needles were placed according to standard technique, with at least one control disc tested in addition to symptomatic discs9). The discography needle was connected to the APCD system® (Cybermedic Corp, Iksan, Korea) (Fig. 1). The APCD system was equipped with a programmable variable-speed syringe pump capable of pressure up to 150 psi, pressure sensors, and a data acquisition box. It included a computer system loaded with software programmed to display pressure changes throughout the time of injection, and pressure/volume curves26). Nonionic contrast medium (Iopamiro, Ilsung Pharmaceuticals, Seoul, Korea) was injected into each disc using a motorized syringe of the APCD saystem. Injection speed was held constant at 0.01 cc/sec to avoid any pressure discrepancy between syringeal pressure and intradiscal pressure. Opening pressure was set when leakage of contrast media from the tip of the needle was first seen under fluoroscopic observation. Thereafter, actual pressure (syringeal pressure minus opening pressure) was continuously displayed on the screen. The patient was asked to describe the nature, distribution, and intensity of pain on a 0-10 visual analog scale (VAS) when he or she subjectively perceived pain. Whenever there were changes of VAS, they were registered via keypad by the patient or the operator. Thus, all pain responses along the injection timeline were displayed and monitored. Injection was continued until one of the following end points was reached : 1) pain ≥ 7 VAS; 2) intradiscal pressure ≥ 70 psi; or 3) injection volume ≥ 3.5 mL. After the procedure, patients were moved immediately to the CT Room (SOMATOM Sensation 4, Siemens, Malvern, PA, U.S.A.) where a post-discography CT scan was performed. Approximately, three to four slices at 5-mm thickness and 4-mm intervals were checked at each disc level in axial view with simultaneous reconstruction of sagittal views.
Fig. 1.
Automated discography (APCD system). Note the display of pressure/volume curve (lower graph) and change of visual analog scale (upper graph) on the moniotor screen (left), and device equipped with motorized syringe pump (right).
Positive response of discography
A discography-positive disc was defined as one where concordant pain was produced with an intensity ≥ 6/10, and abnormal morphology on CT discogram was observed, while a control disc injection at another level produced no pain6).
Evaluation of pain patterns
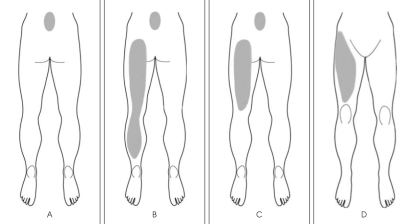
All patients were interviewed by a pain-specialized nurse who recorded pain distribution, nature of pain and pain-related dynamic factors. Drawings of pain distribution patterns were completed for all patients before discography, and subsequently the patterns were classified into four types (Fig. 2). Type A shows pain distribution in the lower back only; Type B shows the combination of A and posterior leg pain extending above the knee joint. If the posterior leg pain extended to the ankle, in combination with Type A, it was defined as Type C. Type D shows anterior leg pain, with or without associated back pain. In addition, "dynamic factors" which can aggravate or induce pain were evaluated. Dynamic factors include flexion and extension, and lying, sitting, standing, walking and transitional movement.
Fig. 2.
Pain distribution patterns of discogenic pain. Type A shows pain distribution in the lower back only; Type B shows the combination of A and posterior leg pain. Type C indicates the combination of Type A and posterior leg pain extending just above the knee joint. Type D demonstrates anterior leg pain, with or without associated back pain.
Analysis of imaging findings
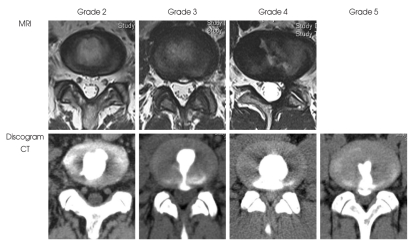
MRI results from twenty patients were available for analysis. Grading of disc degeneration was classified on the basis of structure, distinction of nucleus and annulus, signal intensity, and height of intervertebral disc according to Pfirrmann et al.20). All the MRI results were evaluated by a neuroradiologist who was blinded to the results of discography. Imaging of post-discography CT was used to determine the direction of fissure as well as to grade the extent of annular disruption according to the modified Dallas Discogram Classification (Fig. 3); grade 1 fissures reach the inner third of the annulus; grade 2 and 3 fissures reaches the middle third and outer third, respectively; grade 4 indicates the circumferencial spread of fissures is greater than 30 degree; grade 5 describes the completel rupture of Grade 3 or grade 4 fissures.
Fig. 3.
Demostration of magnetic resonance image (MRI) and computed tomography discogram grades sampled from the patients. Note the disc degenerations without herniations in MRI. Extensions of annular tears are demonstrated in conjunction with MRI grades in Discogram-computed tomography findings.
Statistical analysis
Statistical analyses were performed using SPSS 11.0 software (SPSS, Chicago, IL, USA). Statistical analysis for MRI and Dallas discogram grade, intradiscal pressure, and pain responses was performed with ANOVA. All differ-ences were regarded as significant if p < 0.05.
RESULTS
Demographic profile
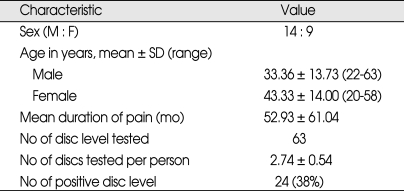
The demographic characteristics of 14 male and 9 female patients are summarized in Table 1. The average age of males was 33.36 ± 13.73 (range 22-63 years) and that of females was 43.33 ± 14.0 years (range 20-58 years). Average duration of pain before discography among all the patients was 52.93 ± 61.04 months. The total number of discs tested was 63, and concordant pain responses were observed in 24 discs in 23 patients because one patient showed concordant pain responses in two levels. There were one positive disc in L1/L2, two in L3/L4, nine in L4/L5, and twelve in L5/S1 intervertebral level .
Table 1.
Demographic profile
Clinical parameters
Analysis of pain patterns in APCD-positive patients revealed 16 (60%) with Type C pattern, 4 (17%) with Type A, 2 (9%) with Type B, and 1 (5%) patient with Type D pain pattern. Low back pain in these patients showed a tendency of centralization around midline and leg pain was diffuse. Neurological examination disclosed no neurological deficit. Among dynamic factors, pain was most commonly induced by sitting posture (91%), followed by standing (65%), flexion (61%), and walking (52%) (Table 2). Standing was quite closely correlated with L5-S1 disc lesions (p < 0.01), compared to other levels of disc lesions. In contrast, lying and transitional movement were dynamic factors least correlated with pain production all the lumbar levels of disc lesions.
Table 2.
Frequency of dynamic factors aggravating discogenic pain depending on the levels
*p value < 0.01
MRI and CT discogram findings
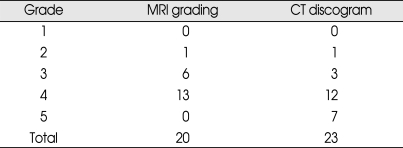
Table 3 summarizes the morphological MRI grading and CT discogram results. MRI and CT discograms showed relatively concordant grading in grades 2 and 4. However, they did not in grade 3 and 5. The grade of CT discogram was higher in more-degenerated discs. MRI abnormalities were statistically correlated with grading of CT discogram (p < 0.05). However, other CT discogram findings (including direction and angle of annulus fissures) were not correlated with pain responses and pain patterns.
Table 3.
Comparision of disc degeneration on MRI with CT discogram classification
CT : computed tomography, MRI: magnetic resonance image
Intradiscal pressure and pain response in relation with imaging abnormality
Average opening pressure was 15.98 psi and average pressure to provoke pain was 33.63 psi. Opening pressure was not correlated with degree of nuclear degeneration shown in MRI. Although most pain response was observed in grade 3 (30%) and grade 4 (65%), pain response was not statistically correlated with MRI grading. Pressure to provoke the pain response was also not statistically correlated with MRI grading, however, the pain-provoking pressure was higher in grade 3 than grade 4.
Complications after discography
There were no discography-related infection or hemorrhage seen in any of the patients. Although pain aggravation after discography was frequently noted, it was easily controlled with medication and disappeared within 48 hours.
DISCUSSION
Although discogenic pain is well known to clinicians dealing with back pain, it is very difficult to diagnose because it lacks characteristic clinical findings by which reliable clinical diagnosis can be made. Recently, several studies have postulated that discogenic pain is induced by stimulation of a painful disc11,22,27). When annular fissures extend into the boundary of a disc, branches of sinuvertebral nerve have been observed growing inside, possibly into nucleus pulposus. Mechanical pressure due to long standing or sitting or injection of contrast medium into the nucleus pulposus can stimulate the sensitive peripheral nerve endings of ingrowing sinuvertebral branches, thereby producing discogenic pain. Provocation discography was known to simulate the mechanical pressure by increasing the intradiscal pressure, however, its stimulation method is not the same as mechanical stimulation imposed by physical posture and movement15). In addition, there are other technical sources of errors during the procedure as well as in interpretation of discography results23).
We used an APCD to validate the procedure and interpretation of discography, since the term 'discography' does not ensure that the procedure is performed consistently with correct interpretation. Conventional discography may not provide the same results under the same conditions for several reasons : interobserver variability during discography; differences in experience and technique in performing the procedure; and normal biological variations in the test subjects2,4,5,10,16,28). Furthermore, a false negative response is a common problem for inexperienced discographers because they are likely to inject contrast media at high speed, which leads to a discrepancy between real intradiscal pressure and manometric pressure23). The APCD system is helpful in overcoming inherent drawbacks of discography by injecting the contrast media less than 0.01 cc/sec to minimize the difference between postsyringeal pressure and intradiscal pressure. The APCD system also visualizes intradiscal pressure dynamically and at the end of the procedure, and all data are saved for later accurate interpretation. It should be noted that this low speed of injection is almost impossible to achieve by human hands. Therefore, our method of provocation discography contributes to lowering rates of false negative response and thus has a more valid basis compared to other studies.
Lack of characteristic clinical symptoms and signs is an important element in misleading the clinician's diagnosis of discogenic pain2,19,21). Considering this problem, we attempted to classify pain patterns in our patients to guide diagnosis of discogenic pain; however, this classification did not prove to correlate significantly with clinical factors and demographic data. However, we found that back pain combined with posterior leg pain was most common, followed by back pain only, and back pain with buttock pain. Axial back pain was observed in most patients and has the tendency to be localized in the midline, comparable to diffuse or band-like back pain observed in lumbar zygapopjyseal joint arthropathy12,14). The leg pain was diffuse extending to knee joint or ankle, comparable to narrow cord-like sciatica observed in radicular pain of disc herniation. These pain patterns are consistent with other previously published studies21). Our results showed that these pain patterns can be induced by various kinds of movements (dynamic factors). Sitting, sitting posture, flexion and walking movement were all closely correlated with induction of discogenic pain, while long standing was statistically associated with L5/S1 disc pathology and walking was least associated with L4/5 disc lesions.
If strict classification guidelines are guaranteed, MRI is an excellent tool to define disc degeneration7,20,24). In our study, grading of MRI abnormality was correlated with that of CT discogram except grade 5 (p < 0.05). However, it was difficult to match both grading systems in the group higher than grade 3. Painful degenerated disc often appears to maintain disc contour in MRI, yet annular fissures extending into the canal can facilitate leakage of contrast dye. If disc degeneration is severe, it is difficult to raise the intradiscal pressure up to the level to provoke a pain res-ponse. Consistent with this idea, our results show pain-provoking pressure is lower in grade 4 than grade 3 of MRI abnormality. This implies that a false negative response may occur due to leakage of contrast media, and subsequent failure to increase intradiscal pressure. Development of a new method to eliminate this limitation of discography is a challenge for the future.
In our series, it is not possible to elucidate the rate of false positive responses. However, all the patients have other clinically relevant information such as clinical symp-tomatology and imaging data directly related or indirectly related with discogenic pain. Several factors including psychological comorbidity, complex pain syndrome, narcotic usage, and secondary gain issues have been suggested to correlate with false positive responses. Carragee et al.5) suggested that the false positive rate in asymtomatic subjects is about 25%. While in contrast, Bogduk and Modic2) hypothesized that low pressure disc injection can effectively eliminate false positive discography risks. We observed that the smooth progress of the procedure using the APCD system helped patients to be emotionally more stable during discography, and thus very likely contributed to a decrease in the false positive rate.
This study has some drawbacks. The sample size is not large enough to cover the diverse clinical findings of discogenic pain. In addition, a small number of the patients could not be appropriately assigned depending upon their difference of pressure in the patients with positive response. A larger cohort study is thus required for further detailed analysis. However, this is a pioneering study to elucidate and correlate clinical findings in patients with positive disc response defined by automated discography.
CONCLUSION
We have analyzed the patients who showed positive response during autumoated discography. Centralized midline back pain with diffuse leg pain was commonly observed in these patients with discogenic pain. Sitting was most commonly correlated with pain aggravation, and standing was correlated with pain production particularly in the L5/S1 disc lesion. MRI and CT discogram findings were significantly correlated with each other, however, imaging findings were not helpful to determine which would be the painful disc. One distinct benefit in the use of automated discography is validating the contents of discography and contibuting to the accurate interpretation of discography results. In addition, it may lower false positive or negative responses compared with conventional discography.
Acknowledgements
This study was supported by a grant of the Korea Healthcare technology R&D Project (A091220), Ministry for Health, Welfare & Family Affairs, Korea. We thank Dr. Donna M. Simmons for revising this manuscript.
References
- 1.Bogduk N. Low back pain. In: Bogduk N, editor. Clinical anatomy of the lumbar spine and sacrum. London: Churchill Livingstone; 2002. pp. 187–213. [Google Scholar]
- 2.Bogduk N, Modic MT. Lumbar discography. Spine (Phila Pa 1976) 1996;21:402–404. doi: 10.1097/00007632-199602010-00031. [DOI] [PubMed] [Google Scholar]
- 3.Boos N, Rieder R, Schade V, Spratt KF, Semmer N, Aebi M. 1995 Volvro Award in clinical sciences. The diagnostic accuracy of magnetic resonance imaging, work perception, and psychosocial factors in identifying symptomatic disc herniations. Spine (Phila Pa 1976) 1995;20:2613–2625. doi: 10.1097/00007632-199512150-00002. [DOI] [PubMed] [Google Scholar]
- 4.Carragee EJ, Tanner CM, Yang B, Brito JL, Truong T. False-positive findings on lumbar discography. Reliability of subjective concordance assessment during provocative disc injection. Spine (Phila Pa 1976) 1999;24:2542–2547. doi: 10.1097/00007632-199912010-00017. [DOI] [PubMed] [Google Scholar]
- 5.Carragee EJ, Tanner CM, Khurana S, Hayward C, Welsh J, Date E, et al. The rates of false-positive lumbar discography in select patients without low back symptoms. Spine (Phila Pa 1976) 2000;25:1373–1380. doi: 10.1097/00007632-200006010-00009. discussion 1381. [DOI] [PubMed] [Google Scholar]
- 6.Carragee EJ, Alamin TF, Carragee JM. Low-pressure positive discography in subjects asymptomatic of significant low back pain illness. Spine (Phila Pa 1976) 2006;31:505–509. doi: 10.1097/01.brs.0000201242.85984.76. [DOI] [PubMed] [Google Scholar]
- 7.Carrino JA, Lurie JD, Tosteson AN, Tosteson TD, Carragee EJ, Kaiser J, et al. Lumbar spine : Reliability of MR imaging findings. Radiology. 2009;250:161–170. doi: 10.1148/radiol.2493071999. [DOI] [PMC free article] [PubMed] [Google Scholar]
- 8.Coppes MH, Marani E, Thomeer RT, Groen GJ. Innervation of "painful" lumbar discs. Spine (Phila Pa 1976) 1997;22:2342–2349. doi: 10.1097/00007632-199710150-00005. [DOI] [PubMed] [Google Scholar]
- 9.Derby R, Howard MW, Grant JM, Lettice JJ, Van Peteghem PK, Ryan DP. The ability of pressure-controlled discography to predict surgical and nonsurgical outcomes. Spine (Phila Pa 1976) 1999;24:364–371. doi: 10.1097/00007632-199902150-00014. discussion 371-372. [DOI] [PubMed] [Google Scholar]
- 10.Derby R, Howard MW, Grant JM, Lettice JJ, Van Peteghem PK, Ryan DP. The ability of pressure-controlled discography to predict surgical and nonsurgical outcomes. Spine (Phila Pa 1976) 1999;24:364–371. doi: 10.1097/00007632-199902150-00014. [DOI] [PubMed] [Google Scholar]
- 11.Freemont AJ, Watkins A, Le Maitre C, Jeziorska M, Hoyland JA. Current understanding of cellular and molecular events in intervertebral disc degeneration : implications for therapy. J Pathol. 2002;196:374–379. doi: 10.1002/path.1050. [DOI] [PubMed] [Google Scholar]
- 12.Jung JH, Kim HI, Shin DA, Shin DG, Lee JO, Kim HJ, et al. Usefulness of pain distribution pattern assessment in decision-making for the patients with lumbar zygapophyseal and sacroiliac joint arthropathy. J Korean Med Sci. 2007;22:1048–1054. doi: 10.3346/jkms.2007.22.6.1048. [DOI] [PMC free article] [PubMed] [Google Scholar]
- 13.Kuslich SD, Ulstrom CL, Michael CJ. The tissue origin of low back pain and sciatica : a report of pain response to tissue stimulation during operations on the lumbar spine using local anesthesia. Orthop Clin North Am. 1991;22:181–187. [PubMed] [Google Scholar]
- 14.Laslett M, Oberg B, Aprill CN, McDonald B. Centralization as a predictor of provocation discography results in chronic low back pain, and the influence of disability and distress on diagnostic power. Spine J. 2005;5:370–380. doi: 10.1016/j.spinee.2004.11.007. [DOI] [PubMed] [Google Scholar]
- 15.Lee SH, Derby R, Chen Y, Seo KS, Kim MJ. In vitro measurement of pressure in intervertebral discs and annulus fibrosus with and without annular tears during discography. Spine J. 2004;4:614–618. doi: 10.1016/j.spinee.2004.03.021. [DOI] [PubMed] [Google Scholar]
- 16.Lee SW, Kim KN, Chin DK, Kim YS, Cho YE, Jin BH. Diagnostic significance of discography on multiple lumbar disk herniation. J Korean Neurosurg Soc. 2000;29:628–634. [Google Scholar]
- 17.Manchikanti L, Singh V, Pampati V, Damron KS, Barnhill RC, Beyer C, et al. Evaluation of the relative contributions of various structures in chronic low back pain. Pain Physician. 2001;4:308–316. [PubMed] [Google Scholar]
- 18.Merskey H, Bogduk N. Spinal and radicular pain syndrome. In: Merskey H, Bogduk N, editors. Classification of cronic pain : Description of chronic pain syndrome and definition of pain terms. ed 2. Seattle: IASP; 1994. [Google Scholar]
- 19.Ohnmeiss DD, Vanharanta H, Ekholm J. Relation between pain location and disc pathology : a study of pain drawings and CT/discography. Clin J Pain. 1999;15:210–217. doi: 10.1097/00002508-199909000-00008. [DOI] [PubMed] [Google Scholar]
- 20.Pfirrmann CW, Metzdorf A, Zanetti M, Hodler J, Boos N. Magnetic resonance classification of lumbar intervertebral disc degeneration. Spine (Phila Pa 1976) 2001;26:1873–1878. doi: 10.1097/00007632-200109010-00011. [DOI] [PubMed] [Google Scholar]
- 21.Schwarzer AC, April CN, Derby R. The prevalence and clinical features of internal disc disruption in patients with chronic low back pain. Spine (Phila Pa 1976) 1995;20:1878–1883. doi: 10.1097/00007632-199509000-00007. [DOI] [PubMed] [Google Scholar]
- 22.Sehgal N, Fortin JD. Internal disc disruption and low back pain. Pain Physician. 2000;3:143–157. [PubMed] [Google Scholar]
- 23.Seo KS, Derby R, Date ES, Lee SH, Kim BJ, Lee CH. In vitro measurement of pressure differences using manometry at various injection speeds during discography. Spine J. 2007;7:68–73. doi: 10.1016/j.spinee.2006.05.013. [DOI] [PubMed] [Google Scholar]
- 24.Sharma A, Pilgram T, Wippold FJ., 2nd Association between annular tears and disk degeneration : a longitudinal study. AJNR Am J Neuroradiol. 2009;30:500–506. doi: 10.3174/ajnr.A1411. [DOI] [PMC free article] [PubMed] [Google Scholar]
- 25.Shin DA, Kim HI, Jung JH, Shin DG, Lee JO. Diagnostic relevance of pressure-controlled discography. J Korean Med Sci. 2006;21:911–916. doi: 10.3346/jkms.2006.21.5.911. [DOI] [PMC free article] [PubMed] [Google Scholar]
- 26.Shin DA, Kim SH, Han IB, Rhim SC, Kim HI. Factors influencing manometric pressure during pressure-controlled discography. Spine (Phila Pa 1976) 2009;34:E790–E793. doi: 10.1097/BRS.0b013e3181ba2a8d. [DOI] [PubMed] [Google Scholar]
- 27.Slipman CW, Patel RK, Zhang L, Vresilovic E, Lenrow D, Shin C, et al. Side of symptomatic annular tear and site of low back pain : is there a correlation? Spine (Phila Pa 1976) 2001;26:E165–E169. doi: 10.1097/00007632-200104150-00026. [DOI] [PubMed] [Google Scholar]
- 28.Tomecek FJ, Anthony CS, Boxell C, Warren J. Discography interpretation and techniques in the lumbar spine. Neurosurg Focus. 2002;13:E13. doi: 10.3171/foc.2002.13.2.14. [DOI] [PubMed] [Google Scholar]


