

Summary
Background
The dynamics of UV-induced melanogenesis have been well-characterized for single UV exposures. However, our knowledge of the effects of repeated UV exposures on the development of new pigmentation is limited.
Objectives
To characterize the dynamics and dose dependence of pigmentation induction by repeated UV exposures using two different UV sources.
Methods
A total of 40 healthy subjects participated in the study; 21 were exposed to a 5% UVB/95% UVA source and 19 were exposed to a 2% UVB/98% UVA source. Skin phototypes 2 to 3 were represented. Subjects were exposed 1-3 times per week. The minimal erythemal dose and minimal melanogenic dose of all subjects were determined, and both visual and instrumental observations of the development of pigmentation and erythema were recorded.
Results
Dark brown pigmentation could be produced by a cumulative UV dose of 4200 J/m2 given as 10 exposures over 5 weeks. However, comparable pigmentation could also be induced by a cumulative dose of 2900 J/m2 given in 8 exposures over 4 weeks. The lowest cumulative dose of 1900 J/m2 given over 4 weeks produced moderate pigmentation. The 2% UVB source led to earlier and darker pigmentation than the 5% UVB source did for equally erythemogenic doses.
Conclusions
These observations show that the dynamics of melanogenesis induced by repeated exposures depends on UV dose, dose interval and emission spectrum. They also indicate that increasing the UV dose above a certain level of cumulative exposure does not significantly increase the level of UV-induced pigmentation.
Keywords: pigmentation, melanogenesis, repeated exposures, ultraviolet radiation
Ultraviolet radiation (UV) induces melanogenesis in human skin. However, there have been few quantitative studies of melanogenesis induced by repetitive UV exposures (as in real life). In this area, our knowledge derives primarily from the classic studies led by Parrish, Pathak, Kaidbey and Kligman 1-4. They showed that daily suberythemogenic doses enhance pigmentation and subsequently lower the erythema threshold. Exposures given at 48-hr intervals produced less erythemogenic reactions4. Recent studies have shown that repeated, suberythemal exposures to UVA-rich sources are more effective in producing a tan than are those from UVB-rich sources (including solar simulators) 1;5-7.
de Winter et al. 8 showed that exposures given three times weekly for 3 weeks (using increasing doses) resulted in increased pigmentation as measured by L* (measure of skin ’lightness’). However, they suggest that exposures be given less frequently than three times weekly to reduce DNA damage accumulation. Ruegemer et al 9 observed an “obvious increase in pigmentation” in 99 human subjects who used a commercial sunbed 2×/wk for 6 weeks. Instrumentally, the L* values changed by a modest 2.6 chromametric units (C.U.) or less. Cumulative doses were between 11,300 and 14,600 J/m2 but unfortunately they were not wavelength-weighted with the erythema action spectrum and, thus, cannot be easily compared with data from other studies, including this one.
Caswell 10 evaluated effects of exposures repeated according to the U.S. Food and Drug Administration (FDA) guidelines for sunlamp manufacturers 11. After 2 weeks of thrice weekly suberythemal exposures, new pigmentation became apparent. After 7 weeks of increasing exposures (up to 550 J/m2 – eryth. eff.), a dark pigmentation with no visible erythema was produced. Cumulative doses were ca. 9,300 J/m2.
Our pilot study 12 indicated that pigmentation can be induced by repeated exposures with cumulative doses much lower than those used in prior studies and commercial practice. To learn more about melanogenesis induced by repetitive UV exposures, we explored the effects of dose, dose interval, and UV source emission spectrum in a larger cohort of human subjects. The results are presented in this paper.
Materials and Methods
Subjects
The protocol #01-026R was approved by the FDA Research Involving Human Subjects Committee. Forty healthy human subjects were recruited in the Washington, DC metropolitan area, gave written consent, and were examined by a dermatologist.
Procedures
At each visit, the subjects underwent the following procedures: (1) photography of the study area, (2) visual assessment, (3) instrumental skin color measurements and, (4) UV exposure of the study sites. Three 3×3-cm sites were irradiated while a fourth site served as an unexposed control. Subjects were exposed in a prone position under a canopy equipped with fluorescent UV lamps (see below) using a custom-made template with 3×3-cm openings. The rest of the body was covered. The instrumental measurements of skin color were taken in all four sites on the first visit, prior to UV exposure. These values were subtracted from all subsequent measurements in each respective area to calculate changes in color parameters. Biopsies from all four sites were taken 24 hrs after the final exposure. The results of the biopsy analyses are presented in part in Yamaguchi et al 13.
Photography
A digital camera: single-lens reflex, Nikon D1, was used with a 28-105 mm lens (Nikon Corporation, Tokyo, Japan) at 2.7 million pixels (for details, see 12), and a Canon Rebel 2000 35-mm camera with a 28-80 zoom lens was used with Kodak Royal ASA 200 film. (see 14). Illumination for both cameras was provided by the Speedotron system (see 15).
Ultraviolet radiation sources
The UV exposure canopies (SunQuest Model SQ 2000S, ETS, Indianapolis, IN) were equipped with twelve 100 watt fluorescent UV lamps that are commonly used for tanning. Source 1 was equipped with Beach Sun sunlamps (Light Sources, Orange, CT) and Source 2 with Cosmolux VLR.T sunlamps (Cosmedico Light, Weymouth, MA). The emission spectra of these lamps (Figure 1) were measured using a double-grating spectroradiometer (Optronic Laboratories, Model 754, Orlando, FL). calibrated as described in 13.
Figure 1.
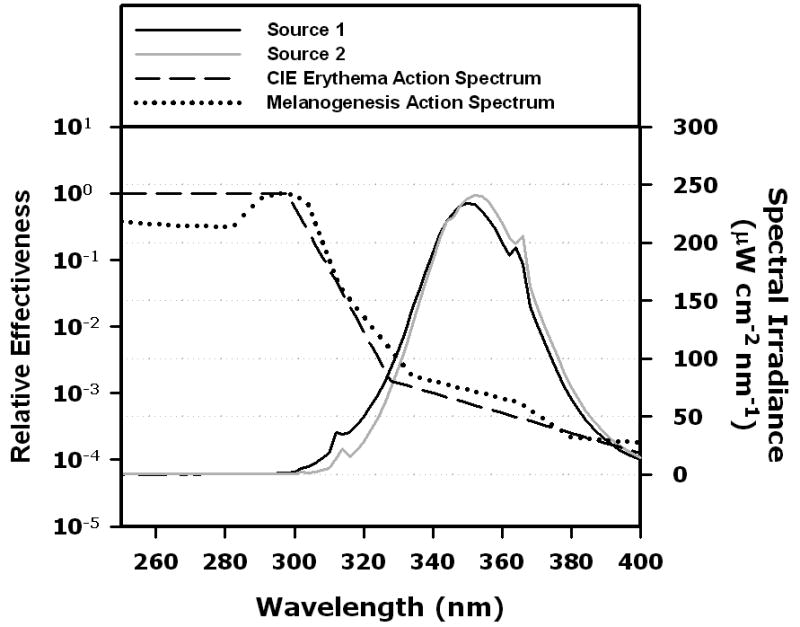
Emission spectra of the UV sources used in this study (canopies fitted with 12 sunlamps). Black line: source 1, grey line: source 2. For comparisons, action spectra are included: dashed line indicates CIE Erythema Action Spectrum 16, dotted line indicates melanogenesis action spectrum 2. The ordinate on the right side: spectral irradiance. The ordinate on the left: relative effectiveness at each wavelength for inducing erythema or melanogenesis.
For the evaluation of the minimal erythema dose (MED), we used an array of eight Kodacel-filtered (Eastman Chemical Products, Kingsport, Tennessee) FS lamps (FSX24T12/UVB/HO, National Biological Corporation, Twinsburg, OH). A low-profile detector (SSD 001A, International Light, Newburyport, MA) coupled to a radiometer (IL1700, International Light) was used prior to each exposure to measure the intensity in each spot on the subjects' back and to calculate the required exposure time. This detector had previously been calibrated using the measurements made with the spectroradiometer.
Minimal erythema dose (MED) and minimal melanogenic dose (MMD) determination
UV exposures were administered on one side of the back to determine each subject's MED. Eight 2×2 cm sites were exposed to arithmetically increasing UV doses from the FS lamps 12. Using the CIE reference action spectrum for erythema 16, the doses were converted into erythema-effective J/m2 by wavelength-weighting the source emission spectrum with the erythema action spectrum, integrating the area under the resultant curve and multiplying by the exposure time. Unless otherwise specified, all UV doses reported in this paper are erythema- effective. We graded erythema on a scale from 0 for ‘no reaction’ to 5 for a ‘violaceous red’. We defined the MED as a grade of 2 (pink erythema with at least one border) 24 hr after exposure. The MMD was determined using the same sites. MMD was defined as the lowest dose that produced a light brown pigmentation (grade = 2, see below) eight days after exposure.
Exposure protocols
Figure 2 shows the three UV exposure protocols:
Figure 2.
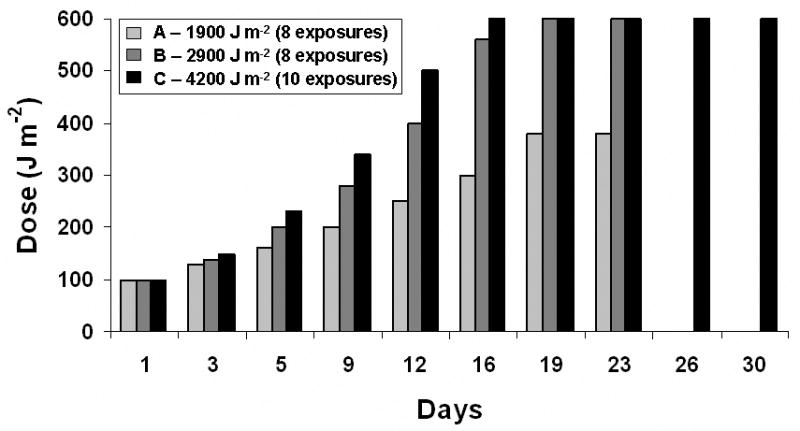
UV doses and timing in the three experimental protocols
Each Protocol used an initial dose of 100 J/m2, Protocol A: doses increase by increments of 25% up to 380 J/m2, with exposures ceasing on Day 23 to accumulate 1900 J/m2. Protocol B: doses increase by increments of 40% up to 600 J/m2, with exposures ceasing on Day 23 to accumulate 2900 J/m2. Protocol C: doses increase by increments of 50% up 600 J/m2, with exposures ceasing on Day 30 to accumulate 4200 J/m2.
These protocols were used for 21 subjects treated with Source 1 and for 19 subjects treated with Source 2.
Visual evaluation of changes in skin pigmentation
At each visit, the skin pigmentation was evaluated by eye prior to that day's UV exposure using the scale below:
| 0 | No reaction |
| 0.5 | Observer indecisive |
| 1 | Minimal perceptible pigmentation, faint or no borders |
| 2 | Light brown |
| 3 | Moderately brown |
| 4 | Dark brown |
Erythema and Melanin Index
Erythema and Melanin Index were measured with the DiaStron Erythema/Melanin Index meter (DiaStron, Andover, U.K.). This instrument measures the reflectance at 546, 632 and 905 nm (Full Width Half Maximum <9 nm at each wavelength). The Erythema Index is defined as:
and the Melanin Index (MI) as:
where Rλ is the reflectance at the specified wavelength.
Measurements were taken in triplicate and averages of the three measurements were obtained. Finally, ΔEI and ΔMI were calculated as the difference between the average values for exposed areas on a given day and the average values for the same areas prior to exposures.
Diffuse Reflectance Spectrometry
We used the CM-2002 spectrophotometer (Minolta Corp, Ramsey, New Jersey), which measures the diffuse reflectance from 400 to 700 nm at 10-nm increments using an integrating sphere with an 8-mm aperture and a target mask that minimizes pressure in the measured area. After preparation as described above, three readings of spectral reflectance were taken for each of the four study areas and the results were averaged. The Minolta CM-2002 uses the spectral reflectance data to calculate the L*a*b* values of the CIE system of color quantification 17 as described in 14. Changes in the L* value and a* value are reported in this paper. Also, the vector quantity delta E (combination of three parameters) was used by us to compare the results of this study with the values reported by Caswell 9, where:
Measurements taken prior to UV exposure were used to calculate ΔL*, Δa* and Δb*.
Individual Typology Angle (ITA°) based on the L*a*b* system
The ITA° is a vector representation in the plane of the L* vs b* values 18. ITA° is expressed in degrees and is defined as:
The ITA° is considered an objective parameter to quantify skin color and has been used in several studies 19-21 to measure pigmentation development. In this study ITA° values are reported as the change in ITA° or ΔITA°.
Statistical Evaluation
SAS PROC MIXED (SAS Institute Inc., SAS/STAT Users Guide, Version 9.1, 2002: Cary, NC), a general linear mixed model, was used to model the dependent measures (ΔMI, ΔE, ΔL*, and ΔITA) at day 24 for protocols A and B and at day 31 for protocol C, by Source 1 and 2, as linear functions of protocols A, B, and C.
Results
Evaluation of UV sources
We used two different UV sources (see Methods). Their emission spectra are shown in Figure 1. Source 1 emitted 5% UVB/95% UVA, while Source 2 emitted 2% UVB/98% UVA. Table 1 shows that although the proportion of UVB in both UV sources was lower than that of the Reference Sun 22, Source 1 was more powerful and Source 2 was less powerful than the Reference Sun in terms of both erythemogenic and melanogenic output. The UVA component of the dose per 1st exposure (100 J/m2) was >2 times higher for Source 2 than for Source 1, although the melanogenic-effective dose was similar for both sources and the Reference Sun. These differences in emission spectra significantly affected the melanogenic efficacies of these lamps.
Table I.
Basic parameters of UV sources used in this study compared to those of a standard solar spectrum, or “Reference Sun” (Solar Spectral Irradiance, 1 Atmosphere Global,22).
| % UVB | % UVA | UVB (W/m2) |
UVA (W/m2) |
Erythemogenic output (W/m2-eff) |
Melanogenic output (W/m2-eff) |
Time of 1st exposure (sec) |
UVA dose per 1st exposure (J/m2) |
Melanogenic dose per 1st exposure (J/m2) |
|
|---|---|---|---|---|---|---|---|---|---|
| Source 1 | 5 | 95 | 5.1 | 100 | 0.43 | 0.69 | 234 | 23400 | 161 |
| Source 2 | 2 | 98 | 2.3 | 102 | 0.2 | 0.3 | 486 | 49572 | 146 |
| Reference Sun | 6 | 94 | 4.2 | 65 | 0.32 | 0.54 | 312 | 20280 | 168 |
UVB and UVA irradiances were measured as described in Methods and integrated over 290-320 and 320-400 nm ranges, respectively, and are expressed in Watts per m2. To obtain erythemogenic and melanogenic outputs, the spectral irradiances (290-400 nm) were wavelength-weighted using the International Commission on Illumination (CIE) Reference action spectrum for erythema (Fig. 1; 16), and the Parrish melanogenesis 2 (Fig. 1) action spectrum, respectively. The “Time of 1st exposure” represents the time needed to deliver the initial dose. This dose equals 100 J/m2, expressed in erythema-effective J/m2. To obtain “UVA dose per 1st exposure”, the UVA output in W/m2 was multiplied by the time required to reach 100 J/m2. To obtain “Melanogenic dose per 1st exposure”, the melanogenic output in W/m2-eff was multiplied by the time required to reach 100 J/m2.
Study Subjects
The age, sex, skin phototype, minimal erythema dose (MED), and minimal melanogenic dose (MMD) for all study subjects are listed in Table II. The phototype of study subjects was determined according to Fitzpatrick 23. When subjects did not exactly fit the criteria of phototype 2 or 3, intermediate values, e.g. 2.5 and 3.5 were used. Only skin phototypes 2 to 3.5 were enrolled. The age of the 40 subjects was 35.5±6.7 years (median ± standard deviation). They were divided into two groups (1 and 2), and each group was treated with a different source (see above). In group 1, there were 13 females and 8 males, while in group 2 there were 11 females and 8 males. The MEDs of the subjects ranged from 170 - 615 J/m2 and did not correlate well with skin phototype (Table II). The MMD ranged from 285 to > 760 J/m2 and, in all but one case (T50, phototype 3.5) the MMD was higher than the MED.
Table II.
Study subjects and their basic characteristics.
| Subject # | Age (years) | Sex | Phototype | MED (J/m2- ery eff) |
MMD (J/m2- ery eff) |
|
|---|---|---|---|---|---|---|
| Source 1 | n = 21 | |||||
| T7 | 32 | F | 2 | 385 | 435 | |
| T8 | 40 | F | 2 | 205 | 330 | |
| T9 | 33 | M | 2.5 | 185 | 415 | |
| T10 | 28 | F | 2.5 | 330 | >430 | |
| T11 | 23 | F | 2.5 | 345 | >520 | |
| T12 | 24 | M | 2.5 | 285 | >420 | |
| T13 | 50 | F | 3.5 | 355 | >540 | |
| T14 | 40 | M | 3 | 170 | 285 | |
| T16 | 45 | M | 2.5 | 335 | 390 | |
| T17 | 38 | F | 2.5 | 330 | 465 | |
| T18 | 36 | F | 2.5 | 290 | >435 | |
| T19 | 34 | M | 2 | 195 | 320 | |
| T20 | 30 | F | 3 | 185 | 370 | |
| T21 | 38 | F | 2.5 | 320 | >480 | |
| T22 | 24 | M | 2.5 | 330 | >490 | |
| T24 | 22 | F | 3 | 615 | >760 | |
| T25 | 29 | M | 2.5 | 200 | 300 | |
| T26 | 26 | F | 2.5 | 295 | >445 | |
| T27 | 41 | F | 3.5 | 220 | 435 | |
| T28 | 31 | M | 2.5 | 210 | 360 | |
| T30 | 27 | F | 2 | 225 | 350 | |
| Source 2 | n = 19 | |||||
| T31 | 41 | M | 2.5 | 250 | 315 | |
| T32 | 26 | M | 2 | 300 | 450 | |
| T33 | 28 | F | 3 | 225 | 375 | |
| T35 | 26 | F | 3 | 450 | >675 | |
| T36 | 32 | M | 2 | 190 | 315 | |
| T37 | 57 | M | 3 | 300 | 450 | |
| T38 | 39 | M | 2.5 | 250 | 375 | |
| T40 | 34 | F | 2.5 | 315 | 440 | |
| T41 | 62 | F | 3 | 450 | 675 | |
| T42 | 24 | F | 2 | 300 | 400 | |
| T43 | 35 | M | 2.5 | 300 | 375 | |
| T44 | 65 | F | 2.5 | 375 | 525 | |
| T45 | 25 | F | 2.5 | 225 | 375 | |
| T47 | 47 | M | 3 | 200 | 400 | |
| T48 | 47 | M | 2.5 | 375 | 450 | |
| T49 | 45 | F | 2.5 | 250 | 375 | |
| T50 | 35 | F | 3.5 | 300 | 300 | |
| T51 | 29 | F | 3.5 | 300 | 375 | |
| T52 | 33 | F | 3.5 | 225 | 450 | |
MED, minimal erythema dose; MMD, minimal melanogenic dose. Cases where the MMD was not found at the maximum dose given are indicated using the “>” sign.
Pigmentation development – photographic documentation and visual observations
The photographic series in Figure 3 shows an example of the gradual development of pigmentation. Overall, protocol A produced a light to moderate pigmentation while protocols B and C led to a dark pigmentation by Day 24. Importantly, from that day onward there was little difference between the effects of protocols B and C indicating saturation of visible pigmentation with Protocol B. According to protocol C, additional exposures were given on days 26 and 30. However, these exposures produced little further darkening of the skin as seen by eye. The observations were continued after the final exposures ceased for an additional 3 weeks with protocols A and B, and for an additional 2 weeks with protocol C. During that time, the pigmentation levels in all study areas barely decreased by visual assessment.
Figure 3.

An example of pigmentation development (subject T13.) The 3×3-cm areas exposed according to protocols A, B, and C, and of the unexposed control X are marked on the image taken before exposures (Day 1). The last exposures in protocols A and B occurred on day 23 and in protocol C on day 30.
Pigmentation development - quantification
To monitor pigmentation development, we used five approaches (see Figure 4) as described in the Methods: (a) visual semi-quantitative assessment of pigmentation using a grading scale, (b) reflectance spectrometry at three wavelengths to obtain Melanin Index 24, and diffuse reflectance spectrometry across the visible range with the capacity to obtain (c) ΔL*, (d) ΔE, and (e) individual typology angle (ΔITA°) parameters from the CIE L*a*b* color system 18;25.
Figure 4.
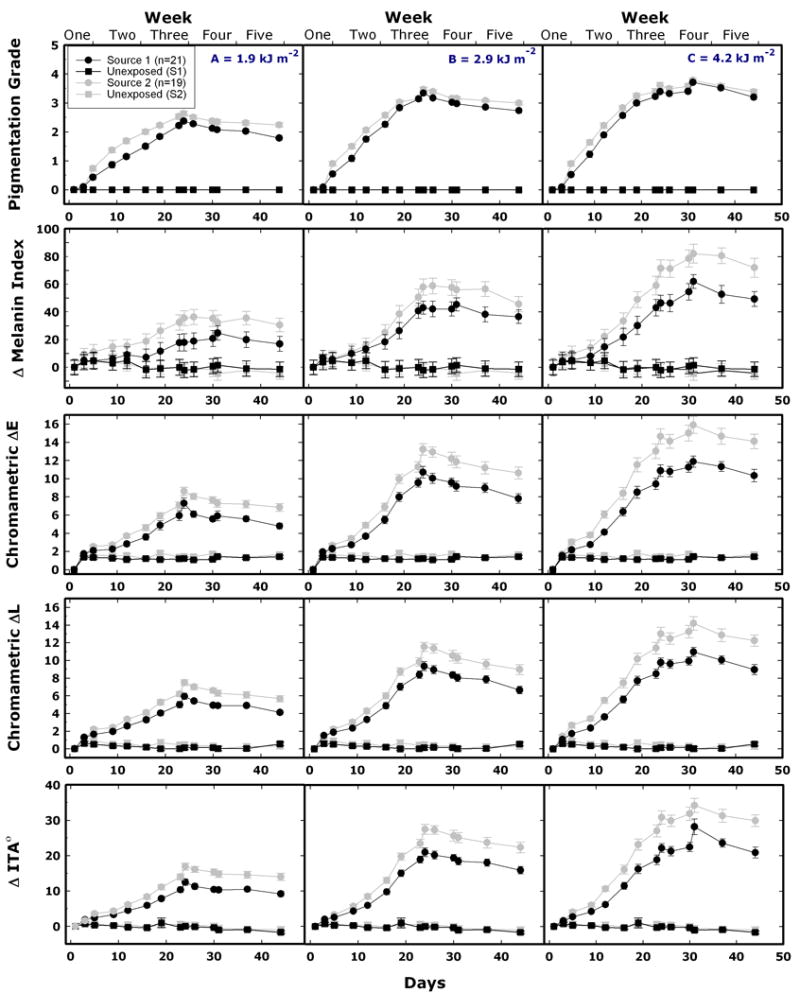
Skin color changes during and after repeated UV exposures according to protocols A (left column), B (center column), and C (right column). Data points and lines are in black and grey for Sources 1 and 2, respectively. First row: results of visual grading (see Material and Methods; mean values, SEM bars are smaller than the data points). Second row: Melanin Index measured with the DiaStron Eythema/Melanin Index Meter. Third-fifth rows: ΔE, ΔL, and ΔITA°, derived from the spectrophotometric measurements. Second-fifth row: mean values ± SEM. The last exposures were given on day 23 in protocols A and B, and on day 30 in protocol C. ITA°, individual typology angle.
For protocol A, (Figure 4, first row), the maximum mean pigmentation grade did not reach a value of 3 (moderately brown) at any time throughout the experiment, for either UV source. Using protocol B, a grade 3 pigmentation was achieved by day 23 for both UV sources, and using protocol C, this pigmentation level could be achieved by day 19 for both UV sources. Using protocol C, some, but not all, subjects reached a pigmentation grade of 4 (dark brown) for both UV sources. Protocols B and C produced very similar final results for both sources, the least squares mean for protocol B and C, were 3.3 and 3.7 for Source 1, and 3.5 and 3.8 for Source 2, respectively.
Instrumental measurements showed that the maximum pigmentation was achieved on day 24 for protocols A and B, and day 31 for protocol C. At days 24 and 31, the least square means for protocols A, B and C, for ΔMI, ΔE, ΔL*, and ΔITA and both sources, were statistically significantly different (p<0.01). The one exception was for protocols B and C, with dependent variables (ΔE and ΔL*) and Source 1, which were not statistically significantly different (p>0.2). Source 2 showed higher and more rapid melanogenic effectiveness than Source 1 (p < 0.005).
We used a statistical software package (SAS PROC MIXED) to model the following parameters: ΔMelanin Index, ΔITA°, and Chromametric ΔE and ΔL*. Separately, the potential independent variables Sex and Phototype were not statistically significantly different from zero (p > 0.06). However, we found that all of the dependent variables (ΔMI, ΔE, ΔL*, and ΔE) depended on MED (p< 0.04).
Erythemal component of the pigmentation
No significant erythema was visible during the pigmentation development for most subjects. However, instrumental measurements detected increases in the a* parameter of the CIE L*a*b* system and in the Erythema Index measured using the DiaStron Meter. Figure 5 shows that for Source 1, the maximum mean Δa* reached a value of ca. 3 for Protocol A and ca. 4.3 for protocols B and C. With Source 2, these values were slightly higher; 3.5, 5.3, and 5.6 for protocols A, B, and C, respectively. These maximum values were recorded on days 24 and 31, which were the only two instances when measurements were made 24 hr after exposure. The changes in Erythema Index (EI) were similar to the changes in the a* parameter.
Figure 5.
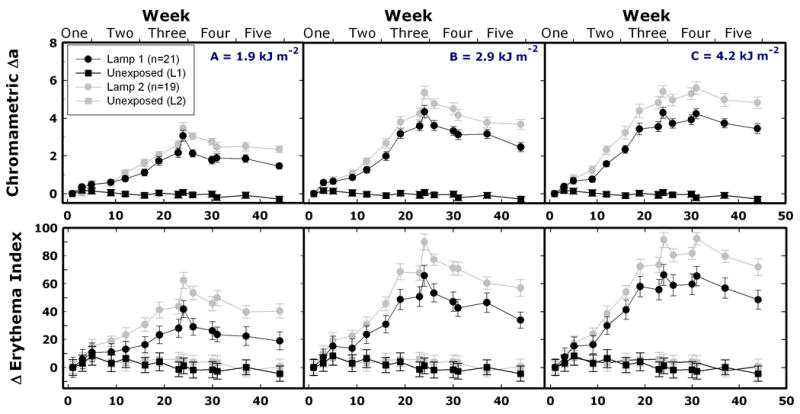
Changes in erythema-related parameters during and after repeated UV exposures according to protocols A (left column), B (center column), and C (right column). Data points (mean values ± SEM) and lines are in black and grey for Source 1 and Source 2, respectively. Top row: chromametric Δa*. Bottom row: ΔErythema Index measured with the DiaStron Eythema/Melanin Index Meter. The last exposures were given on day 23 in protocols A and B, and on day 30 in protocol C.
Discussion
Different approaches were used in the few prior studies of the melanogenic efficacy of repeated UV exposures. Ruegemer et al.9 found that doses of 1.13 or 1.46 J/cm2, 2 ×/wk for 6 weeks, were insufficient to induce significant increases in pigmentation. Bech-Thomsen and co-workers 5 used 2 ‘UVB’ and 4 ‘UVA’ lamps to administer 10 doses of 234 J/m2 (eryth. eff.) over 4 weeks, cumulatively 2340 J/m2. No tan was produced with the UVB-rich sources, but the UVA-rich sources enhanced pigmentation. Seite et al.6 induced a strong pigmentation with UVA (330 – 400 nm) exposures 3 ×/wk for 13 weeks using increasing doses.
Caswell 10 evaluated pigmentation development in phototype 3 and 4 subjects exposed 24× over 8 wks using a protocol based on the FDA guidance for tanning equipment manufacturers 11. The doses were increased significantly each week, and the cumulative doses were 9240 and 9438 J/m2 for phototype 3 and 4, respectively. Table III provides details and shows that such a protocol produced a ΔE of 11.5 CU. Our protocols were similar to those used in phototherapy, i.e. starting with a sub-erythemal dose and increasing each subsequent dose by 25 – 50%. Table III shows that protocol C (cumulative dose 4200 J/m2) led to ΔE increases of 11.9 and 15.9 CU for source 1 and 2, respectively. Note that our cumulative doses were a factor of 2 to 3 lower than those in 10.
Table III.
UV doses and mean ΔE in the three experimental protocols compared to the data of Caswell 10.
| Week | Number of Exposures | Doses, J/m2 - ery eff | Cumulative Dose, J/m2 - ery eff | ΔE for Source 1 | ΔE for Source 2 |
|---|---|---|---|---|---|
| Protocol A | |||||
| 1 | 3 | 100-160 | 390 | 2.1 | 2.5 |
| 2 | 2 | 200-250 | 840 | 2.8 | 3.7 |
| 3 | 2 | 300-380 | 1520 | 4.9 | 5.9 |
| 4 | 1 | 380 | 1900 | 6.1 | 8 |
| 5 | 5.9 | 7.3 | |||
| 6 | 5.6 | 7.2 | |||
| 7 | 4.8 | 6.8 | |||
| 8 | |||||
| Protocol B | |||||
| 1 | 3 | 100-200 | 440 | 2.3 | 2.7 |
| 2 | 2 | 280-400 | 1120 | 3.7 | 4.9 |
| 3 | 2 | 560-600 | 2280 | 8 | 10 |
| 4 | 1 | 600 | 2900 | 10 | 12.9 |
| 5 | 9.2 | 11.9 | |||
| 6 | 9 | 11.2 | |||
| 7 | 7.8 | 10.6 | |||
| 8 | |||||
| Protocol C | |||||
| 1 | 3 | 100-230 | 480 | 2.2 | 3 |
| 2 | 2 | 340-500 | 1320 | 4.1 | 6.1 |
| 3 | 2 | 600 | 2520 | 8.5 | 11.5 |
| 4 | 2 | 600 | 3720 | 10.8 | 14.1 |
| 5 | 1 | 500 | 4200 | 11.9 | 15.9 |
| 6 | 11.3 | 14.7 | |||
| 7 | 10.3 | 14.1 | |||
| 8 | |||||
| Caswell | ΔE at end of week | ||||
| 1 | 3 | 66 | 198 | 2 | |
| 2 | 3 | 154 | 660 | 2.7 | |
| 3 | 3 | 330 | 1650 | 4 | |
| 4 | 3 | 440 | 2970 | 6.8 | |
| 5 | 3 | 440 | 4290 | 8.5 | |
| 6 | 3 | 550 | 5940 | 9 | |
| 7 | 3 | 550 | 7590 | 10.7 | |
| 8 | 3 | 550 | 9240 | 11.5 | |
We previously found that one-per-week exposures were ineffective (ΔE of 2.7 CU 12.) Twice-per-week exposures up to 380 J/m2 produced light to moderate pigmentation. It appears that full activation of melanogenesis requires ≥ 2 exposures (to > 380 J/m2) per week. In this study, we saw significant differences between the effects of protocols A and B, and those of protocols A and C, but not those of protocols B and C, for both lamps. This result was confirmed in the analysis of melanin content from the biopsies as well 13.This occurred despite the fact that protocol C resulted in a 50% higher cumulative dose than did protocol B. Hence, during repetitive UV exposures, melanogenesis may reach a threshold.
Higher UVA/lower UVB output (Table I) led to earlier appearance of new pigmentation and a darker final pigmentation (Figure 4). The melanogenic potential of UVA radiation has been known for a long time 3, nevertheless the significant differences in pigmentation caused by relatively small shifts in the emission spectrum deserve attention. Interestingly, the differences in melanogenic effectiveness of our two UV sources would not be expected based on the melanogenesis action spectrum, since the melanogenic-weighted doses per 100 J/m2 were similar for both sources (Table I). Thus, the UVA dose per unit of erythemal-effective dose may be a better indicator of the melanogenic efficiency than is the melanogenic-weighted dose.
Visually, we observed little redness in study sites repeatedly exposed to UV. However, the erythema-related parameters, Δa* and Erythema Index, increased gradually during repeated exposures (Figure 5). It has been suggested that the specificity of these parameters can be compromised in the presence of pigmentation 26. In addition, the changes in the Δa* parameter reported in this study were similar to those reported in 10.
UV-induced pigmentation of the skin, once established, is relatively stable. Figure 4 shows that the pigmentation did not diminish appreciably for at least 3 weeks after the final exposure (Protocols A and B). In fact, in these two Protocols, the pigmentation diminished by less than 10% between day 23 (when exposures ceased) and day 37 (two weeks later). These observations indicate that once a moderate to dark pigmentation is established, subsequent exposures at two-week intervals are sufficient to maintain pigmentation.
In summary, our observations indicate that for repetitive UV exposures of skin phototypes 2 and 3: (1) dependence of UV-induced pigmentation on cumulative dose reaches a threshold; increasing the dose above this threshold causes little or no additional pigmentation, and (2) once established, pigmentation of the skin is relatively stable, and (3) the efficiency of the melanogenic process can be markedly enhanced by selection of scientifically-based values of dose per exposure, exposure frequency and UV spectrum.
Acknowledgments
This research was supported by the U.S. FDA Office of Women's Health, and in part by the Intramural Research Program of the National Cancer Institute, National Institute of Health. The authors wish to express their sincere appreciation to Dr. Katalin S. Korossey for her dermatological support and numerous valuable suggestions, and to Judith Kniskern, RN for her excellent handling of the human subjects and records.
Footnotes
Conflict of Interest: The authors state no conflict of interest.
Disclaimer: The mention of commercial products, their sources, or their use in connection with material reported herein is not to be construed as either an actual or implied endorsement of such products by the U.S. Department of Health and Human Services.
Contributor Information
S. A. Miller, Center for Devices and Radiological Health, Food and Drug Administration, Silver Spring, MD 20993 USA
S. G. Coelho, Laboratory of Cell Biology, National Cancer Institute, National Institute of Health, Bethesda, MD 20852 USA
B. Z. Zmudzka, Center for Devices and Radiological Health, Food and Drug Administration, Silver Spring, MD 20993 USA
H. F. Bushar, Center for Devices and Radiological Health, Food and Drug Administration, Silver Spring, MD 20993 USA
Y. Yamaguchi, Laboratory of Cell Biology, National Cancer Institute, National Institute of Health, Bethesda, MD 20852 USA
V. J. Hearing, Laboratory of Cell Biology, National Cancer Institute, National Institute of Health, Bethesda, MD 20852 USA
J. Z. Beer, Center for Devices and Radiological Health, Food and Drug Administration, Silver Spring, MD 20993 USA
References
- 1.Parrish JA, Zaynoun S, Anderson RR. Cumulative effects of repeated subthreshold doses of ultraviolet radiation. Journal of Investigative Dermatology. 1981;76:356–8. doi: 10.1111/1523-1747.ep12520019. [DOI] [PubMed] [Google Scholar]
- 2.Parrish JA, Jaenicke KF, Anderson RR. Erythema and melanogenesis action spectra of normal human skin. Photochemistry and Photobiology. 1982;36:187–91. doi: 10.1111/j.1751-1097.1982.tb04362.x. [DOI] [PubMed] [Google Scholar]
- 3.Pathak M, Fanselow DL. Photobiology of melanin pigmentation: Dose/response of skin to sunlight and its contents. Journal of the American Academy of Dermatology. 1983;9:724–33. doi: 10.1016/s0190-9622(83)70186-6. [DOI] [PubMed] [Google Scholar]
- 4.Kaidbey KH, Kligman AM. Cumulative effects from repeated exposures to ultraviolet radiation. Journal of Investigative Dermatology. 1981;76:352–356. doi: 10.1111/1523-1747.ep12520007. [DOI] [PubMed] [Google Scholar]
- 5.Bech-Thomsen N, Ravnborg L, Wulf HC. A Quantitative Study Of The Melanogenic Effect Of Multiple Suberythemal Doses Of Different Ultraviolet Radiation Sources. Photodermatology Photoimmunology and Photomedicine. 1994;10:53–6. [PubMed] [Google Scholar]
- 6.Seite S, Moyal D, Richard S, et al. Effects of Repeated Suerythemal Doses of UVA in Human Skin. European Journal of Dermatology. 1997;7:204–9. [Google Scholar]
- 7.Ravnbak MH, Wulf HC. Pigmentation after single and multiple UV-exposures depending on UV-spectrum. Arch Dermatol Res. 2007;299:25–32. doi: 10.1007/s00403-006-0728-3. [DOI] [PubMed] [Google Scholar]
- 8.de Winter S, Vink AA, Roza L, et al. Solar-Simulated Skin Adaptation And Its Effect On Subsequent UV-Induced Epidermal DNA Damage. Journal of Investigative Dermatology. 2001;117:678–82. doi: 10.1046/j.0022-202x.2001.01478.x. [DOI] [PubMed] [Google Scholar]
- 9.Ruegemer J, Schuetz B, Hermann K, et al. UV-induced skin changes due to regular use of commercial sunbeds. Photodermatol Photoimmunol Photomed. 2002;18:223–7. doi: 10.1034/j.1600-0781.2002.180501.x. [DOI] [PubMed] [Google Scholar]
- 10.Caswell M. The Kinetics Of The Tanning Response To Tanning Bed Exposures. Photodermatology Photoimmunology and Photomedicine. 2000;16:10–4. doi: 10.1034/j.1600-0781.2000.160104.x. [DOI] [PubMed] [Google Scholar]
- 11.US Food and Drug Administration. Food and Drug Administration, Center for Devices and Radiological Health. Department of Health and Human Services; Rockville, MD: Aug 21, 1986. Policy on maximum timer interval and exposure schedule for sunlamps. [Google Scholar]
- 12.Miller SA, Coelho SG, Zmudzka BZ, et al. Reduction of the UV burden to indoor tanners through new exposure schedules: a pilot study. Photodermatol Photoimmunol Photomed. 2006;22:59–66. doi: 10.1111/j.1600-0781.2006.00206.x. [DOI] [PubMed] [Google Scholar]
- 13.Yamaguchi Y, Coelho SG, Zmudzka BZ, et al. Cyclobutane pyrimidine dimer formation and p53 production in human skin after repeated UV irradiation. Exp Dermatol. 2008;17:916–24. doi: 10.1111/j.1600-0625.2008.00722.x. [DOI] [PubMed] [Google Scholar]
- 14.Coelho SG, Miller SA, Zmudzka BZ, et al. Quantification of UV-induced erythema and pigmentation using computer-assisted digital image evaluation. Photochem Photobiol. 2006;82:651–5. doi: 10.1562/2005-08-02-TSN-635. [DOI] [PubMed] [Google Scholar]
- 15.Tadokoro T, Yamaguchi Y, Batzer J, et al. Mechanisms of skin tanning in different racial/ethnic groups in response to ultraviolet radiation. J Invest Dermatol. 2005;124:1326–32. doi: 10.1111/j.0022-202X.2005.23760.x. [DOI] [PubMed] [Google Scholar]
- 16.CIE Standard S 007/E-1998. Erythema Reference Action Spectrum and Standard Erythema Dose. ISO. Vienna, Austria: 1999. p. 17166. [Google Scholar]
- 17.Fullerton A, Fischer T, Lahti A, et al. Guidelines For Measurement Of Skin Colour And Erythema. A Report From The Standardization Group Of The European Society Of Contact Dermatitis. Contact Dermatitis. 1996;35:1–10. doi: 10.1111/j.1600-0536.1996.tb02258.x. [DOI] [PubMed] [Google Scholar]
- 18.Chardon A, Cretois I, Hourseau C. Skin colour typology and suntanning pathways. Int J Cosmet Sci. 1991;13:191–208. [Google Scholar]
- 19.Del BS, Sok J, Bessac E, et al. Relationship between skin response to ultraviolet exposure and skin color type. Pigment Cell Res. 2006;19:606–14. doi: 10.1111/j.1600-0749.2006.00338.x. [DOI] [PubMed] [Google Scholar]
- 20.Jo SJ, Yoon HS, Woo SM, et al. Time course of tanning induced by narrow-band UVB phototherapy in Korean psoriasis patients. Photodermatol Photoimmunol Photomed. 2006;22:193–9. doi: 10.1111/j.1600-0781.2006.00228.x. [DOI] [PubMed] [Google Scholar]
- 21.Park SB, Huh CH, Choe YB, et al. Time Course Of Ultraviolet-Induced Skin Reactions Evaluated By Two Different Reflectance Spectrophotometers: DermaSpectrophotometer and Minolta Spectrophotometer CM-2002. Photodermatology, Photoimmunology and Photomedicine. 2002;18:23–8. doi: 10.1034/j.1600-0781.2002.180104.x. [DOI] [PubMed] [Google Scholar]
- 22.Commision Internationale de l'Eclairage (CIE) Central Bureau. Vienna, Austria: 1989. CIE Technical Committee 2-17. CIE Technical Report N° CIE 85, Solar Spectral Irradiance. [Google Scholar]
- 23.Fitzpatrick TB. Arch Dermatol. Vol. 124. 1988. The validity and practicality of sun-reactive skin types I though VI; pp. 869–71. [DOI] [PubMed] [Google Scholar]
- 24.Diffey BL, Robson J. The influence of pigmentation and illumination on the perception of erythema. Photodermatol Photoimmunol Photomed. 1992;9:45–7. [PubMed] [Google Scholar]
- 25.Weatherall IL, Coombs BD. Skin color measurements in terms of CIELAB color space values. J Invest Dermatol. 1992;99:468–73. doi: 10.1111/1523-1747.ep12616156. [DOI] [PubMed] [Google Scholar]
- 26.Alaluf S, Atkins D, Barrett K, et al. The impact of epidermal melanin on objective measurements of human skin colour. Pigment Cell Res. 2002;15:119–26. doi: 10.1034/j.1600-0749.2002.1o072.x. [DOI] [PubMed] [Google Scholar]