Abstract
Purpose: Angiographic contrast that is routinely injected into arteries is used not only to evaluate arterial geometry but also in many cases to assess perfusion. The authors conducted two experiments to examine the dispersion of angiographic contrast injected antegradely into an artery under conditions similar to those found in selective (carotid artery) or superselective (circle of Willis) angiography in order to determine the distance from the catheter tip at which the contrast can be considered fully mixed with the blood. A third experiment investigated whether the contrast once mixed with blood will separate from the mixture under the gravitational field due to a density mismatch.
Methods: Experiment I—Under high-speed angiographic acquisition, a bolus of contrast was injected through a catheter along the flow direction of a blood analog fluid flowing through a straight, long, cylindrical tube. The variation in grayscale intensity along the length of the tube was acquired and modeled as the step response to a second-order system. The distance from the catheter tip at which the contrast mixes with the working fluid, the mixing length, was determined as the length along the tube after which the step response settles to within 3% of the steady state value. Experiment II—A bolus of angiographic contrast was injected at rates varying from 0.1 to 1 cc∕s through three different catheter sizes in the left common carotid artery of three rabbits. The average cross-sectional grayscale intensity over one cardiac cycle was calculated at four locations along the artery: Immediately distal to the catheter tip, at location of maximum grayscale intensity, and at 10 and 20 arterial diameters from the catheter tip. The status of mixing within 10 arterial diameters was assessed by differences between the grayscale value at this location and that at the maximum and 20 arterial diameter location. Experiment III—Angiographic contrast was premixed by agitation in three separate vials containing normal saline, canine blood, and glycerol∕distilled-water mixture. The vials were then stationed vertically and angiographic images obtained every 5 min for 1 h. The average intensity of contrast along the vertical length of each vial was obtained for every time point to record any changes in the distribution of contrast over time.
Results: The first experiment shows that angiographic contrast completely mixes with steady flowing blood analog fluid within about eight tube diameters of the injection site. The second experiment shows that contrast completely mixes with blood within ten arterial diameters under appropriate injection parameters. The third experiment shows that angiographic contrast does not separate from, or settle out of, contrast-carrying fluid mixtures for a period of 1 h.
Conclusions: The results demonstrate that under typical injection conditions in the clinical setting, contrast issuing from the catheter completely mixes with the blood within ten artery diameters downstream of the catheter tip. Once mixed, it does not separate from the blood due to gravity.
Keywords: mixing length, second-order step response, ejector effect, contrast settling
INTRODUCTION
In catheter-based angiography transport of contrast can be visualized in real time on modern angiographic systems and the rate of contrast washout from various regions of interest has been routinely used to estimate the rate of blood flow for both diagnostic and therapeutic decision makings.1, 2 Nevertheless, it is difficult to obtain accurate estimates of blood flow or blood flow velocity since the dispersive transport of the contrast in flowing blood is highly nonlinear. The process of dispersion is more sophisticated as compared to the commonly understood process of diffusion because it involves a combined action of nonuniform velocity and molecular diffusion whereby a solute spreads in a flowing solvent from high concentration to low concentration regions. Dispersion is largely independent of molecular weights or chemistry but is rather dependent on position, having different values in different directions. The dispersion of angiographic contrast in flowing blood is dependent on the rate of contrast injection relative to the rate of blood flow at the injection site, the predominant geometries at the injection site, and the direction of the injection relative to the direction of the flowing blood.3 The transport and mixing processes involved in the space between the site of angiographic contrast injection and the region of interest where the contrast is visually evaluated are, therefore, extremely complex.
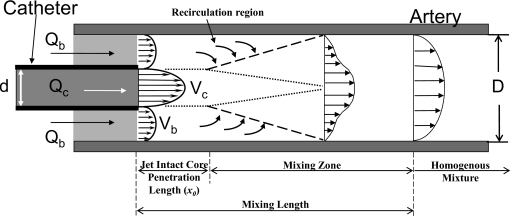
A brief description of the flow dynamics at the injection site and the terms and parameters used in this manuscript may be useful. Figure 1 shows a schematic of the site of antegrade injections into a lumen with coflowing fluid. When a fluid jet discharges into a surrounding fluid, the viscous forces on the surface of the jet tend to drag the surrounding fluid along with the jet in a phenomenon called jet entrainment. Such jet entrainment is used as a pumping mechanism whereby a fluid discharging at high velocities through a nozzle into an ambient fluid is used to pump the ambient fluid. Such pumps are called jet pumps or jet ejector pumps, and thus the phenomenon of increased coflow rates (as compared to preinjection values) during jet injections because of entrainment is also called the ejector effect. During the study of these pumps an important nondimensional fluid dynamics parameter called the Craya-Curtet number (Ct) was developed. A simplified expression (see the Appendix0 for more details on Ct) of this number is related to the ratio of the momentums of the two streams (coflow to jet).4 It was found that below a certain critical value of this number, the coflow is unable to satisfy the entrainment demands of the jet and the jet undergoes flow reversal to maintain the total mass flow rate.5, 6, 7 Then, below this critical value (this value is in a range from about 0.7 to 0.98),5, 6 a recirculation region forms within the lumen. Such a recirculation region would enhance mixing of the two streams and therefore Craya-Curtet numbers higher than this value (Ct>∼1) would mitigate mixing. The Reynolds number (ratio of inertial to viscous effects) is another parameter that influences the fluid dynamics at the injection site while the Womersley number (ratio of pulsatile to viscous effects) may also be important for injections into pulsatile blood flows.
Figure 1.
Schematic of a catheter tip placed concentrically inside an artery. The discharge velocity through the catheter is much higher than the surrounding flow. The high velocity discharge tends to generate an ejector effect whereby the surrounding fluid is entrained into the jet flow enhancing both mixing and flow of the slow moving fluid. Qb and Qc are the flow rates of blood analog fluid and injected contrast, respectively; Vb and Vc are the corresponding velocities; D and d are the inner diameters of the artery and the catheter, respectively. The mixing length is the distance from the catheter tip at which contrast has formed a homogeneous mixture with the surrounding fluid.
In terms of jet injections of angiographic contrast into coflowing blood, there exist three regimes along the arterial lumen (Fig. 1). The first, called the jet intact core penetration length, is the distance from the catheter tip to the point where instabilities begin to form in the jet (this length depends on the Reynolds number of the jet). After this length, instabilities form in the jet with associated recirculation (depending on the Craya-Curtet number of the injection) and the two fluids begin to undergo mixing. The primary mixing region, called the mixing zone here, starts at this point where instabilities begin to form in the jet and ends at some farther distance where the contrast has completely mixed with blood. The total distance from the catheter tip until complete mixture (sum of jet intact core penetration length and mixing zone) is called the mixing length. After the mixing length, therefore, a homogeneous mixture of contrast and blood flows through the artery.
Several studies have investigated angiographic contrast injections,8, 9, 10, 11, 12, 13, 14, 15 but these have largely focused on hemodynamic changes during and after the injection period. To our knowledge no study has attempted to quantify the mixing process of angiographic contrast with blood under injection conditions that are similar to those used in the clinical setting. We limited our study to injections relevant to the cerebral circulation. We conducted three experiments to investigate the mixability of angiographic contrast with blood. First, we investigated the dispersive transport and mixing of contrast material that is injected through a catheter into a flow phantom antegradely into a flowing blood analog fluid. The aim of this experiment was to quantify the mixing length from the tip of the microcatheter to the most distal location in the artery beyond which a homogeneous binary mixture is achieved. Second, we antegradely injected contrast at different injection rates into the common carotid artery of rabbits. The aim of this experiment was to quantitatively assess the mixing lengths in vivo under a range of Craya-Curtet numbers. Third, we investigated whether contrast material that is premixed in a solvent settles under gravity. The aim of this experiment was to evaluate whether a homogeneous binary mixture of angiographic contrast with working fluid remains mixed during angiographic procedures or whether the contrast settles out of the working fluid under the influence of gravity.
METHODS
Experiment I
Setup
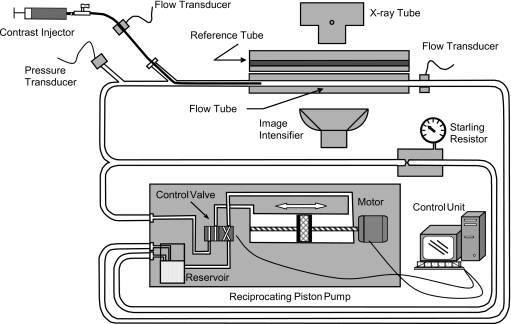
This experiment represents conditions of a selective injection of contrast into the carotid artery or those of a “superselective” angiographic procedure where contrast is injected through a microcatheter into a major branch of the circle of Willis. We injected a bolus of contrast in the flow direction of a blood analog fluid consisting of 40∕60 glycerol∕distilled-water mixture by volume (density of 1.1 g∕cc and viscosity of 3.5 cP) flowing through an experimental phantom with simultaneous high-speed angiographic acquisition as shown schematically in Fig. 2. The injected medium was a mixture of 50% angiographic contrast (Omnipaque® 300 mgI∕ml, GE Healthcare, Piscataway, NJ) and 50% saline by volume and had density and viscosity of about 1.2 g∕cc and 2.2 cP at 23 °C, respectively. Three experiments with different working fluid and∕or contrast injection flow rates were performed (Table 1). The test section consisted of a 140 mm long straight cylindrical tube with a caliber of 6.35 mm connected to a reciprocating piston pump (CompuFlow 1000MR, Shelly Medical Imaging Technology, ON, Canada) that was operating in a steady flow mode. A bypass tube was built into the system that was maintained under a preset pressure of 90 mm Hg by a starling resistor such that flow through it was possible only when the loop pressure exceeded the starling resistor pressure. The bypass tube was designed to restrict working fluid flow through the test section if the local pressure in the phantom during injection exceeds the preset value. A transit time ultrasonic flow meter system (T206, Transonic System Inc., Ithaca, NY) with cannula-type flow probes was used to measure the instantaneous volumetric flow rate through the flow tube and the catheter delivering the contrast. In addition, system pressure was measured upstream of the point of introduction of the catheter into the flow loop. The flow meters and pressure transducer were connected to a data acquisition system consisting of a personal computer equipped with data acquisition board and data acquisition software (VIRTUAL BENCH V2.0, National Instruments Co., Austin, TX).
Figure 2.
Schematic of the experimental flow phantom apparatus.
Table 1.
The flow rates and similarity parameters for experiment I. (Δv: The difference in contrast and working fluid velocities at the catheter exit. Re: Reynolds numbers. Ct: Craya-Curtet number. Flow tube diameter=6.35 mm; catheter inner and outer diameters=2.5 and 3 mm, respectively.)
| Glycerol flow rate (cc∕s) | Contrast flow rate (cc∕s) | Δv (cm∕s) | Re (glycerol) | Re (contrast) | Ct | |
|---|---|---|---|---|---|---|
| Exp I #1 | 7.0 | 8.0 | 135 | 567 | 2271 | 0.38 |
| Exp I #2 | 6.6 | 7.6 | 128 | 535 | 2158 | 0.37 |
| Exp I #3 | 6.6 | 6.9 | 114 | 535 | 1960 | 0.44 |
Contrast was injected into the flow through a 9F catheter (Vista Brite Tip®, Cordis Corporation, Miami lakes, FL, outer diameter 3 mm, inner diameter 2.5 mm) that was inserted into the flow apparatus with its distal tip located in the upstream part of the flow tube. The proximal end of the catheter was connected to a computer controlled microinjector pump developed by our laboratory for a metered contrast injection. The injector is capable of performing double contrast injection with microliter accuracy (0.25 μl) using various selectable injection velocities. A second sealed tube (no flow) of the same dimensions as the flow tube was filled with the same contrast medium that was injected into the flow tube and stacked above the flow tube to obtain the grayscale value of the contrast with no dilution in the working fluid (henceforth called the reference tube). The test section was placed on the angiographic table at the isocenter and high-speed lateral projection angiograms (30 frames∕s, Siemens AngioStar Plus, Siemens Medical Solutions, Erlangen, Germany) were obtained preinjection of the contrast.
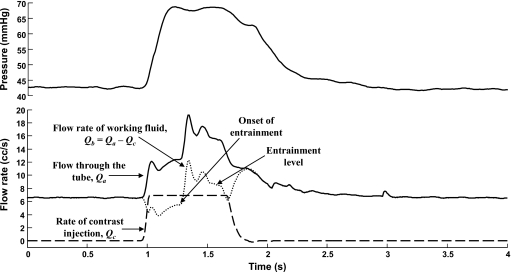
Figure 3 shows the traces of pressure and flow rates measured during one of the experiments. The fluid dynamics similarity parameters for the flow tube and the injection, namely, the Reynolds number (Re) and Craya-Curtet number (Ct), are given in Table 1. Craya-Curtet numbers were calculated for each injection as per the following modified form (see the Appendix0):
| (1) |
where ρb and Qb and ρc and Qc are the densities and mean flow rates of blood and contrast, respectively, IDc and ODc represent the inner and outer diameters of the catheter, and Da is the lumen diameter of the artery.
Figure 3.
Hemodynamic variables in the flow loop during the injection of contrast for one of the experimental cases (Exp I #3). The tube flow rate measured by the flow probe (Qa) is shown as a solid line whereas the injection profile (Qc) is shown as a dashed line. Flow rate of the working fluid only (Qb, dotted line) is obtained by subtracting the injection profile from the tube flow rate. About 0.4 s into the injection, entrainment begins with a large starting transient (onset of entrainment) and eventually stabilizes at a value higher than the preinjection flow rate (entrainment level). After the injection is stopped, the pressure and the flow through the tube decay to preinjection levels.
Image processing and analysis
All image processing and analysis described below were done using MATLAB® (Mathworks Inc., Natick, MA). The variation in contrast intensity along the length of the flow tube during the period of injection was calculated as follows:
-
(a)
After a starting transient the contrast filled the flow tube while being continuously injected. A maximum intensity projection image was calculated from the acquired sequence of images and the tube boundaries were isolated by edge detection of this image.
-
(b)
The tip of the catheter inside the flow tube was set as the origin of the coordinate system with the x axis being along the length of the tubes and the y axis running across the tube cross section. Due to the circularity of the tube, the grayscale variations along the tube cross section (along the y axis) have a parabolic shape profile.
-
(c)
Three images obtained at 0.6, 0.633, and 0.667 s after start of contrast injection, when the flow tube was completely filled with contrast, were chosen for analysis in all three experimental cases.
-
(d)
The average grayscale intensity across the tube diameter was calculated at each pixel (∼0.28 mm) along the x axis for both the flow and reference tubes.
-
(e)
The minimum values of the profiles along the tubes were obtained and a sixth order polynomial fit to these data was used as the variation in background grayscale intensity along the x axis. This background intensity variation was logarithmically subtracted from the intensity variations along the flow and reference tube lengths.
-
(f)
The intensity variation along the length of the tubes is distorted toward the inlet and outlet sections because these regions are at the edges of the image intensifier,1 while there is no or minimal distortion at the middle of the tubes. As the contrast concentration in the reference tube is constant throughout its length, the magnitude of distortion along its length can be calculated as a proportion of the true intensity at the middle of the tube. Similarly, the magnitude of distortion along the x axis was calculated at another constant intensity level (Plexiglas casing of tubes). Sixth order polynomials were fitted to these two data sets to obtain distortion profiles at two different intensity levels. The magnitude of grayscale distortion along the length of the flow tube was then obtained by a linear interpolation between these two distortion profiles. The edge-effect distortion in average grayscale intensity along the length of the flow and reference tubes could then be corrected for with the corresponding distortion profiles.
-
(g)
The ratio of the grayscale intensity variation along the flow tube to the grayscale intensity variation along the corresponding reference tube was used as an indicator of the extent of contrast mixing in the flow tube along the tube length. The mixing zone for each experimental case was identified based on an analysis of this ratio of contrast intensities.
The interaction of the contrast jet with the flowing fluid in the flow tube can be perceived as the step response of a second-order system16 where the input step begins at the location where instabilities start to form in the jet (Fig. 1, also see Figs. 1 and 2 in Ref. 3). The distance from the distal tip of the catheter to the location where the core of the jet breaks up, i.e., the jet intact core penetration length (say, x0), was identified by fitting the following sigmoid function to the ratio of contrast intensities data:
| (2) |
where A, a, n, and τ are constants. The point of significant rise of the optimized function, which is based on the maximum value of the second derivative of the function, determined the value of x0. As the step input begins at x0, the data points distal to this location were selected and fitted to the following step response function:
| (3) |
where ωn and ζ are the undamped natural frequency and damping ratio of the system, respectively, and K, C, and θ are constants. Both the sigmoid function and the step response function were fitted to the data by minimizing the sum of the squared differences between the data and the function. Equation 3 is the general solution to the second-order system
| (4) |
where u is the input. As the forcing function (step) starts at x0, the output before this location can be considered to be the free response of the second-order system. The data points before x0 were therefore fitted with the homogeneous solution of Eq. 4. The values and slopes of the free and forced responses were matched at the point x0. The mixing length in each case was identified as the length along the tube after which the step response settles to within 3% of the steady state value. Then, the mixing zone could also be quantified as it lies between the jet intact core penetration length and the mixing length.
Experiment II
Setup
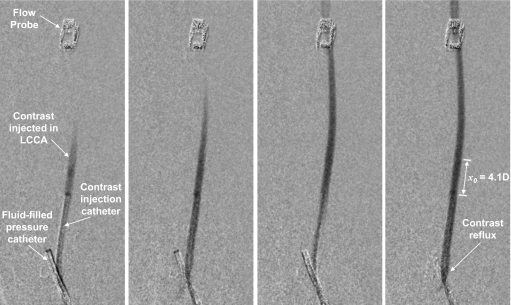
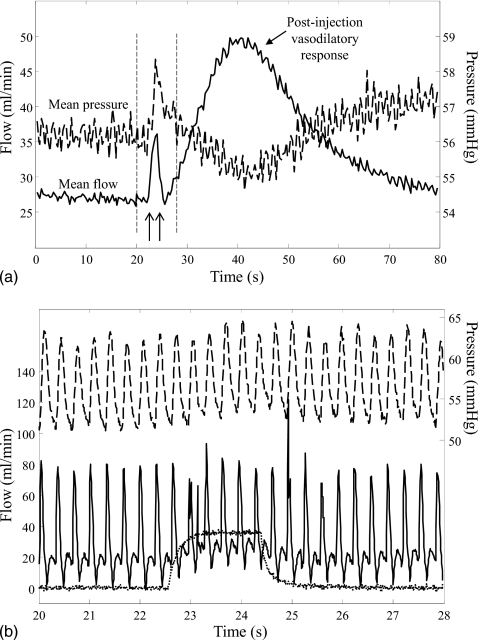
Experiments were carried out with the approval of our institution’s Animal Care and Use Committee. Three adult male white New Zealand rabbits (3–4 kg) were sedated with xylazine and ketamine and maintained under 1%–2% isoflurane. The left common carotid artery (LCCA) was exposed and an electromagnetic flow probe was placed around the artery at approximately 5–6 cm distal to the artery origin. A 4F saline-filled catheter with five side holes was advanced into the innominate artery via the right femoral artery and connected to a pressure transducer for recording arterial pressure. The left femoral artery was accessed and the catheter used for contrast injection was positioned in the LCCA (Fig. 4). A diagnostic angiogram was performed to ensure that there were no arterial branches emanating from the region of interest section of the LCCA between the catheter tip and the flow probe. If present, such branches were ligated. A volume mixture of 50% Omnipaque® and 50% saline was injected at nominal rates ranging from 0.1 to 1 cc∕s for 2 s using the custom-made injection pump mentioned previously. Each injection was spaced by a period of approximately 10 min. The density and viscosity of this injectate were about 1.2 g∕cc and 2.2 cP at 23 °C, respectively. High-speed (30 frames∕s) angiographic images were recorded during contrast injection. Image acquisition was not gated to the cardiac cycle of the animal. Five to six injections were made using the same catheter in each animal, but three different catheters were used in the three animals. Catheters were chosen to simulate injections through small, intermediate, and large catheter diameters relative to the artery diameter. Table 2 lists the catheters and nominal injection flow rates used in the experiment along with the hemodynamics parameters before injection and the Craya-Curtet numbers. Table 2 also lists whether any retrograde flow of contrast (reflux) was visualized during each injection; Fig. 4 shows an example of such reflux. Actual injection rates were measured by a flow transducer connected to the proximal end of the injection catheter. Recordings of injection flow rate, arterial pressure, and arterial flow rate were simultaneously collected for 1–1.5 min around the injection period on a PC using LABVIEW software. The cardiac cycles in the arterial pressure and flow rate recordings were identified using a method described previously17 to calculate the traces of mean pressures and flow rates. Figure 5 shows the flow and pressure recordings from one case as an example. The postinjection increase in flow is a vasodilatory response that was in all cases similar in magnitude and time period to previous studies that have studied this phenomenon in detail.9, 10, 11, 15
Figure 4.
Subtracted angiograms showing contrast injection in the LCCA for one case of rabbit 1. The four images were acquired at the start of injection and span the duration of about one cardiac cycle. The leftmost image shows pressure catheter in innominate artery and electromagnetic flow probe on distal LCCA. Contrast reflux can be observed in the rightmost image; also shown is the jet intact core penetration distance (x0) for this injection.
Table 2.
Parameters governing angiographic contrast injections and visualization of contrast reflux for experiment II. Reynolds and Womersley numbers for blood flow over all cases were 84±20 and 3±0.1, respectively. Reynolds numbers for the contrast injections ranged from about 70 to 1300. (IDc: Inner diameter of catheter. ODc: Outer diameter of catheter. Da: Lumen diameter of artery. Qb: Mean blood flow rate before injection. Qc: Nominal injection rate. Δv: Velocity mismatch between contrast jet and coflowing blood. Ct: Craya-Curtet number. Reflux: Whether contrast reflux was visualized during injection.)
| Rabbit No. | Catheter and artery diameters | Qb (cc∕s) | Qc (cc∕s) | Δv (cm∕s) | Ct | Reflux |
|---|---|---|---|---|---|---|
| 1 | IDc=1 mm, ODc=1.33 mm, Da=2.24 mm | 0.39 | 0.10 | 0.43 | 1.97 | No |
| 0.44 | 0.25 | 17.71 | 0.91 | No | ||
| 0.44 | 0.50 | 49.64 | 0.45 | Yes | ||
| 0.33 | 0.75 | 85.06 | 0.22 | Yes | ||
| 0.29 | 1.00 | 118.20 | 0.15 | Yes | ||
| 2 | IDc=0.53 mm, ODc=0.87 mm, Da=2.35 mm | 0.57 | 0.10 | 31.69 | 1.27 | No |
| 0.50 | 0.20 | 78.06 | 0.56 | Yes | ||
| 0.44 | 0.40 | 168.90 | 0.25 | Yes | ||
| 0.45 | 0.60 | 258.10 | 0.17 | Yes | ||
| 0.40 | 0.80 | 348.69 | 0.11 | Yes | ||
| 0.41 | 1.00 | 438.01 | 0.09 | Yes | ||
| 3 | IDc=0.43 mm, ODc=0.63 mm, Da=2.42 mm | 0.50 | 0.10 | 57.53 | 0.84 | Yes |
| 0.41 | 0.20 | 127.77 | 0.35 | Yes | ||
| 0.35 | 0.40 | 265.58 | 0.15 | Yes | ||
| 0.33 | 0.60 | 402.59 | 0.09 | Yes | ||
| 0.35 | 0.75 | 504.59 | 0.08 | Yes |
Figure 5.
Recorded flow and pressure traces for one case from experiment II, rabbit 2; nominal contrast injection rate of 0.6 cc∕s. Panel (A) shows the cardiac average flow (solid line) and cardiac average pressure (dashed line) over a 80 s acquisition period; arrows indicate start and stop of contrast injection. A vasodilatory response followed most injections. Vertical dashed lines indicate the time window showing in panel (B). Panel (B) shows the pulsatile flow (solid line) and pulsatile pressure (dashed line) recorded during contrast injection (dotted line).
Image processing and analysis
The angiographic sequences were logarithmically subtracted to remove background information. A maximum intensity projection image was constructed from the angiographic sequence acquired during the highest rate of contrast injection (maximal artery opacification) in each animal. The centerline and boundaries of the LCCA were then detected based on this image and used for analysis of all injection rates in that animal. Image analysis for each case was performed on a set of images (eight to ten images) corresponding to one cardiac cycle. The set of images was chosen after 1 s from start of contrast visualization in the artery. In each image, the extent of contrast mixing at any location along the artery length was quantified by the average cross-sectional grayscale intensity (ACGI) across the artery diameter in a direction perpendicular to the centerline at that location. ACGI values were calculated at four separate locations along the artery: Immediately distal to the catheter tip, at the jet intact core penetration length, and at 10 and 20 artery diameters (D) distal to the catheter tip. If the flow probe was less than 20D from the catheter tip, the ACGI was calculated at the point just proximal to the probe. The jet intact core penetration length (x0) for each injection was identified as the arterial distance from the catheter tip where the ACGI reaches its minimum (corresponding to maximum contrast concentration). The variation in ACGI with arterial length for 20 arterial diameters and with time for one cardiac period was thus calculated for each injection in each animal. To allow for intra-animal comparisons, ACGI values were normalized (NACGI) to the maximum ACGI over all injections in the animal. The extent of mixing at different arterial locations was calculated by comparing corresponding mean NACGI values with Student’s t test.
Experiment III
Setup
A small quantity (0.25 ml) of a 50∕50 mixture by volume of Omnipaque® and saline was injected into each of three vials filled with 5 ml of normal saline, canine blood, or glycerol∕distilled-water mixture.18 All fluids were at room temperature. The densities of the contrast medium and glycerol water mixture were about 1.2 and 1.1 g∕cc, respectively; densities of saline and blood can be assumed to be 1 and 1.06 g∕cc, respectively. The inner diameter of each vial was 10.49 mm and each vial was 70.30 mm long. The contrast added to each vial was mixed with the fluid in the vial by agitation. The vials were then placed vertically on the imaging table and angiographic images were obtained every 5 min for 1 h.
Image processing and analysis
Temporal changes in the spatial distribution of contrast within each carrying fluid were calculated from the angiographic images. Horizontal layers in the vial were defined by rows one pixel thick (∼0.14 mm). The average grayscale intensity of each horizontal layer was obtained to yield the average grayscale distribution along the vertical axis of the vial. This average intensity of contrast along the length of each vial was obtained for every time point to record any changes in the distribution of contrast that may occur over time if the contrast settled out of the fluid due to gravity.
RESULTS
Experiment I
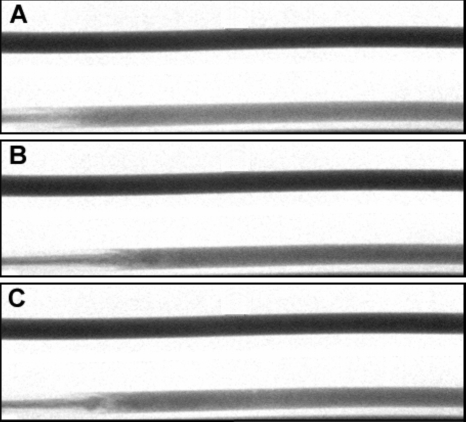
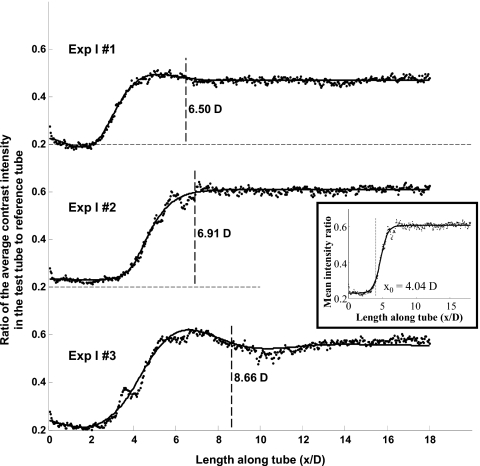
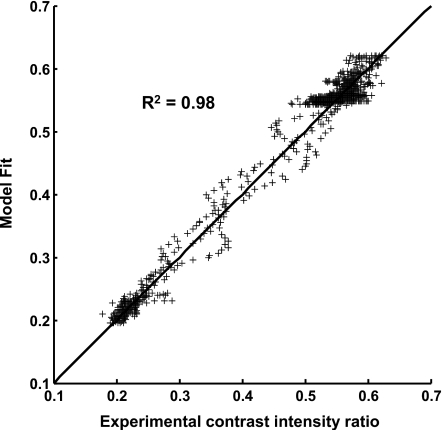
Images of the flow tubes at 0.633 s from start of injection along with the corresponding reference tubes for each of the three experiments are shown in Fig. 6 after digital subtraction of the background. Figure 7 shows the fit of the step response functions to the data obtained at 0.633 s from start of injection for each of the three experimental cases. The inset in Fig. 7 shows the fit of the sigmoid function to the data for the case Exp I #2 along with the obtained jet intact core penetration length (x0). The goodness of fit of the model for the three images (0.6–0.67 s from start of injection) from case Exp I #3 is shown in Fig. 8. The coefficients of determination for the other two cases (Exp I #1 and Exp I #2) were both 0.99. The mean and standard deviation over the three images of the optimized model parameters, jet intact core penetration lengths, and the mixing lengths for each case are given in Table 3.
Figure 6.
Images of the flow tube (bottom) and the reference tube (top) for the three experimental cases at 0.633 s after start of injection after background subtraction: (A) Exp I #1; (B) Exp I #2; (C) Exp I #3; flow is from left to right. The distal tip of the catheter in the flow tube is at the pixel on the immediate left of each figure.
Figure 7.
Second-order step response fits (solid lines) to the ratio of the cross-sectional average contrast concentration along the length of the flow tube to reference tube (dotted lines) for the three experimental cases at 0.633 s from start of injection. Mixing length for each case is indicated (dashed lines) as the distance after which the step response settles to within 3% of the steady state value. Inset shows the fit of a sigmoid function to the experimental data for one case (Exp I #2) to identify the jet intact core penetration length (x0). D is the tube diameter.
Figure 8.
Goodness of the fit between the step response function predicted values and the experimental values for three images (0.6–0.667 s from start of injection) from one experimental case (Exp I #3). R2 is the coefficient of determination and the solid line is the line of identity.
Table 3.
Optimized model parameters and mixing lengths for Experiment I (Mean±SD over three images obtained at 0.6 s, 0.63 s, and 0.67 s from start of injection). (x0: jet intact core penetration length. SD: Standard deviation. D: Flow tube diameter.)
| Glycerol:contrast flow rate (cc∕s) | Ct | K | C | θ (rad) | ωn (rad∕D) | ζ | x0 (×D) | Mixing length (×D) | |
|---|---|---|---|---|---|---|---|---|---|
| Exp I #1 | 7.0:8.0 | 0.38 | 0.19±0.04 | −0.21±0.00 | 8.05±0.19 | 0.99±0.24 | 0.60±0.07 | 2.64±0.04 | 7.51±1.02 |
| Exp I #2 | 6.6:7.6 | 0.37 | 0.37±0.01 | −0.44±0.17 | 5.06±3.38 | 1.37±0.33 | 0.79±0.12 | 4.00±0.18 | 7.35±1.15 |
| Exp I #3 | 6.6:6.9 | 0.44 | 0.30±0.03 | −0.26±0.01 | 5.74±3.62 | 1.11±0.42 | 0.53±0.10 | 3.44±0.04 | 8.20±1.33 |
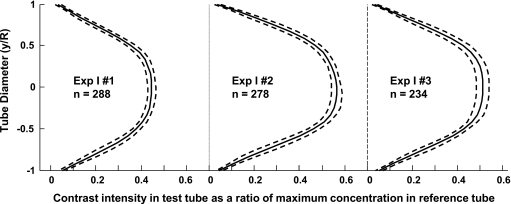
The profiles of contrast intensity at various locations along the length of the flow tube show that beyond the mixing zone the profiles become similar signifying that the mixing process is complete (Fig. 9). The average and standard deviation of all such profiles downstream of the corresponding mixing lengths are shown in Fig. 10 for one image (0.63 s from start of injection) for each of the three experiments. The small amplitude of the standard deviation demonstrates that the variability in the intensity profiles evaluated at each successive pixel along the tube axis is small.
Figure 9.
Profiles of angiographic contrast intensity along the axis of the flow tube for case Exp I #3 at 0.633 s from start of injection (mixing length of 8.7D). Profiles are plotted as a fraction of the maximum contrast intensity in the reference tube. The profiles can be seen to become self-similar after the mixing length distance. D and R are the tube diameter and radius, respectively.
Figure 10.
Average (solid lines) of contrast intensity profiles in the flow tubes after the mixing length distance for the three experimental cases at 0.633 s from start of injection. Profiles are plotted as a fraction of the maximum contrast intensity in the corresponding reference tube. The number of profiles averaged in each case is indicated by n; dashed lines are one standard deviation.
Experiment II
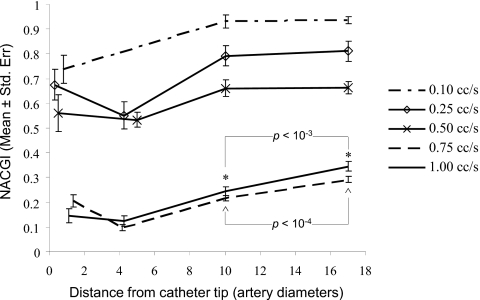
The mean injection time period was 2.21±0.3 s over all the animals. The nominal 20D location from the catheter tip was actually at 17D, 18D, or 20D for the three rabbits. Figure 11 shows the cardiac mean NACGI values obtained for the five injections in rabbit 1. Similar results were obtained for the other cases.19 In rabbit 1, minimum NACGI values were significantly lower than the corresponding values at 10D for all the injections. At the two highest injection rates (0.75 and 1 cc∕s), the grayscale value was significantly higher (p<0.05) at 20D as compared to the value at 10D indicating that the contrast was still undergoing mixing within this length for these two injections. On the other hand, NACGI values at the three lower injection rates were not significantly (p>0.05) different between the 10D and 20D locations indicating that the contrast had completely mixed with the blood at or before ten arterial diameters from the catheter tip. Table 4 shows the jet intact core penetration lengths (x0, point of minimum NACGI) and the mixing status at 10D for all the cases. As for the case mentioned above, contrast was considered to be mixed at 10D if the NACGI at 10D was significantly higher than the NACGI at x0 but not significantly different than the NACGI at 20D. NACGI values were significantly higher (p<0.05) at the nominal 20D location as compared to the value at x0 for all injections in all animals indicating that the contrast underwent significant dilution between the injection site and 20 arterial diameters in all cases.
Figure 11.
NACGI values for the five injections in rabbit 1, experiment II. Legend shows the nominal injection rates. *∧ Significant differences were noted between the grayscale values at 10 and 17 (nominally 20) arterial diameters for two injection rates.
Table 4.
Location of maximum contrast concentration and status of contrast-blood mixture at ten arterial diameters from the catheter tip for experiment II. (Ct: Craya-Curtet number. Reflux: Whether contrast reflux was visualized during injection. x0: Jet intact core penetration length given as the point along the arterial length with maximum contrast concentration. Italicized rows indicate three inferences that can be drawn from these results; see text.)
| Rabbit No. | Ct | Reflux | x0 (×D) | Mixed at 10D |
|---|---|---|---|---|
| 1 | 1.97 | No | 0.8 | Yes |
| 0.91 | No | 4.1 | Yes | |
| 0.45 | Yes | 5.0 | Yes | |
| 0.22 | Yes | 4.1 | No | |
| 0.15 | Yes | 4.4 | No | |
| 2 | 1.27 | No | 0.7 | Yes |
| 0.56 | Yes | 2.2 | Yes | |
| 0.25 | Yes | 5.6 | No | |
| 0.17 | Yes | 4.0 | No | |
| 0.11 | Yes | 4.5 | No | |
| 0.09 | Yes | 3.6 | No | |
| 3 | 0.84 | Yes | 1.9 | Yes |
| 0.35 | Yes | 5.6 | No | |
| 0.15 | Yes | 6.6 | No | |
| 0.09 | Yes | 6.6 | No | |
| 0.08 | Yes | 7.3 | No |
Experiment III
No contrast settling could be observed visually from the angiographic images obtained at the start (t=0) and the end (t=60 min) of the experiment. This was also quantitatively verified, as the profiles of the average grayscale intensity along the vertical axis of the tubes between the start and end time points of the experiment were virtually identical. The difference in average vertical grayscale intensity (or contrast concentration) distribution in the tubes 1 h after the onset of the experiment was found to deviate by less than 4% from the corresponding profiles at the beginning of the experiment, as shown in Fig. 12. This small difference in contrast distribution shows that the contrast remains homogeneously distributed in the solvent fluids for at least 1 h and does not settle under gravity.
Figure 12.
Cross-sectional average grayscale intensity along the dimensionless vial length from top (0) to bottom (1) at the start of the experiment (t=0 min) and at the end of the experiment (t=60 min) showing no settling of the contrast in any of the fluids tested. Δ represents the percentage change in mean intensity along the length of the tube from the start to end of the experiment.
DISCUSSION
During arterial angiography, clinicians conventionally inject contrast at a fast rate with the aim of rapidly building up contrast concentration in the fast flowing blood so that the artery can be adequately opacified for visualization. During such injections, the flow mechanics near the catheter tip are a complex interplay of several factors. Injecting contrast antegradely into the flowing blood at such high rates results in a low Craya-Curtet number such that the flow field immediately downstream of the catheter tip usually contains a recirculation zone around the jet of contrast. The contrast jet may establish an ejector effect, whereby the jet entrains the coflowing blood resulting in an increased blood flow rate as compared to the preinjection value. The pulsatility of blood flow changes from systole to diastole adding to the complexity of the mixing during the injection.
The nature of the flow in the mixing zone primarily depends on the mass flux ratio of the jet to the coflow, the velocity difference between the two streams, and the Reynolds numbers of the streams. In general, the nature of this flow zone depends on the Craya-Curtet number and below a critical value of this parameter the entrainment demands of the contrast jet cannot be met and recirculation will appear in the mixing zone. The ejector effect has been thoroughly investigated over the past decades during the development of jet pumps. Related to our study, more than half a century ago it was noted20 that because the “best length” of constant cross-sectional area mixing tubes for both air-to-air and water-to-water jet pumps works out to be approximately six to eight tube diameters, the same values may hold true for other fluid combinations. This observation lends support to our results on mixing lengths being less than or equal to ten arterial diameters under normal cerebral arterial injections. The relationship between the flow and geometrical parameters in the region of interest and the Craya-Curtet number is discussed in further detail in the Appendix0. It may be noted that contrast streaklines that are at times visualized on angiograms would represent relatively high Craya-Curtet numbers and poor mixing conditions at the injection site. If the Reynolds numbers are low enough the jet will be carried downstream as a laminar jet and will spread to occupy the entire tube cross section through the formation of vortices that start as growing instabilities in the jet waist (seen as undulations, Fig. 1 in Ref. 3) before growing in to a large vortex that is suddenly shed to occupy the entire cross section. On the other hand, if the Reynolds numbers are high enough such that turbulent fluctuations can be sustained in the tube, the spreading of the jet will occur much closer to the catheter tip and the spreading process will appear to be less abrupt through the formation of a cone-shaped spread (Fig. 2 in Ref. 3). Our in vitro results provide evidence of this physical phenomenon. The case with the highest Reynolds numbers of contrast injection and blood flow (Exp I #1) is closer to a turbulent spread of the jet and the region of instability (mixing zone) occurs closest to the catheter tip in this case. Angiograms from the case with the lowest Reynolds numbers (Exp I #3) on the other hand show vortex formation (Fig. 6) within the mixing zone and the mixing length is the longest in this case.
The local hemodynamics is distinctively but temporarily altered during jet injections of angiographic contrast. The pressure rise in the flow tube during injection was 55%–60% of the preinjection level in all of our in vitro cases. A simple linear relation between the pressure gradient and the flow rate suggests that the pressure (distal section of flow tube open to reservoir) should vary in a one-to-one proportion with the flow rate. However, the increase in pressure during the injection was lower than expected for the corresponding increase in flow rate (Fig. 3) if no change in hydraulic resistance is assumed. This rise in static pressure signifies that part of the expected rise in pressure is concealed in energy imparted to expansion of the discharge tubes (by about 5%–6% of the diameter) and in the kinetic energy imparted to the flow, which is responsible for carrying the mixing fluids downstream with a higher flow rate than the combined blood analog fluid and contrast flow rates. The percentage increase in flow and pressure during the in vivo injections was generally proportional to the injection rate or, more appropriately, to the contrast ejection velocity. This proportionality has been observed previously.13, 14 As an alternative to the ejector effect explanation, such increase in flow has been attributed to a pressure rise due to a transient increase in resistance at the catheter tip because of turbulence.13 However, the ejection velocities in that study13 seem very high (minimum velocity mismatch between injectate and coflow of about 1 m∕s). We recorded marked increases in mean flow (70%) even with marginal increases in mean pressure (5%) in vivo. This suggests that the phenomenon of jet entrainment may be predominant during injections relevant to the cerebral circulation. In our in vitro experiments, the working fluid flow rate was increased to a maximum of 1.8–2.5 times the preinjection value (Fig. 3). The volume of working fluid flowing during the entire injection period (1 s) was 20%–30% more than the volume flowing in 1 s before the injection began. This also shows that during the injection, entrainment of the flow around the catheter due to the ejector effect enhances the flow even though there was a reduction in flow rate in the initial stages. Consequently, the grayscale intensity of the injected contrast in the flow tube is much lower (about 50%–60%, Figs. 79) than that of the contrast alone in the reference tube.
It may be noted that the blood entrained into the mixing zone or flow of blood around the catheter tip is not visible on angiograms. It is only the contrast that is entrapped in the recirculation zone in the vicinity of the catheter tip that is visible. Just based on visual inspection, therefore, injections of contrast may be interpreted as stopping the blood flow and replacing it during the injection period with flow of contrast only. It has also been suggested previously that visualization of retrograde movement of contrast from the catheter tip, called contrast reflux,21 indicates that blood has been replaced or substituted entirely by contrast medium. Appearance of such reflux has been used to measure the mean blood flow rate in the artery (spillover flow metering).22 All the flow recordings in our in vivo experiments (Fig. 5) show that pulsatility is maintained during injections of contrast at a steady rate. The same phenomenon has been observed in other studies12, 13, 14 even over 15 s injection periods. This observation precludes the formation and downstream travel of a slug of contrast. Also, contrast reflux could be observed in our cases even when injection rates were lower than the mean blood flow rates (Table 2). A more accurate threshold for appearance of reflux seems to be indicated by the Craya-Curtet number for the injection instead of flow rates. From Table 4 (second row in italic), reflux occurred below a Ct value of 0.84. This result is interesting because it points to the previously known critical value of ∼0.7–∼1.0 for the Craya-Curtet number below which regions of recirculation form in the mixing zone. Table 4 (first and second rows in italic) also suggests that visualization of reflux does not preclude mixing because the injected contrast mixed with blood within ten arterial diameters from the catheter tip even in cases where reflux was observed. Therefore, our results suggest that forward flow of blood is always maintained during cerebral arterial injections. Stoppage of blood flow and flow of pure contrast from the catheter tip could occur but only under extreme injection conditions such as the placement of a catheter in the so-called wedge position (i.e., the outer diameter of the distal tip of the catheter is larger than the inner diameter of the artery at that location).
It should be mentioned that in our experiments the extent of reflux was larger for higher injection rates where mixing did not occur within 10D, so even though reflux does not preclude mixing, it may increase the mixing length. Table 3 (experiment I) and Table 4 (third row in italic, experiment II) show that in our study mixing was complete within 10D as long as the Craya-Curtet number was above 0.35. Craya-Curtet numbers of cerebral arterial injections performed in the clinical arena are around 0.35–0.45 (see the Appendix0). Based on our results, therefore, the injection conditions commonly used in cerebral arterial angiography can be considered to be mixing favorable and it is plausible to state that complete mixing occurs within 10D from the catheter tip in angiographic contrast injections in the cerebral circulation. Ten arterial diameters in the cerebral circulation corresponds to about 3 cm so our results suggest that the catheter tip should be placed at least this distance proximal to the region of interest where hemodynamics is to be studied using contrast flow dynamics.
Our experiments were conducted in relatively straight lumens; the tortuosity of the cerebrovasculature may enhance mixing in which case the mixing length would be less than 10D. Also, it was difficult to center the catheter tip within the arterial lumen during some of the in vivo injections in rabbit 2. In these cases where the catheter tip seemed off center, the mixing lengths do not show any deviation from the overall trend of the experiments. Although the postinjection vasodilatory response may be amplified due to higher shear stresses at the injection site, an eccentric catheter lumen does not seem to affect the mixing process and the mixing length estimates. Consistent with common clinical practice, we injected a 50∕50 volume mixture of angiographic contrast and saline at room temperature in all three of our experiments. Different contrast dilution ratios or temperatures may affect the mixing process. However, any changes in contrast density due to dilution or temperature should be represented within the range of Craya-Curtet numbers investigated here. Heating the contrast to body temperature would result in a reduction of its viscosity, thereby enhancing the mixing process due to an increase in the jet Reynolds number.
The average grayscale intensity at each cross section along the flow tube (experiment I) exhibits the characteristics of a second-order underdamped system in response to a unit step input. The unit step input can be considered to occur where the spreading of the jet core starts. The solution cannot be obtained analytically by considering a length-shifted step input because it is difficult to specify the boundary conditions for the data. The precise location of the unit step also cannot be pinpointed directly from the data, and thus a different objective criterion is required. We applied a sigmoid function fit to the data and while this function does not yield the optimal fit, it permits us to determine the location of the initial significant spread of the jet through a simple function. This point establishes the location of the unit step and the beginning of the step response (beginning of the mixing zone). As there is no forcing input before this location, the system response corresponds to the homogeneous solution of the second-order equation (free response). The value of the step response function and its first derivative at the beginning of the mixing zone need to be matched to the homogeneous response of the system that is located between the catheter tip and the beginning of the mixing zone. To understand the rationale for this model, one has to view the function from downstream to upstream. In this view the system appears to have reacted to a step function further upstream and we have to therefore march upstream toward the catheter and at the point where the step occurred; we apply an inverse step. Since there is a residual response in the system, however, it will decay according to the system properties and the transition from the unit step to free response is matched at the interface. Therefore, it is possible to identify in this modeling process both the jet intact core penetration length and the mixing zone which when combined yield the total mixing length for the injection. A theoretical approximation on discharge of free jets into stationary unbounded fluids23 suggests that the jet energy begins to decay after seven exit-hole diameters. For catheter inner diameters about 30%–40% of the arterial diameter, this value corresponds to two or three arterial diameters which are similar to our values for the jet intact core penetration distance. It can be noted from Figs. 78 that the model fit captures the trend of the data very well.
Several studies24, 25, 26, 27, 28, 29, 30, 31, 32 have suggested that when angiography is used to derive flow information at a region of interest, such as a cerebral aneurysm, the dynamics of visualized contrast may not represent the dynamics of blood. The higher specific density contrast is said to be constrained by gravity to follow a different trajectory than blood. However, the contrast injection parameters in all these studies seem to be markedly different from the injection conditions commonly used in cerebral arterial angiography. The injection conditions used in these studies include stopping the flow of working fluid during contrast injection24, 25 (thereby creating a slug of pure contrast that mixes slowly by diffusion), the use of catheters with side holes26 (thereby reducing the jet flow rate emanating from the end hole resulting in reduced mixing at the injection site), injections perpendicular to27 or antegrade to28 coflow of low Reynolds numbers (Re∼70–110 as calculated from provided data, which would mitigate mixing), temporary imposition of steady coflow rates during injections in simulations of pulsatile flow29 (contrary to clinical conditions where ejector effect may amplify rather than diminish flow during the injection), or injections with high Craya-Curtet numbers30 (Ct∼3.3 as calculated from provided data and basic flow rate assumptions, which are much higher than the critical limit leading to poor mixing). Such gravity effects have also been mentioned in other publications.31, 32 Although we have not specifically investigated the effect of gravity as in these studies, our results suggest that proper injection conditions that facilitate mixing (correct range of Ct number, catheter tip 10D away) may be necessary prior to studying gravity effects at a region of interest.
It should be noted that transport of pure or poorly mixed contrast may occur for several arterial diameters after the tip of the catheter if the injection conditions are not favorable for mixing. For example, under conditions analogous to the theory proposed by Taylor,33, 34 a contrast slug unitarily convected downstream would mix with the working fluid primarily by very slow molecular diffusion at the leading and trailing edge of the convected slug. If the conditions are suitable for mixing, however, a homogeneous mixture of contrast and blood should reach the region of interest and probably mitigate such gravity artifacts. Even the results of one of the aforementioned studies28 showed that if pulsatile flow conditions were used in asymmetric aneurysm phantoms, contrast accumulation in lower portions of the aneurysm were markedly reduced or even absent. Also to be noted is that the awareness that the specific gravity of angiographic contrast is higher than that of blood may have led to many such visually observed perfusion abnormalities being attributed to a density mismatch, overlooking the fact that the viscosity mismatch between the contrast and the blood may also play an important role in the local hemodynamics.
Typical pure contrast agents for arterial injections are about 30% more dense than blood. A common practice in arterial angiography is to dilute the contrast with physiological saline at a volume ratio of 1:1 (or 2:1) to reduce contrast burden on the patient and therefore the density mismatch between the injected contrast and blood is reduced to less than 20%. In addition, our results show that the injected contrast mixes rapidly with blood and therefore the density mismatch between the blood and the contrast∕blood mixture is further reduced to less than 10%. Blood rich in contrast that penetrates hydraulic dead spots such as aneurysms due to altered hemodynamics during the injection process itself is more likely to remain there after the injection because of regions of flow stagnation in the aneurysm as a result of the hemodynamics returning to the preinjection basal level. Observed phenomena referred to as “contrast settling” or “contrast pooling” may legitimately arise under some specific conditions that severely mitigate the mixing of angiographic contrast with blood. It should be noted, however, that if only the effect of gravity is considered, an increase in density mismatch between two fluids will possibly cause a more rapid fall of the heavier fluid, resulting in increased agitation and enhanced gravity-driven mixing.18
CONCLUSIONS
The first experiment shows that the concentration of the contrast∕working fluid mixture plateaus to about half of that of contrast only within a few tube diameters of the catheter end hole and remains at that level during contrast injection. The second experiment shows that during appropriate in vivo injections forward blood flow is maintained and results in a homogeneous contrast∕blood mixture within a few arterial diameters of the catheter end hole. The third experiment shows that contrast premixed with a working fluid does not settle out in the gravity direction for at least 1 h. Given our overall results and the discussion above, a reasonable inference for evaluating injections of angiographic contrast in the (cerebrovascular) clinical arena can be stated: If the catheter tip is placed at least ten artery diameters proximal to the region of interest and contrast is injected such that the Craya-Curtet number is within a range around 0.4–0.9, the dynamics of angiographic contrast as visualized in the region of interest matches the dynamics of blood in that region. This range of the Craya-Curtet number is bounded by excessive contrast reflux on the lower end (too high contrast jet momentum) and poor mixing at the injection site on the higher end (too low contrast jet momentum). The local hemodynamics is distinctively altered for the period of such injections and functional information derived from angiographic images acquired during this time may not represent basal conditions. Mixing possibly also depends on the Reynolds numbers of blood flow and contrast injection and on the Womersley number of blood flow.
ACKNOWLEDGMENT
This study was supported by NIH Grant No. R01 NS045753-05A1 to B.B.L.
APPENDIX: THE CRAYA-CURTET NUMBER
A schematic of the mixing zone under the studied conditions is shown in Fig. 1 of the manuscript. The volumetric flow rate of contrast through the catheter, Qc, is of the same order of magnitude as the flow rate of blood, Qb, in the artery in which the catheter is placed. However, due to the much smaller cross-sectional area through which the contrast emanates, the flow velocity of the contrast, Vc, will be much higher than that of blood, Vb. The result is a high velocity central jet in the artery that spreads to occupy the entire cross section and in the process it entrains blood and temporarily increases the flow rate of blood via the ejector effect. The flow dynamics of such confined jets has been investigated in the fluid mechanics literature and the similarity parameters that characterize the behavior of such jets have been determined to be the Reynolds number and the Craya-Curtet number Ct. Laminar Craya-Curtet flows are formed when a jet discharges into a coaxial pipe flow. The Craya-Curtet number was initially expressed as the inverse square root of the nondimensionalized total momentum.5 It was noted that below a critical value of Ct, the entrainment demands of the jet cannot be met by the coflow and the excess demand is satisfied at the expense of jet flow reversal to conserve total mass flux.5, 7 Then, below this critical Ct value (generally within a range of about 0.7–0.98)5, 6 a recirculation region forms distal to the jet exit location.
A simplified expression for the Craya-Curtet number has previously been developed for the study of jet pumps under uniform velocity profiles of the jet and coaxial flow4 as
or
The subscripts b and c stand for blood and contrast and V, , and J represent velocity, mass flux, and momentum flux, respectively. As we wanted to study mixing lengths for a range of Craya-Curtet numbers, we used an approximation to this formulation that would not give imaginary numbers in cases where Vb∕Vc>1. This problem does not arise in jet pumps because in those cases jet velocities (Vc) are always greater than coflow velocities (Vb). However, in cerebral arterial angiographic injections, Vc can be much less than Vb, so we used the following formulation of the Craya-Curtet number as the square root of the ratio of the average momentum fluxes:
If ρb and ρc are the densities of blood and contrast, respectively, Qb and Qc are the volumetric flows of blood and contrast, respectively, and IDc and ODc are the inner and outer diameters of the distal tip of the catheter and Da is the artery diameter around the tip of the catheter, then
| (A1) |
Therefore, there are three factors at play in determining the flow characteristics during contrast injection. The density ratio does not change much for various contrast agents; however, the perfusion ratio and the geometry can change over a wide range and therefore the mixing characteristics are dependent on the size of the artery, the choice of the catheter, and the speed of contrast injection through the catheter. As mentioned before, although not anticipated for industrial ejectors, another critical condition of importance for contrast mixing with arterial blood arises when the velocity of contrast injection is the same as (or less than) the velocity of blood around the catheter. This condition negates the ejector effect and the contrast would be carried downstream with reduced mixing.
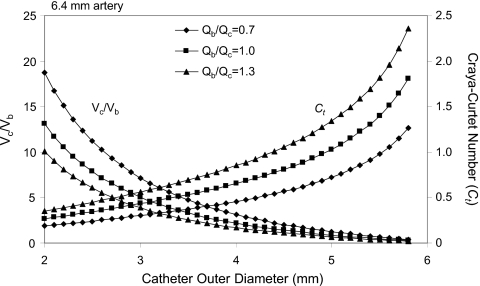
The following are two examples of variations in the Craya-Curtet number and the velocity ratio of contrast to blood during contrast injection into a 6.4 and a 3 mm artery via the end hole of catheters of variable diameter. In the first example (Fig. 13) we consider the density ratio of blood to contrast to be fixed at about 0.9. Next we select an artery of about 6.4 mm and fix the ratio of luminal to outer diameter of the distal tip of the catheter to be about 83%. Under these conditions we investigate the changes in the Craya-Curtet number and the ratio of the contrast velocity to that of the blood around the catheter for three different cases of contrast injection. In one case, the contrast injection rate is equal to the flow rate in the artery, one in which the contrast injection rate is 30% higher than the flow of blood and in the last case, the flow of the injected contrast is 30% lower than the flow rate of blood. The condition of equal flow rates is similar to the conditions in the in vitro experiments reported here. The analysis suggests that with a 3 mm (9 Fr) catheter, for example, the Craya-Curtet number is 0.4326, which is well below the critical value of ∼0.7. Thus, the entrainment demands of the contrast jet cannot be satisfied and a recirculation zone will form distal to the tip of the catheter before the jet spreads to fill the entire cross section of the artery. It is also worth noting that the under such conditions, the velocity of contrast issuing from the catheter tip is five times higher than the velocity of the blood around the catheter despite the fact that the volumetric flow rates are equal. On the other hand, if one uses a 5 mm catheter under the same conditions, the velocity of the contrast leaving the catheter will be lower than the velocity of the surrounding blood. The Craya-Curtet number under such conditions is about 1.03, which is higher than the range of critical values and may promote laminar flow of the contrast with relatively reduced mixing.
Figure 13.
Parametric study of the factors affecting contrast mixing during selective angiography [6.4 mm artery, inner diameter of catheter=0.83×(catheter outer diameter)]. Qb and Qc are the flow rates of blood and contrast injection, respectively; Vb and Vc are the corresponding velocities at the catheter exit.
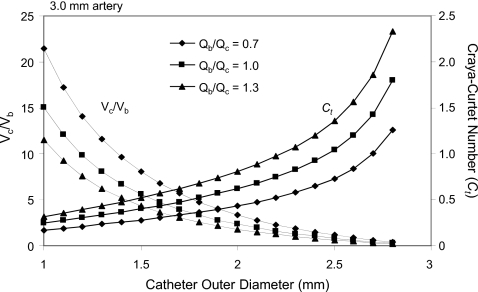
In the second example (Fig. 14) we use again a fixed value of the blood to contrast density ratio of about 0.9 and a range of catheters in which the luminal diameter is 72% of the outer diameter, which simulates microcatheters because the wall thickness for these catheters reduces the ratio of luminal to external diameters. The artery diameter selected for this example is 3 mm and the same contrast injection scenarios examined before are evaluated. The analysis suggests, for example, that with a 1.33 mm (4 Fr) catheter for an injection rate equal to the flow rate of blood, the Craya-Curtet number is about 0.33 and the average velocity of the contrast is about eight times higher than that of the blood. However, if one uses a 2.5 mm catheter (about 8 Fr), then the issuing velocity of the contrast will be slightly less than that of the blood with a Craya-Curtet number of 1.04 again possibly diminishing the mixing between the two streams. These examples demonstrate that the choice of the catheter vis-à-vis the diameter of the artery and the speed of injection are critical in determining the mixing characteristics of the contrast. These two particular low Ct examples have been selected based on commonly practiced contrast injections by neurointerventionalists during selective (first example) or superselective (second example) arterial injections. In clinical practice, therefore, the velocity of injected contrast is much higher than that of blood and complete mixing of the contrast with blood can be expected within a few artery diameters downstream of the catheter tip.
Figure 14.
Parametric study of the factors affecting contrast mixing during superselective angiography [3 mm artery, inner diameter of catheter=0.72×(outer diameter)]. Qb and Qc are the flow rates of blood and contrast injections, respectively; Vb and Vc are the corresponding velocities at the catheter exit.
References
- Lieber B. B. et al. , “Functional angiography,” Crit. Rev. Biomed. Eng. 33(1), 1–102 (2005). 10.1615/CritRevBiomedEng.v33.i1.10 [DOI] [PubMed] [Google Scholar]
- Wakhloo A. K. et al. , “A novel approach to flow quantification in brain arteriovenous malformations prior to enbucrilate embolization: Use of insoluble contrast (Ethiodol droplet) angiography,” J. Neurosurg. 89(3), 395–404 (1998). 10.3171/jns.1998.89.3.0395 [DOI] [PubMed] [Google Scholar]
- Mabon R. F. et al. , “Fluid dynamics in cerebral angiography,” Radiology 128(3), 669–676 (1978). [DOI] [PubMed] [Google Scholar]
- Becker H. A., “Confined jet mixing for nonseparating conditions — Discussion,” J. Basic Eng. 93(3), 347 (1971). [Google Scholar]
- Barchilon M. and Curtet R., “Some details of the structure of an axisymmetric confined jet with back-flow,” J. Basic Eng. 86(4), 777–787 (1964). [Google Scholar]
- Revuelta A., Martínez-Bazán C., Sánchez A. L., and Liñán A., “Laminar Craya-Curtet jets,” Phys. Fluids 16(1), 208–211 (2004). 10.1063/1.1629300 [DOI] [Google Scholar]
- Urson H., “Numerical investigation of jets in a reacting crossflow,” M.S. thesis, University of Toronto, 1999. [Google Scholar]
- Morris T. W. and Walike C. S., “An in vitro study of the hemodynamic effects of catheter injections,” Invest. Radiol. 24(5), 361–365 (1989). 10.1097/00004424-198905000-00004 [DOI] [PubMed] [Google Scholar]
- Yamashita K., Hayakawa K., Tanaka M., and Konishi J., “Cardiovascular responses following the intracarotid injections of ionic and nonionic contrast media compared with various mannitol solutions. Correlation with osmolality,” Invest. Radiol. 23(9), 680–686 (1988). [PubMed] [Google Scholar]
- Hayakawa K., Morris T. W., Katzberg R. W., and Fischer H. W., “Cardiovascular responses to the intravertebral artery injection of hypertonic contrast media in the dog,” Invest. Radiol. 20(2), 217–221 (1985). 10.1097/00004424-198503000-00022 [DOI] [PubMed] [Google Scholar]
- Morris T. W., Francis M., and Fischer H. W., “A comparison of the cardiovascular responses to carotid injections of ionic and nonionic contrast media,” Invest. Radiol. 14(3), 217–223 (1979). [PubMed] [Google Scholar]
- Levin D. C., “Augmented arterial flow and pressure resulting from selective injections through catheters: Clinical implications,” Radiology 127(1), 103–108 (1978). [DOI] [PubMed] [Google Scholar]
- Wolf G. L., Shaw D. D., Baltaxe H. A., Kilzer K., and Kraft L., “A proposed mechanism for transient increases in arterial pressure and flow during angiographic injections,” Invest. Radiol. 13(3), 195–199 (1978). 10.1097/00004424-197805000-00004 [DOI] [PubMed] [Google Scholar]
- Levin D. C., Phillips D. A., Lee-Son S., and Maroko P. R., “Hemodynamic changes distal to selective arterial injections,” Invest. Radiol. 12(2), 116–120 (1977). 10.1097/00004424-197703000-00003 [DOI] [PubMed] [Google Scholar]
- Hilal S. K., “Hemodynamic changes associated with the intra-arterial injection of contrast media. New toxicity tests and a new experimental contrast medium,” Radiology 86(4), 615–633 (1966). [DOI] [PubMed] [Google Scholar]
- Figliola R. S. and Beasley D. E., Theory and Design for Mechanical Measurements, 2nd ed. (Wiley, Hoboken, NJ, 1995), pp. 99–107. [Google Scholar]
- Treo E. F., Herrera M. C., and Valentinuzzi M. E., “Algorithm for identifying and separating beats from arterial pulse records,” Biomed. Eng. Online 4, 48 (2005). 10.1186/1475-925X-4-48 [DOI] [PMC free article] [PubMed] [Google Scholar]
- Lieber B. B., Gounis M. J., and Bahar N., “In vitro investigation of contrast mixability for functional angiography,” 2004 American Society of Mechanical Engineers International Mechanical Engineering Conference and Exposition, Anaheim, CA, November 13–19, 2004, Advances in Bioengineering, BED, 45-46 (2004).
- Sadasivan C., Cesar L., and Lieber B. B., “Mixing of angiographic contrast with blood during injections in the cerebral circulation,” Proceedings of the ASME 2008 Summer Bioengineering Conference, Marriott Resort, Marco Island, FL, 25–29 June 2008. (CD-ROM ISBN #: 0791838250).
- Shapiro A. H., “An investigation of ejector design by analysis and experiment – Discussion,” J. Appl. Mech. 18(1), 117 (1951). [Google Scholar]
- Scatliff J. H., Hyde I., and Gautot H. J., “Vertebral artery reflux: A laboratory investigation of the nonobstructive causes of retrograde flow of contrast material in the contralateral vertebral artery,” Radiology 88(1), 64–74 (1967). [DOI] [PubMed] [Google Scholar]
- Gianturco C., Shimizu T., Stefferda F. R., and Taylor R. P., “Measurement of blood flow by angiography with increasing rate of injection: Experimental study,” Invest. Radiol. 5(5), 361–363 (1970). 10.1097/00004424-197009000-00009 [DOI] [PubMed] [Google Scholar]
- Abbott J. A., Lipton M. J., Hayashi T., and Lee F. C., “A quantitative method for determining angiographic jet energy forces and their dissipation: Theoretic and practical implications,” Cathet Cardiovasc. Diagn. 3(2), 139–154 (1977). 10.1002/ccd.1810030207 [DOI] [PubMed] [Google Scholar]
- Clough A. V. et al. , “X-ray measurement of regional blood flow distribution using radiopaque contrast medium: Influence of gravity,” Proc. SPIE 4321, 298–304 (2001). 10.1117/12.428149 [DOI] [Google Scholar]
- Clough A. V. et al. , “Influence of gravity on radiographic contrast material-based measurements of regional blood flow distribution,” Acad. Radiol. 10(2), 128–138 (2003). 10.1016/S1076-6332(03)80036-3 [DOI] [PubMed] [Google Scholar]
- Wang Z. et al. , “Angiographic analysis of blood flow modification in cerebral aneurysm models with a new asymmetric stent,” Proc. SPIE 5369, 307–318 (2004). 10.1117/12.535347 [DOI] [PMC free article] [PubMed] [Google Scholar]
- Wang Z. J. et al. , “Contrast settling in cerebral aneurysm angiography,” Phys. Med. Biol. 50(13), 3171–3181 (2005). 10.1088/0031-9155/50/13/014 [DOI] [PubMed] [Google Scholar]
- Ford M. D.et al. , “The effect of gravity on cine X-ray angiography,” Summer Bioengineering Conference, 25–29 June 2003, Key Biscayne, FL (CD-ROM ISBN #: 0974249203).
- Ford M. D. et al. , “Virtual angiography for visualization and validation of computational models of aneurysm hemodynamics,” IEEE Trans. Med. Imaging 24(12), 1586–1592 (2005). 10.1109/TMI.2005.859204 [DOI] [PubMed] [Google Scholar]
- Freeny P. C. and Marks W. M., “Hepatic perfusion abnormalities during CT angiography: Detection and interpretation,” Radiology 159, 685–691 (1986). [DOI] [PubMed] [Google Scholar]
- Rudin S. et al. , “Measurement of flow modification in phantom aneurysm model: Comparison of coils and a longitudinally and axially asymmetric stent – initial findings,” Radiology 231(1), 272–276 (2004). 10.1148/radiol.2311021741 [DOI] [PubMed] [Google Scholar]
- Meng H. et al. , “Saccular aneurysms on straight and curved vessels are subject to different hemodynamics: Implications of intravascular stenting,” AJNR Am. J. Neuroradiol. 27(9), 1861–1865 (2006). [PMC free article] [PubMed] [Google Scholar]
- Taylor G. I., “Dispersion of soluble matter in solvent flowing slowly through a tube,” Proc. R. Soc. London, Ser. A 219(1137), 186–203 (1953). 10.1098/rspa.1953.0139 [DOI] [Google Scholar]
- Taylor G. I., “The dispersion of matter in turbulent flow through a pipe,” Proc. R. Soc. London, Ser. A 223(1155), 446–468 (1954). 10.1098/rspa.1954.0130 [DOI] [Google Scholar]


