Abstract
Background
The evaluation of research output, such as estimation of the proportion of treatment successes, is of ethical, scientific, and public importance but has rarely been evaluated systematically. We assessed how often experimental cancer treatments that undergo testing in randomized clinical trials (RCTs) result in discovery of successful new interventions.
Methods
We extracted data from all completed (published and unpublished) phase 3 RCTs conducted by the National Cancer Institute cooperative groups since their inception in 1955. Therapeutic successes were determined by (1) assessing the proportion of statistically significant trials favoring new or standard treatments, (2) determining the proportion of the trials in which new treatments were considered superior to standard treatments according to the original researchers, and (3) quantitatively synthesizing data for main clinical outcomes (overall and event-free survival).
Results
Data from 624 trials (781 randomized comparisons) involving 216 451 patients were analyzed. In all, 30% of trials had statistically significant results, of which new interventions were superior to established treatments in 80% of trials. The original researchers judged that the risk-benefit profile favored new treatments in 41% of comparisons (316 of 766). Hazard ratios for overall and event-free survival, available for 614 comparisons, were 0.95 (99% confidence interval [CI], 0.93-0.98) and 0.90 (99% CI, 0.87- 0.93), respectively, slightly favoring new treatments. Breakthrough interventions were discovered in 15% of trials.
Conclusions
Approximately 25% to 50% of new cancer treatments that reach the stage of assessment in RCTs will prove successful. The pattern of successes has become more stable over time. The results are consistent with the hypothesis that the ethical principle of equipoise defines limits of discoverability in clinical research and ultimately drives therapeutic advances in clinical medicine.
ALTHOUGH CANCER REmains the second leading cause of deaths in the United States,1 there have been continuous improvements in survival and other outcomes in patients with cancer over time.1 To a large extent, this has occurred through the introduction of new treatments tested in clinical trials,2 with randomized controlled trials (RCTs) widely considered to be the most reliable method of assessing differences between the effects of health care interventions.3,4 Cancer is the only disease for which the National Institutes of Health has consistently funded a cooperative clinical trial infrastructure.4 Despite this investment,5 little is known about the proportion of clinical trials that have led to the discovery of successful new treatments.6
There are ethical, public policy, and scientific reasons for evaluating the success of new treatments in RCTs. New discoveries cannot be made without the willingness of patients to enroll in clinical trials.7 Because they are being asked to volunteer for these trials, it has been suggested that patients be given all relevant details about the situation in which they find themselves, including the track record of experimental treatments studied in earlier trials.6 Similarly, researchers, policymakers, funding agencies, and the public share an interest in knowing what payback has been achieved from the research that society supports.8 Herein we address this question by systematically evaluating the treatment successes in RCTs conducted by cooperative oncology groups (COGs) under the aegis of the National Cancer Institute (NCI). We assessed how often new treatments for cancer evaluated in phase 3 RCTs are superior to standard treatments in a cohort of consecutive trials conducted by a common funder (NCI), which has the same framework for the development of preventive and therapeutic advances in oncology.
METHODS
TRIALS
We evaluated a consecutive series of all phase 3 RCTs completed between 1955 and 2000 under the aegis of the 8 NCI-sponsored COGs. Since it typically takes several years to complete follow-up and publish an RCT,9 we included only completed trials up to the year 2000 that had been published by December 2006.
We obtained a list of trials from the NCI that was verified by the headquarters of the relevant COG. Each COG provided a copy of the research protocol(s) for each study. We analyzed data from published and unpublished trials. December 31, 2006, was used as the cutoff date for determination of each RCT publication status. If the trial had not been published by this date, it was classified as unpublished. For 1 COG (Cancer and Leukemia Group B), data were available for the trials that began in 1980 and later. This study was approved by the institutional review board (No. 100449) of the University of South Florida.
EVALUATION OF TREATMENT SUCCESSES: OUTCOME MEASURES
For each trial we identified the new/experimental and the standard treatment by means of information provided in the background section of each article and/or the related research protocol. Trials that compared 2 experimental arms against each other were excluded. Similarly, our protocol specified exclusion of trials that had been designed to assess equivalence rather than superiority.
We determined the superiority of experimental or standard treatment by using 3 outcome measures to capture all the aspects of treatment successes10,11: (1) the proportion of the trials that were statistically significant according to the primary outcomes specified in the null hypothesis; (2) the proportion of trials for which the original researchers claimed that the new or the standard treatment was better; and (3) pooled outcome data from the trials obtained by quantitative meta-analytic techniques.12
The second outcome measure was necessary because a simple determination of the proportion of trials that achieved statistical significance on their primary outcome does not capture subtleties involved in identifying advances in treatments or the trade-off between benefits and harms of competing interventions. For example, treatments with shorter duration or a convenient method of application can be considered successful even if no statistically significant findings are identified. To deduce investigators’ judgments about treatment success, we used the method that, in previous studies, was found to have high face and content validity and high reliability10,11,13,14 and therefore likely reflected the accurate judgments of the investigators about the merits of the treatments.
The third outcome measure, pooled outcome data quantitatively, is important because the above mentioned “vote counting” methods15 are based on assessment of a proportion of successes or failures and do not take into account effect sizes in individual trials, the number of patients, or time to event data. Consequently, we synthesized data on the most important events (deaths, disease progression, or relapses) to explore the distribution of the outcomes between experimental and standard treatments.12 Summary effects were expressed as hazard ratios (HRs)12 with 99% confidence intervals (CIs). A random-effects model was used.12 Odds ratios (ORs) were used to summarize data on response rate and treatment-related mortality. The unit of analysis was the comparison within each trial. For trials/reports that included more than 1 experimental treatment group, we pooled the data from all such groups if the results suggested that these interventions were not better than the standard treatment. We also dealt with trials in which more than 1 new treatment was compared with standard treatment by repeating the analysis using 1 of the new intervention groups only, selecting it at random, and by splitting the control group into the relevant number of subsets and using each of these for the statistical comparison with each new treatment. Our results were not different in any important way, regardless of which analytic method was used; therefore, we report only the main analyses.
To assess the efficiency of the clinical trial system to successfully address scientific hypotheses that led to initiation of the trials, we also determined a proportion of “conclusive” and “inconclusive” trials. We operationally defined inconclusive trials as those in which the 95% CI for the treatment effect included an HR and OR of 0.8 and 1.2, respectively, as a surrogate for a clinically important effect.
We determined the proportion of discoveries that were “breakthrough interventions.” This was arbitrarily defined as interventions judged by the original researchers to be so beneficial that they should immediately become the new standard of care or that had an effect size so large that they reduced the death rate by 50% or more (ie, the HR for death was 0.5 or less).
Two investigators (A.K. and H.P.S.) extracted the data, and the principal investigator (B.D.) checked 1 in 4 trials at random. Consensus meetings were held to resolve any interobserver differences. Interobserver agreements for quality appraisal and for assessment of treatment success were high (0.90-0.97).
FACTORS OTHER THAN TREATMENT THAT MAY AFFECT OUTCOMES
Factors other than the true differences between the effects of treatments may affect the results of clinical trials. Research during the past decade has identified publication bias,16 methodologic quality,17 and the choice of control intervention18 as key factors affecting trials’ results.
Publication Rate
We used the NCI definition of completed studies19 to determine the publication rate. If a study had more than 1 publication, we extracted data from the most recent report. Studies that were initiated but were closed early because of poor patient accrual or that had not yet completed follow-up were excluded. Trials that were stopped early because the results clearly favored one treatment over another were included in our analysis.
Quality Assessment
We extracted data on the methodologic domains relevant to minimizing bias and random error in the conduct and analysis of the trials.17,20 To ensure the accuracy of quality assessment of the trials, we used both the research protocols and the most recent publication.10,11,21
Classification of Comparator
The results of a trial may be affected by the use of an inappropriate comparator,18 even if the trial adheres to all contemporary standards of good design.20 In light of the evidence that trials using placebos or no therapy as controls may produce misleading results in favor of new treatments,13,22,23 we classified comparators in trials as either active treatment or placebo/no active treatment. We analyzed these trials separately.
ASSESSMENT OF PATTERN OF TREATMENT SUCCESSES OVER TIME
Two approaches were used: time series analysis and meta-analysis stratified by time periods. For time series analysis, we postulated that if one treatment success affects the outcome of another, we would see significant correlation between experimental treatments at time t and preceding times. However, if testing in each trial is independent of another, we would expect to see a “white noise” pattern with no significant autocorrelation in time series. Since time series may miss a trend toward improvement in outcomes due to various exogenous factors, such as increase in sample size of trials over time, we performed the subgroup meta-analyses testing for differences of treatments during 4 time periods. We tested whether treatment effect in the trials was, on average, different between trials conducted from 1950 to 1970, 1971 to 1980, 1981 to 1990, and 1991 to 2000.
Finally, we performed mathematical modeling of treatment successes in an attempt to deduce whether there is a pattern in the distribution of therapeutic advances in cancer.
All analyses were done with Stata statistical software.24 Curve fitting was performed with TableCurve 2D software.25
RESULTS
Details of trial characteristics and number of trials conducted by each cooperative group are summarized in Table 1. There were 781 randomized comparisons, involving a total of 216 451 patients in 624 trials. Overall, the methodologic quality of trials conducted by the COGs was judged to be high (Table 2).
Table 1.
Characteristics of the 781 Randomized Comparisons (624 Trials) Included in the Analysis
| Variable | No. (%) of Comparisonsa |
|---|---|
| Cooperative oncology group | |
| ChOG | 152 (19) |
| CALGB | 62 (8) |
| ECOG | 177 (23) |
| GOG | 50 (6) |
| NCCTG | 96 (12) |
| NSABP | 35 (4) |
| RTOG | 66 (8) |
| SWOG | 143 (18) |
| Disease | |
| Breast cancer | 118 (15) |
| Gastrointestinal cancer | 76 (10) |
| Gynecologic cancer | 73 (9) |
| Head and neck cancer | 33 (4) |
| Hematologic malignancy | 210 (27) |
| Lung cancer | 81 (10) |
| Prostate cancer | 15 (2) |
| Other types of cancer | 175 (22) |
| Type of treatmentb | |
| Adjuvant | 193 (25) |
| Definitive | 290 (37) |
| Induction | 79 (10) |
| Maintenance | 98 (13) |
| Neoadjuvant | 10 (1) |
| Supportive | 54 (7) |
| Other therapies | 55 (7) |
| No. of comparisonsb | |
| 2 Arms | 537 (69) |
| ≥ 3 Arms | 242 (31) |
| Study designa,b | |
| Parallel | 698 (90) |
| Crossover | 61 (8) |
| Factorial design | 20 (3) |
| Maskingb | |
| Double-blinding | 55 (7) |
| Single-blinding | 5 (1) |
| Open label | 719 (92) |
| Type of comparisonb | |
| One active treatment vs other (active treatment) | 643 (83) |
| Placebo or no treatment vs active treatment | 136 (17) |
| Primary outcomeb | |
| Survival | 294 (38) |
| Event-free survival | 269 (35) |
| Best tumor response rate | 135 (17) |
| Others | 81 (10) |
Abbreviations: CALGB, Cancer and Leukemia Group B; ChOG, Children’s Oncology Groups; ECOG, Eastern Cooperative Oncology Group; GOG, Gynecological Oncology Group; NCCTG, Northern Central Cancer Treatment Group; NSABP, National Surgical Adjuvant Breast and Bowel Project; RTOG, Radiation Therapy Oncology Group; SWOG, Southwest Oncology Group.
Because of rounding, percentages may not total 100.
The denominator was 779 comparisons instead of 781 for these characteristics.
Table 2.
Methodologic Quality of the COG Randomized Controlled Trials
| Variable | No. (%) of Comparisonsa |
|---|---|
| Expected difference in outcomes prespecified | |
| Yes | 659 (84.4) |
| No | 52 (6.7) |
| Unclear/missing data | 70 (9.0) |
| Expected α error prespecified | |
| Yes | 654 (83.7) |
| No | 61 (7.8) |
| Unclear/missing data | 66 (8.5) |
| β Error prespecified | |
| Yes | 652 (83.5) |
| No | 60 (7.7) |
| Unclear/missing data | 69 (8.8) |
| Sample size prespecified | |
| Yes | 679 (86.9) |
| No | 43 (5.5) |
| Unclear/missing data | 59 (7.6) |
| Allocation concealment method | |
| Central | 711 (91.0) |
| Sealed opaque envelopes | 24 (3.1) |
| Unclear/missing data | 46 (5.9) |
| Dropouts described | |
| Yes | 741 (94.9) |
| No/unclear/missing data | 40 (5.1) |
| Intention-to-treat analysis | |
| Yes | 729 (93.3) |
| No | 14 (1.8) |
| Unclear/missing data | 38 (4.9) |
Abbreviation: COG, cooperative oncology group.
Because of rounding, percentages may not total 100.
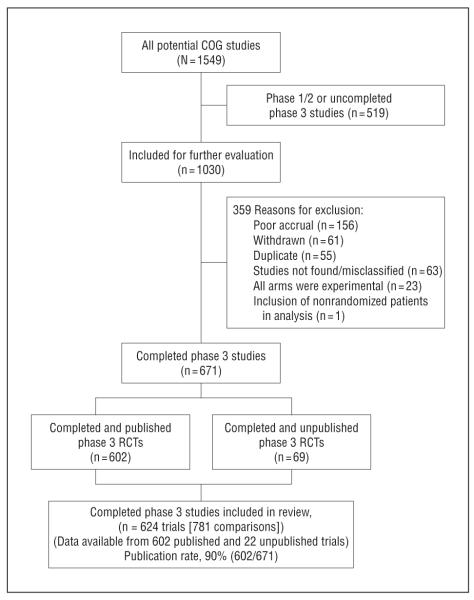
Figure 1 is a flow diagram for the inclusion of trials in our analyses and the publication rate of the trials. Of 671 completed RCTs, 602 (90%) were published. We were able to obtain data from 22 unpublished studies. However, data from 47 unpublished trials were not available for the analysis. These were early trials, records of which appear to have been lost owing to reorganization of COGs. By all accounts, the loss of these records appeared to be a random event. Thus, it is unlikely that the absence of the records on 7% (47 of 671) of the trials had a significant effect on our analysis.
Figure 1.
Inclusion of trials and publication rate. COG indicates cooperative group; RCT, randomized controlled trial.
We were able to assess statistical significance in 743 of the 781 randomized comparisons; investigators’ judgments about overall treatment value were deduced for 766 comparisons, and survival data were available for 614 comparisons.
EVALUATION OF TREATMENT SUCCESSES
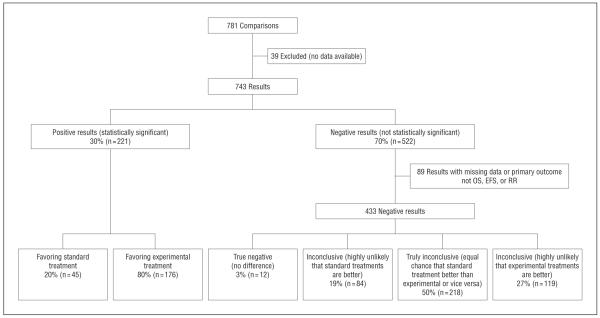
Thirty percent of the results (n=221) were statistically significant. Of these, 20% (n=45) favored the standard treatment and 80% (n=176) favored the experimental treatment. Among nonsignificant findings, 3% (n=12) of the results were true negative, 50% (n=218) were inconclusive, 19% (n=84) were highly unlikely to have been consistent with standard treatments being superior, and 27% (n=119) of interventions were also deemed inconclusive but highly unlikely to have favored experimental treatments (Figure 2).
Figure 2.
Distribution of outcomes by statistical significance of results according to primary outcome. EFS indicates event-free survival; OS, overall survival; and RR, response rate.
The trial investigators concluded that experimental treatments were superior in 41% (n=316) of comparisons, while standard treatments were favored in 59% (n=450) of comparisons (N=766) (Figure 3). In addition, investigators judged that 116 (15%) of trials resulted in discovery of breakthrough interventions. Twelve of 614 trials (2%) identified experimental interventions that reduced death rate by 50% or more.
Figure 3.
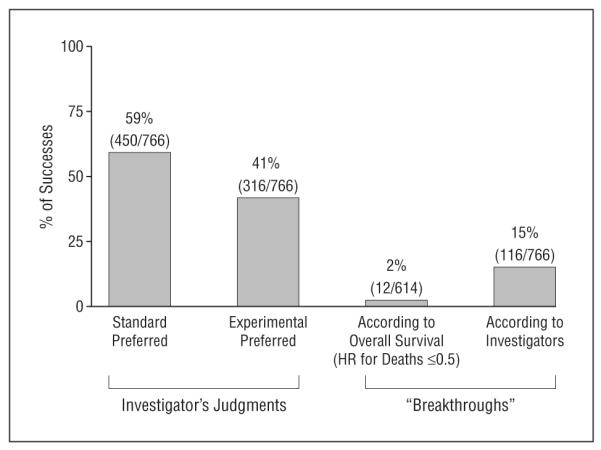
Distribution of outcomes according to the published judgment of the original researchers. “Breakthrough” treatments were defined as those that should replace the existing standard of care or that reduced the death rate by 50% or more. HR indicates hazard ratio.
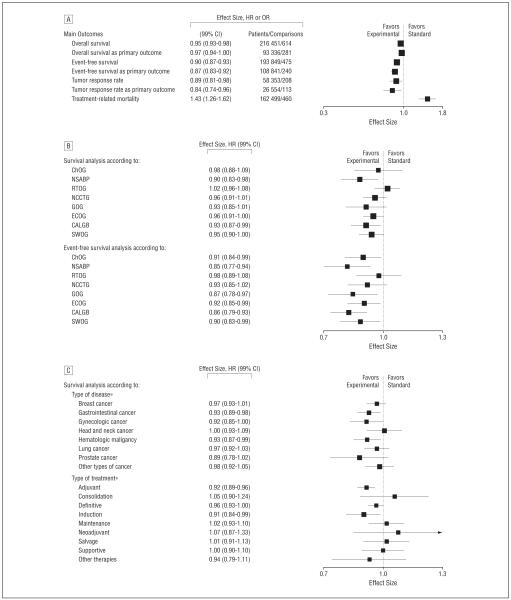
When data were quantitatively pooled, summary estimates for overall survival, event-free survival, and response rate slightly favored the new treatments. The HR for death from any cause was 0.95 (99% CI, 0.93-0.98); for relapse, progression, or death, 0.90 (99% CI, 0.87-0.93); and for response rate, 0.89 (99% CI, 0.81-0.98). Restricting our evaluation to primary outcomes, we also found a slight benefit in favor of new treatments. For the primary outcomes survival (death from any cause) and event-free survival (relapse, progression, or death), HRs were 0.97 (99% CI, 0.94-1.00) and 0.87 (99% CI, 0.83-0.92), respectively. For the primary outcome response rate, OR was 0.84 (99% CI, 0.74-0.96) (Figure 4A). However, new treatments were associated with increased treatment-related mortality (OR, 1.43; 99% CI, 1.26-1.62).
Figure 4.
Evaluation of treatment successes. A, Meta-analysis of main outcomes. B, Overall survival and event-free survival according to cooperative oncology group. C, Sensitivity analysis according to type of treatment and disease. CALGB indicates Cancer and Leukemia Group B; ChOG, Children’s Oncology Groups; ECOG, Eastern Cooperative Oncology Group; GOG, Gynecological Oncology Group; NCCTG, Northern Central Cancer Treatment Group; NSABP, National Surgical Adjuvant Breast and Bowel Project; RTOG, Radiation Therapy Oncology Group; and SWOG, Southwest Oncology Group. Hazard ratios (HRs) are given for time to event data (overall survival and event-free survival) and odds ratios (ORs) for dichotomous data (response rate and treatment-related mortality). Vertical lines indicate lines of no difference between new and standard treatments. Note that a “no difference” result can be obtained when treatments are truly identical, or when experimental treatments are as successful as standard treatments (ie, sometimes new treatments are better and sometimes standard treatments are better). Squares indicate point estimates. Horizontal lines represent 99% confidence interval (CI). Asterisks indicate that the test for heterogeneity between subgroups was statistically significant at P=.05.
SENSITIVITY ANALYSIS
We investigated the robustness of our results as a function of the most important factors that may have affected the overall findings.
Effect of Cooperative Group
For 4 cooperative groups, experimental treatment resulted in slightly improved overall survival, and for 4 cooperative groups, on average, experimental treatments were as likely to be inferior as they were to be superior to standard treatments. Event-free survival from 6 of the 8 cooperative groups, were, on average, better with the use of new treatments (Figure 4B)
Effect of Methodologic Quality and Type of Treatment
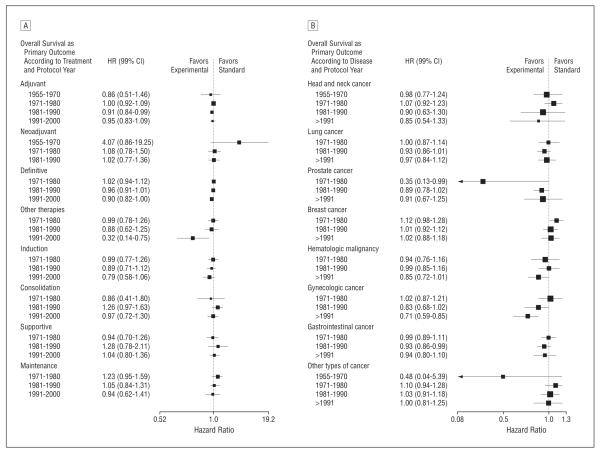
As expected, sensitivity analysis according to the type of treatment and disease indicated that some areas were more successful than others. For example, we found that the use of experimental curative and adjuvant therapies were, on average, associated with largest survival benefits. Similarly, the largest survival improvements were seen in gastrointestinal and hematologic malignant neoplasms (Figure 4C).
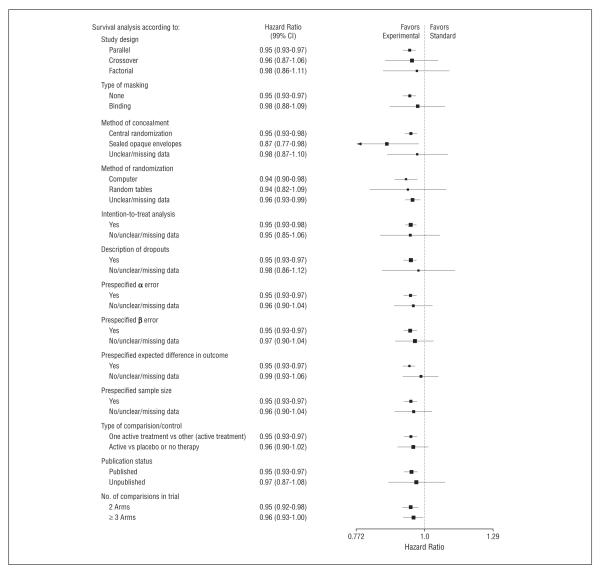
Figure 5 shows the sensitivity analysis for the outcome of overall survival, according to the most important methodologic domains. In general, the methodologic quality of the trials was high and did not influence our findings.
Figure 5.
Sensitivity analysis according to the most important methodologic domains. Vertical lines indicate lines of no difference between new and standard treatments. Note that a “no difference” result can be obtained when treatments are truly identical, or when experimental treatments are as successful as standard treatments (ie, sometimes new treatments are better and sometimes standard treatments are better). Squares indicate point estimates. Horizontal lines represent 99% confidence interval (CI).
PATTERN OF TREATMENT SUCCESSES OVER TIME
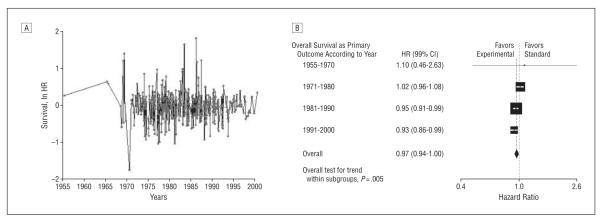
Figure 6 and Figure 7 show a result of time series analysis consistent with a “white noise” pattern, indicating no significant autocorrelation between studies carried out at various time intervals. This shows that each trial represents an independent experiment in a given time. The analysis also shows more consistent effects with fewer outliers in both directions and a slight weighting toward positive findings in more recent times. As suspected, this could be because the sample size over time has increased, resulting in improved precisions of estimates (Spearman ρ=0.32; P<.001).
Figure 6.
Assessment of the pattern of treatment successes over time. A, Time series analysis of treatment effect (natural logarithm of hazard ratio [ln HR]) performed by the National Cancer Institute cooperative oncology groups. “White noise” pattern indicates no significant autocorrelation between studies carried out at various time intervals. An ln HR less than 0 indicates superiority of new treatments; greater than 0, superiority of standard treatments. B, Subgroup analysis stratified by time periods, showing a slight improvement in overall survival over time, unlikely to be clinically meaningful (P for trend=.005). Vertical lines indicate lines of no difference between new and standard treatments. Note that a “no difference” result can be obtained when treatments are truly identical, or when experimental treatments are as successful as standard treatments (ie, sometimes new treatments are better and sometimes standard treatments are better). Squares indicate point estimates. Horizontal lines represent 99% confidence interval (CI).
Figure 7.
Subgroup analysis stratified by time according to type of treatment (A) and type of disease (B). Vertical lines indicate lines of no difference between new and standard treatments. Note that a “no difference” result can be obtained when treatments are truly identical, or when experimental treatments are as successful as standard treatments (ie, sometimes new treatments are better and sometimes standard treatments are better). Squares indicate point estimates. Horizontal lines represent 99% confidence interval (CI).
Subgroup analysis stratified by time periods shows a slight improvement in overall survival over time, unlikely to be clinically meaningful (P for trend=.005) (Figure 6B). Figure 7 shows subgroup analysis stratified by time according to treatment and diseases, respectively. In general, the analysis indicated consistent average treatment effect with slight improvement over time.
MODELING OF THE DISTRIBUTION OF TREATMENT SUCCESS
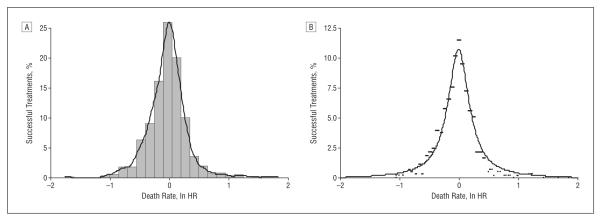
In an attempt to explain the observed results, we hypothesized that investigators cannot predict what they are going to discover in any individual trial that they undertake, ie, sometimes new treatments will be superior to standard treatments, sometimes the reverse, and sometimes no difference will be detected between new and standard treatments.10,11,26,27 Theoretically, the distribution of hazard ratios should then follow a normal distribution (Figure 8A). However, the Shapiro-Wilk test indicated that the results deviated from normality (z=7.97; P<.001). We found that the best fit (r2=95%) to data was obtained by using a simple power law function: y=A/[1+(B×x2)], where y represents the percentage of treatment success with new or standard treatment, respectively, and x is expressed as the natural logarithm of HR (Figure 8B).
Figure 8.
Distribution of treatment success in oncology. A, Although the data resemble normal distribution, the curve significantly deviates from normality (Shapiro-Wilks test: z=7.97; P<.001). B, The best fit was accomplished by using a power law function, y=A/[1+(B×x2)], where y represents the percentage of treatment success with experimental or standard treatment, and x is expressed as natural logarithm of the hazard ratio (ln HR). If ln HR is less than 0, then y predicts success of experimental treatments and vice versa. A=10.76; B=21.87; r2=95%.
COMMENT
We present a comprehensive evaluation of treatment success identified in RCTs conducted by the NCI-funded COG program. Previous research evaluating treatment successes has been limited in a variety of ways. It was typically based on a convenience sample of published studies,2,28 did not evaluate factors that may have affected results such as publication bias14 or methodologic quality,29 was based on a small number of studies,30 had not used a multidimensional methodologic approach in the assessment of treatment success,31 or focused on success rates of individual COGs.10,11,31
Experimental treatments were statistically superior in 24%, and standard treatments were statistically superior in 6% of comparisons (Figure 2). The original researchers, however, concluded that the new treatments were better in 41% of comparisons (Figure 3). The real effect of new treatments compared with standard treatments in terms of patient outcomes such as survival is best measured by quantitative pooling of data. When done this way, new treatments are, on average, found to be slightly superior to standard treatments, with a 5% relative reduction in the death rate (HR, 0.95; 99% CI, 0.93-0.98). This, of course, should not be understood as the average effects of new discoveries being equally spread among all patients. This average 5% relative reduction in death from cancer due to discoveries of new treatments is a combination of some spectacular advances, which in 2% of cases cut the death rate by more than 50%, as well as smaller and moderate improvement in survival (median HR among successful treatments was 0.83, which translates into 17% average death rate reduction). However, successes were offset by an almost symmetrical number of the results favoring standard treatments, including increased treatment-related mortality associated with the use of experimental drugs.
When measured in terms of decrease in death rate, the findings show that the main advances have occurred in the management of gastrointestinal cancer and hematologic malignant neoplasms. This is presumably due to introduction of adjuvant and intensive chemotherapies, respectively. However, a number of other significant advances, which did not necessarily improve survival, were captured by our second measurement method. A typical example was introduction of lumpectomy instead of mastectomy, which resulted in dramatic improvement in the quality of life of women with breast cancer.
A critical issue in interpreting our results is whether they occurred by chance or because of some underlying reasons. We believe that the prediction of therapeutic success can be simplified by considering some of the forces that underlie clinical research.27 On one hand, a continuing increase in scientific discoveries will be possible only if the drive, enthusiasm, and knowledge of the researchers who invest in lengthy, time-consuming, and expensive experiments such as RCTs are maintained, and this means that those researchers probably need to have some belief in the likely success of the new treatments they assess.32 On the other hand, researchers cannot test all their ideas in RCTs. They are constrained by ethical precepts and pragmatic limitations. A key ethical precept is that an RCT should be done only if the physicians and the patients are uncertain about the relative effects of the new and standard treatments to be compared.26,27,33,34 This requirement is referred to as the “uncertainty principle”35 or “equipoise.”36 We have previously postulated the so-called equipoise hypothesis, arguing that treatment successes are a consequence of the predictable relationship between this ethical principle, which underlies study design and conduct, and outcomes of RCTs.10,11,26,27 According to this hypothesis, if the investigators are truly and equally uncertain or indifferent about 2 alternative options,27 theoretically treatment successes should follow a normal distribution.26,27 However, the observed results did not fit a normal distribution. The reason for the deviation of the results from the normal curve is that the previous model had only focused on equipoise (ie, what is the most ethical and rational decision for patients) but did not take into account preferences of researchers toward one of the alternative treatments that are being tested. Both mechanisms are important. This unpredictability in the result of any individual trial and the expectation that there will be a proportionally larger success for new treatments means that the curve describing the probability of treatment success rate is expected to be skewed with a “heavy tail.”37,38 Several mathematical functions can satisfy these qualitative requirements of our model, but a particularly popular one is the power law.37,38 Indeed, the power law had an excellent fit, explaining 95% of model data (r2=0.95) (Figure 8). The power law appears to be ubiquitous and has been found to be applicable to a wide range of natural, economic, and social phenomena, including a distribution of wealth, species size, word frequencies, scientific citation counts, the sizes of various natural events, business firms, and cities.37,38 According to the power law, the majority of successes in cancer will result in small or moderate advances, with occasional discovery of breakthrough interventions.
How efficient is our current system of RCTs in cancer at generating clinical discoveries? In the early 1980s, Mosteller39 estimated that we can expect that innovations will be successful about 50% of the time, which he called a “good investment.” Our results are consistent with Mosteller’s estimates. This is also ethically a welcome finding because, if every RCT found that the new treatments were better, it would destroy the system of RCTs because people would not accept randomization if it meant that they would only get the better treatment if they were in the 50% of patients allocated to the new treatment. Patients would not enroll into such studies; previous research also found that it is unlikely that the public would support an RCT system in which there is greater than a 70% to 80% chance that one of the treatments will be better.40,41 This expected probability of treatment success appears to describe the limits within which we could operate to advance treatment of cancer. For example, when people were asked under what probability of treatment success they would enroll in an RCT (with a 50:50 chance of allocation to successful treatment), only 3% of them stated that they would participate in a trial in which the probability of success is 80:20.40 Most people, however, would accept an RCT to be ethical if the probability of success of experimental treatment is between 50% and 70%.40 Similarly, we found that no institutional review board member would approve RCTs in which the probability of success of one treatment over another is 90% or more, while most of the members would approve the trial with expected probability of success between 40% and 60%.41 Therefore, an estimate of the probability of treatment success is fundamental to the sustenance of the RCT system, because the trials are possible to conduct—and hence bring about the new clinical discoveries—only within a certain range of the expected treatment benefits. Our data indicate the probability of such a treatment success, which seems to be optimal for most people to accept in order to continue to support the clinical trial system. Of note is that the size of treatment effect and proportion of successes have remained within a constant but limited range of plausible values, with more consistent effects seen over time (Figures 6 and 7). Therefore, there are limits to what can be discovered in RCTs: unearthing of new therapeutic success will remain within the constraints of the ethical principle of equipoise.
It can, however, be argued that the pattern of treatment successes described herein pertains to the publicly sponsored trials only, and that industry has higher success owing to more detailed knowledge of the drugs it develops.29 This is a testable hypothesis, which to date has not been satisfactorily answered because of the industry’s unwillingness to share unpublished data.42 Indirectly, one can assess industry drug success rates by determining a proportion of regulatory approval for all phase 3 trials. Measured this way, the technical success rate for drug development is about 50%.43
We also found that, estimating conservatively, 218 of the 743 randomized comparisons (29%) (Figure 2) produced inconclusive findings, ie, failed to answer the question asked. The reasons for such a large number of inconclusive trials are not entirely clear, but they appear not to be related to difficulties in the accrual of patients or other logistical problems, but rather to the researchers’ overly optimistic assessment of the size of treatment effects that they designed their trials to measure.30,44,45 Is this the “right” price for discovery we are making, or can the system be more efficient? When we excluded inconclusive trials from the analysis, the overall success rate did not change, but obviously the number of discoveries in absolute terms decreased. Strikingly, however, the number of inconclusive studies has not changed over time (not shown).
In conclusion, society has received a good return on its investment in the COG system. The public can expect that about 25% to 50% of new cancer treatments that reach the stage of assessment in RCTs will prove to be successful. This pattern of successes has become more consistent over time. However, our results also indicate that the absolute number of discoveries might be improved if the proportion of inconclusive trials is reduced.
Acknowledgments
Funding/Support: This study was supported by Research Program on Research Integrity, Office of Research Integrity, and National Institutes of Health (grants 1R01NS044417-01 and 5 R01 NS052956-02).
Financial Disclosure: Dr Bennett received consulting fees and grant support from Sanofi-Aventis and AMGEN. Dr Bepler received consulting fees and grant support from Eli Lilly and Company and Sanofi-Aventis.
Role of the Sponsor: The sponsor had no role in the design and conduct of the study; collection, management, analysis, and interpretation of the data; or preparation, review, or approval of the manuscript.
Additional Contributions: We sincerely thank the cooperative groups that have openly shared their data with us. Without their help, this project would not have been possible.
REFERENCES
- 1.Jemal A, Siegel R, Ward E, Murray T, Xu J, Thun MJ. Cancer statistics, 2007. CA Cancer J Clin. 2007;57(1):43–66. doi: 10.3322/canjclin.57.1.43. [DOI] [PubMed] [Google Scholar]
- 2.Wittes RE. Therapies for cancer in children: past successes, future challenges. N Engl J Med. 2003;348(8):747–749. doi: 10.1056/NEJMe020181. [DOI] [PubMed] [Google Scholar]
- 3.Collins R, McMahon S. Reliable assessment of the effects of treatment on mortality and major morbidity, I: clinical trials. Lancet. 2001;357(9253):373–380. doi: 10.1016/S0140-6736(00)03651-5. [DOI] [PubMed] [Google Scholar]
- 4.Grann A, Grann VR. The case for randomized trials in cancer treatment: new is not always better. JAMA. 2005;293(8):1001–1003. doi: 10.1001/jama.293.8.1001. [DOI] [PubMed] [Google Scholar]
- 5.National Cancer Institute [Accessed April 17, 2007];2005 Fact Book. http://fmb.cancer.gov/financial/attachments/FY-2005-FACT-BOOK-FINAL.pdf.
- 6.Chalmers I. What is the prior probability of a proposed new treatment being superior to established treatments? BMJ. 1997;314(7073):74–75. doi: 10.1136/bmj.314.7073.74a. [DOI] [PMC free article] [PubMed] [Google Scholar]
- 7.World Medical Association [Accessed April 17, 2007];World Medical Association Declaration of Helsinki. Ethical Principles for Medical Research Involving Human Subjects. doi: 10.1191/0969733002ne486xx. http://www.wma.net/e/policy/b3.htm. [DOI] [PubMed]
- 8.Johnston SC, Rootenberg JD, Katrak S, Smith WS, Elkins JS. Effect of a US National Institutes of Health programme of clinical trials on public health and costs. Lancet. 2006;367(9519):1319–1327. doi: 10.1016/S0140-6736(06)68578-4. [DOI] [PubMed] [Google Scholar]
- 9.Soares H, Kumar A, Clarke M, Djulbegovic B. How long does it takes to publish a high quality trial in oncology?. Paper presented at: XIII Cochrane Colloquium; Melbourne, Australia. October 24, 2005. [Google Scholar]
- 10.Kumar A, Soares H, Wells R, et al. Are experimental treatments for cancer in children superior to established treatments? observational study of randomised controlled trials by the Children’s Oncology Group. BMJ. 2005;331(7528):1295. doi: 10.1136/bmj.38628.561123.7C. [DOI] [PMC free article] [PubMed] [Google Scholar]
- 11.Soares HP, Kumar A, Daniels S, et al. Evaluation of new treatments in radiation oncology: are they better than standard treatments? JAMA. 2005;293(8):970–978. doi: 10.1001/jama.293.8.970. [DOI] [PMC free article] [PubMed] [Google Scholar]
- 12.Egger MSD, Altman D. Systematic Reviews in Health Care: Meta-analysis in Context. 2nd ed BMJ; London, England: 2001. [Google Scholar]
- 13.Djulbegovic B, Lacevic M, Cantor A, et al. The uncertainty principle and industry-sponsored research. Lancet. 2000;356(9230):635–638. doi: 10.1016/S0140-6736(00)02605-2. [DOI] [PubMed] [Google Scholar]
- 14.Als-Nielsen B, Chen W, Gluud C, Kjaergard LL. Association of funding and conclusions in randomized drug trials: a reflection of treatment effect or adverse events? JAMA. 2003;290(7):921–928. doi: 10.1001/jama.290.7.921. [DOI] [PubMed] [Google Scholar]
- 15.Hedges LV, Olkin I. Statistical Methods for Meta-analysis. Academic Press; San Diego, CA: 1985. [Google Scholar]
- 16.Dickersin K. How important is publication bias? a synthesis of available data. AIDS Educ Prev. 1997;9(1suppl):15–21. [PubMed] [Google Scholar]
- 17.Jüni P, Altman DG, Egger M. Systematic reviews in health care: assessing the quality of controlled clinical trials. BMJ. 2001;323(7303):42–46. doi: 10.1136/bmj.323.7303.42. [DOI] [PMC free article] [PubMed] [Google Scholar]
- 18.Mann H, Djulbegovic B. Choosing a control intervention for a randomised clinical trial. BMC Med Res Methodol. 2003;3(1):7. doi: 10.1186/1471-2288-3-7. [DOI] [PMC free article] [PubMed] [Google Scholar]
- 19.National Cancer Institute [Accessed December 22, 2007];Cancer trials. http://cancertrials.nci.nih.gov/clinical trials.
- 20.Altman DG, Schulz KF, Moher D, et al. The revised CONSORT statement for reporting randomized trials: explanation and elaboration. Ann Intern Med. 2001;134(8):663–694. doi: 10.7326/0003-4819-134-8-200104170-00012. [DOI] [PubMed] [Google Scholar]
- 21.Soares HP, Daniels S, Kumar A, et al. Bad reporting does not mean bad methods for randomised trials: observational study of randomised controlled trials performed by the Radiation Therapy Oncology Group. BMJ. 2004;328(7430):22–24. doi: 10.1136/bmj.328.7430.22. [DOI] [PMC free article] [PubMed] [Google Scholar]
- 22.Djulbegovic B, Cantor A, Clarke M. The importance of preservation of the ethical principle of equipoise in the design of clinical trials: relative impact of the methodological quality domains on the treatment effect in randomized controlled trials. Account Res. 2003;10(4):301–315. doi: 10.1080/714906103. [DOI] [PubMed] [Google Scholar]
- 23.Rothman KJ, Michels KB. The continuing unethical use of placebo controls. N Engl J Med. 1994;331(6):394–398. doi: 10.1056/NEJM199408113310611. [DOI] [PubMed] [Google Scholar]
- 24.StataCorp. Stata Statistical Software. Release 9 StataCorp LP; College Station, TX: 2006. [Google Scholar]
- 25.TableCurve 2D [computer program] Systat Software Inc; San Jose, CA: 2002. [Google Scholar]
- 26.Djulbegovic B. Acknowledgment of uncertainty: a fundamental means to ensure scientific and ethical validity in clinical research. Curr Oncol Rep. 2001;3(5):389–395. doi: 10.1007/s11912-001-0024-5. [DOI] [PubMed] [Google Scholar]
- 27.Djulbegovic B. Articulating and responding to uncertainties in clinical research. J Med Philos. 2007;32(2):79–98. doi: 10.1080/03605310701255719. [DOI] [PubMed] [Google Scholar]
- 28.Chlebowski RT, Lillington LM. A decade of breast cancer clinical investigation: results as reported in the Program/Proceedings of the American Society of Clinical Oncology. J Clin Oncol. 1994;12(9):1789–1795. doi: 10.1200/JCO.1994.12.9.1789. [DOI] [PubMed] [Google Scholar]
- 29.Peppercorn J, Blood E, Winer E, Partridge A. Association between pharmaceutical involvement and outcomes in breast cancer clinical trials. Cancer. 2007;109(7):1239–1246. doi: 10.1002/cncr.22528. [DOI] [PubMed] [Google Scholar]
- 30.Machin D, Stenning S, Parmar M, et al. Thirty years of Medical Research Council randomized trials in solid tumours. Clin Oncol (R Coll Radiol) 1997;9(2):100–114. doi: 10.1016/s0936-6555(05)80448-0. [DOI] [PubMed] [Google Scholar]
- 31.Joffe S, Harrington DP, George SL, Emanuel EJ, Budzinski LA, Weeks JC. Satisfaction of the uncertainty principle in cancer clinical trials: retrospective cohort analysis. BMJ. 2004;328(7454):1463. doi: 10.1136/bmj.38118.685289.55. [DOI] [PMC free article] [PubMed] [Google Scholar]
- 32.Murray C. Human Accomplishment: The Pursuit of Excellence in the Arts and Sciences, 800 BC to 1950. HarperCollins Inc; New York, NY: 2003. [Google Scholar]
- 33.Chalmers I. Well informed uncertainties about the effects of treatments. BMJ. 2004;328(7438):475–476. doi: 10.1136/bmj.328.7438.475. [DOI] [PMC free article] [PubMed] [Google Scholar]
- 34.Edwards SJL, Lilford RJ, Braunholtz DA, Jackson JC, Hewison J, Thornton J. Ethical issues in the design and conduct of randomised controlled trials. Health Technol Assess. 1998;2(15):i–vi. 1–132. [PubMed] [Google Scholar]
- 35.Peto R, Baigent C. Trials: the next 50 years. BMJ. 1998;317(7167):1170–1171. doi: 10.1136/bmj.317.7167.1170. [DOI] [PMC free article] [PubMed] [Google Scholar]
- 36.Freedman B. Equipoise and the ethics of clinical research. N Engl J Med. 1987;317(3):141–145. doi: 10.1056/NEJM198707163170304. [DOI] [PubMed] [Google Scholar]
- 37.Watts DJ. The “new” science of networks. Annu Rev Sociol. 2004 August;30:243–270. doi:10.1146/annurev.soc.30.020404.104342. [Google Scholar]
- 38.Newman MEJ. Power laws, Pareto distributions and Zipf’s law. Contemp Phys. 2005;46(5):323–351. [Google Scholar]
- 39.Mosteller F. Innovation and evaluation. Science. 1981;211(4485):881–886. doi: 10.1126/science.6781066. [DOI] [PubMed] [Google Scholar]
- 40.Johnson N, Lilford JR, Brazier W. At what level of collective equipoise does a clinical trial become ethical? J Med Ethics. 1991;17(1):30–34. doi: 10.1136/jme.17.1.30. [DOI] [PMC free article] [PubMed] [Google Scholar]
- 41.Djulbegovic B, Bercu B. At what level of collective equipoise does a clinical trial become ethical for the IRB members?. Paper presented at: USF Third National Symposium, Bioethical Considerations in Human Subject Research; Clearwater, FL. March 8, 2002. [Google Scholar]
- 42.Lexchin J, Bero LA, Djulbegovic B, Clark O. Pharmaceutical industry sponsorship and research outcome and quality: systematic review. BMJ. 2003;326(7400):1167–1170. doi: 10.1136/bmj.326.7400.1167. [DOI] [PMC free article] [PubMed] [Google Scholar]
- 43.DiMasi JA, Grabowski HG. Economics of new oncology drug development. J Clin Oncol. 2007;25(2):209–216. doi: 10.1200/JCO.2006.09.0803. [DOI] [PubMed] [Google Scholar]
- 44.Chalmers I, Matthews R. What are the implications of optimism bias in clinical research? Lancet. 2006;367(9509):449–450. doi: 10.1016/S0140-6736(06)68153-1. [DOI] [PubMed] [Google Scholar]
- 45.Kumar A, Soares H, Djulbegovic B. High proportion of high quality trials conducted by the NCI are negative or inconclusive. Paper presented at: XIII Cochrane Colloquium; Melbourne, Australia. October 25, 2005. [Google Scholar]


