

Abstract
Background/Aims
The importance of epigenetic changes in etiology and pathogenesis of disease has been increasingly recognized. However, the role of epigenetic alterations in the genesis of hepatic steatosis and cause of individual susceptibilities to this pathological state are largely unknown.
Methods
Male inbred C57BL/6J and DBA/2J mice were fed a lipogenic methyl-deficient diet (MDD) that causes liver injury similar to human nonalcoholic steatohepatitis (NASH) for 6, 12, or 18 weeks, and the status of global and repetitive elements cytosine methylation, histone modifications, and expression of proteins responsible for those epigenetic modifications in livers was determined.
Results
The development of hepatic steatosis in inbred C57BL/6J and DBA/2J mice was accompanied by prominent epigenetic abnormalities. This was evidenced by pronounced loss of genomic and repetitive sequences cytosine methylation, especially at major and minor satellites, accompanied by the increased levels of repeat-associated transcripts, aberrant histone modifications, and alterations in expression of the maintenance DNA methyltransferase 1 (DNMT1) and de novo DNMT3A proteins in the livers of both mouse strains. However, the DBA/2J mice, which were characterized by initially lower degree of methylation of repetitive elements and lower extent of histone H3 lysine 9 (H3K9) and H3 lysine 27 (H3K27) trimethylation in the normal livers, as compared to those in the C57BL/6J mice, developed more prominent NASH-specific pathomorphological changes.
Conclusions
These results mechanistically link epigenetic alterations to the pathogenesis of hepatic steatosis and strongly suggest that differences in the cellular epigenetic status may be a predetermining factor to individual susceptibilities to hepatic steatosis.
Keywords: Hepatic steatosis, nonalcoholic steatohepatitis, DNA methylation, histone modifications, disease susceptibility
1. Introduction
Current trends in biomedical research are moving toward elucidating the molecular mechanisms, cellular pathways, networks, and processes that underlie the disease development. Specifically, during recent years much effort has been devoted to uncover the fundamental mechanisms associated with individual susceptibilities to any given pathological state, including nonalcoholic steatohepatitis (NASH), a progressive form of nonalcoholic fatty liver disease, characterized by lipid accumulation in the liver, inflammation, hepatocellular damage and fibrosis [1,2]. This has a great significance for identifying vulnerable subpopulations and for establishing new prevention strategies [3].
In the post-genomic era, mice have become the predominant experimental animal model for many aspects of biomedical research because they share many physiological, anatomical, and metabolic properties with humans [4,5]. Furthermore, genetically defined inbred mice represent a broad genetic diversity similar to the human population, which allows the investigation of important aspects of individual susceptibilities to disease development [6]. Indeed, it has been demonstrated that inbred strains of mice differ greatly in their susceptibility to NASH [6,7]. Likewise, genetic factors greatly influence individual susceptibility to NASH [2] in humans. It is widely believed that genetic variations that underlie disease susceptibility have a great impact on phenotype through disruption of various metabolic pathways [4,8] and different susceptibility to NASH may be associated primarily with differences in the genetically-predetermined phenotype [7].
During the past decade, the role of epigenetic mechanisms in etiology and pathogenesis of disease has been increasingly recognized [9]. These epigenetic mechanisms, particularly methylation of DNA and modifications of the histones’ amino-terminal tails, are essential for the proper maintenance of cellular homeostasis. The epigenetic status in normal cells is accurately maintained and balanced, and disruption of this balance leads to the development of a wide range of human pathologies [9]. However, the role of epigenetic alterations in the genesis of hepatic steatosis and the cause of the individual-to-individual variation in sensitivity to NASH are largely unknown. The results of several studies have demonstrated that mouse inter-strain differences in sensitivity to liver injury and liver carcinogenesis induced by phenobarbital are inversely related to the capacity to maintain normal patterns of hepatic DNA methylation [10]. Likewise, resistance to 2-acetylaminofluorene-induced liver carcinogenesis in female Sprague-Dawley rats is associated with a greater level of histone H3K9 and histone H4K20 trimethylation in the livers when compared to sensitive male rats [11]. These findings suggest that differences in the cellular epigenetic status may be a predetermining factor to different susceptibilities to hepatic steatosis.
In light of these considerations, the present study was undertaken to: 1) define the role of epigenetic alterations, such as DNA methylation and histone modifications, in the genesis of hepatic steatosis in mice, a pathological state that is similar to human NASH; and 2) determine whether or not strain-specific susceptibility of mice to hepatic steatosis is associated with differences in individual epigenetic phenotypes.
2. Materials and methods
2.1. Animals, diets, and experimental design
In the initial experiment, we determined the epigenetic profile in the male BALB/CJ, C3H/HeJ, A/J, AKR/J, C57BL/6J, and DBA/2J mice livers (Jackson Laboratory, Bar Harbor, ME). For the main study, male C57BL/6J and DBA/2J mice (Jackson Laboratory) were housed in sterilized cages in a temperature-controlled (24°C) room with a 12 hour light/dark cycle, and given ad libitum access to purified water and NIH-31 pelleted diet (Purina Mills, Richmond, IN). At eight weeks of age, the mice from each strain were allocated randomly into two groups, one control and one experimental. The mice from the experimental groups were maintained on a low methionine (0.18%) diet, lacking in choline and folic acid (Dyets, Inc, Bethlechem, PA) for 18 weeks. The mice from the control groups received diet supplemented with 0.4% methionine, 0.3% choline bitartrate, and 2 mg/kg folic acid. Diets were stored at 4°C and given ad libitum, with twice a week replacement. Five experimental and five control mice were sacrificed at 6,12, and 18 weeks after diet initiation. All animal experimental procedures were carried out in accordance with the animal study protocol approved by the National Center for Toxicological Research Animal Care and Use Committee.
2.2. Necropsy, tissue processing, and histopathology
At the completion of the designated experimental intervals, mice were euthanized humanely using CO2. The livers were excised and a slice of the medial lobe was fixed in 10% neutral buffered formalin for 48 hours for histopathologic examination. The remaining liver was frozen immediately in liquid nitrogen and stored at −80°C for subsequent analyses. The formalin-fixed liver slices were further processed and embedded in Tissue Prep II paraffin, sectioned at 4 microns, mounted on a glass slide, and stained with hematoxylin and eosin, and coverslipped. The liver sections were evaluated for steatosis, hepatocellular degeneration, inflammation, hepatocellular karyocytomegaly and oval cell proliferation, and scored using a severity score system for each of the morphologic parameters as follows: grade 0, none present; grade 1, minimal; grade 2, mild; grade 3, moderate; grade 4, marked; and grade 5, severe changes.
2.3. Determination of hepatic triglycerides content
Hepatic triglycerides were extracted by homogenizing 20 mg of liver tissue in 500 µl of isopropyl alcohol. Next, 4 µl of extract was used for subsequent analysis. The level of triglycerides was determined by using Wako L-Type TG-M Assay Kit (Wako Diagnostic, Richmond, VA) according to the manufacturer's instruction.
2.4. Determination of global DNA methylation by cytosine extension assay
The extent of global DNA methylation was evaluated with a cytosine extension assay as described in Pogribny et al. [12].
2.5. Determination of hepatic methionine, S-adenosyl-L-methionine (SAM), and S-adenosyl-L-homocysteine (SAH) content
The determination of methionine, SAM, and SAH content in liver tissue extracts was performed by a HPLC method with coulometric electrochemical detection as previously described [13].
2.6. Quantitative PCR (qPCR) methylation analysis of DNA repetitive sequences
The methylation analysis of repetitive elements of mouse genome, including major and minor satellites, intracesternal A particle (IAP), long interspersed elements (LINEs), and short interspersed elements (SINEs), was determined by methylation-sensitive McrBC-qPCR assay as described previously [14]. Genomic DNA (1µg) was digested overnight with the methylation-specific restriction enzyme McrBC (New England Biolabs, Ipswich, MA) and then analyzed by qPCR with primers described in Martens et al. [13]. Two-step qPCR was performed using a SYBR® GreenER™ SuperMix (Invitrogen, Carlsbad, CA) for iCycler (Bio-Rad, Hercules, CA) with 40 cycles of 45 sec at 95°C and 90 sec at 58°C. After the final cycle, melting curve analysis of all samples was conducted within the range of 55–95°C. All reactions were run in triplicate. The threshold cycle (Ct) is defined as the fractional cycle number that passes the fixed threshold. The Ct values for each repetitive element were converted into absolute amount of input DNA using the absolute standard curve method. An increased amount of input DNA after digestion with McrBC is indicative of hypomethylation, whereas a decreased amount of input DNA is indicative of hypermethylation.
2.7. Quantitative reverse transcription-PCR (qRT-PCR)
Total RNAs were isolated from the liver tissue using TRI Reagent (Ambion, Austin, TX) according to the manufacturer's instruction. The levels of repeat-associated and carnitine palmitoyltransferase 1a (Cpt1a) gene transcripts were determined by qRT-PCR as described previously [7,14]. Relative quantification of gene expression was performed by using glyceraldehyde-3-phosphate dehydrogenase (Gapdh) as an internal control. The 2−ΔΔCt method was used for calculating the relative amount of the target RNA [15]. The qRT-PCR was performed at least three times and always included a no-template sample as a negative control.
2.8. Western immunoblot analysis of histone modifications
The levels of histone macroH2A and status of H3K9me3, H3K27me3, and histone H4K20me3 in mouse livers were determined by Western immunoblot analysis as described previously [16].
2.9. Western immunoblot analysis of protein expression
The liver protein levels of DNMT1, DNMT3A, methyl-CpG-binding protein MeCP2, histone lysine methyltransferases (KMT) Suv39h1, Suv4-20h2, and RIZ1, and β-actin were determined by Western immunoblot analysis as described previously [16].
2.10. Statistical analysis
Results are presented as mean ± S.D and were assessed by two-way analysis of variance (ANOVA) using treatment and weeks as fixed factors, or one-way ANOVA using treatment as the fixed factor. P-values < 0.05 were considered significant.
3. Results
3.1. Epigenetic profiling reveals strain-specific differences in the livers of inbred mice
Analysis of the epigenetic status in the livers of BALB/CJ, C3H/HeJ, A/J, AKR/J, C57BL/6J, and DBA/2J mice revealed the substantial strain-to-strain differences in the degree of cytosine methylation and histone modification patterns (Table 1). The most prominent strain-specific epigenetic differences were detected in DBA/2J mice compared to A/J, AKR/J, BALB/CJ, C3H/HeJ, and C57BL/6J strains. Interestingly, the epigenetic profile in the normal livers of DBA/2J mice was similar to that detected in livers of animals that had been exposed to non-genotoxic liver carcinogens peroxisome proliferator WY-14,643 or a methyl-deficient diet [17,18]. Based on these criteria, for the main study we selected DBA/2J mice as strain that may be sensitive to the development of hepatic steatosis. From the three potentially resistant strains, BALB/CJ, C3H/HeJ, and C57BL/6J, that are characterized by a similar liver epigenetic phenotype, for our main study we selected C57BL/6J mice based on evidence that this strain is characterized by a greater extent of methylation of highly active IAP elements (Table 1).
Table 1.
Epigenetic profile of the livers of six inbred mouse strains (mean±S.D., n=3).
| Epigenetic modification |
Strains | ||||||
|---|---|---|---|---|---|---|---|
| BALB/CJ | C3H/HeJ | A/J | AKR/J | C57BL/6J | DBA/2J | ||
| DNA methylationa | 3.84 ± 0.18 | 3.65 ± 0.22 | 4.33 ± 0.28 | 3.09 ± 0.18 | 3.62 ± 0.18 | 3.33 ± 0.13 | |
| Major satellitesb | 0.386 ± 0.037 | 0.451 ± 0.026 | 0.488 ± 0.213 | 0.346 ± 0.068 | 0.433 ± 0.077 | 0.411 ± 0.150 | |
| Minor satellitesb | 5.48 ± 0.27 | 9.84 ± 1.88 | 7.90 ± 0.77 | 5.17 ± 0.53 | 8.26 ± 0.22 | 14.8 ± 2.4 | |
| LINE1-ORF2b | 2.88 ± 0.36 | 3.55 ± 0.30 | 4.02 ± 0.65 | 2.56 ± 0.46 | 3.65 ± 0.64 | 3.99 ± 1.01 | |
| SINE B1b | 4.44 ± 0.27 | 6.58 ± 0.36 | 5.53 ± 1.34 | 3.90 ± 0.54 | 5.60 ± 1.41 | 5.91 ± 1.75 | |
| SINE B2b | 10.5 ± 3.0 | 13.5 ± 1.4 | 11.6 ± 2.9 | 8.53 ± 1.25 | 12.0 ± 2.5 | 11.2 ± 3.7 | |
| IAP-GAGb | 0.048 ± 0.017 | 0.043 ± 0.007 | 0.073 ± 0.016 | 0.024 ± 0.005 | 0.024 ± 0.002 | 0.049 ± 0.016 | |
| H3K9me3c | 118 ± 2 | 142 ± 5 | 155 ± 3 | 26 ± 1 | 141 ± 4 | 46 ± 11 | |
| H3K27me3c | 163 ± 11 | 191 ± 3 | 194 ± 6 | 155 ± 10 | 154 ± 12 | 123 ± 10 | |
| H4K20me3c | 110 ± 4 | 85 ± 4 | 126 ± 5 | 118 ± 2 | 118 ± 3 | 116 ± 6 | |
dpm/µg DNAx103, as detected by the cytosine extension assay;
ng DNA, as detected by the methylation-sensitive quantitative McrBC-real time PCR;
DLU (digital lights units), as detected by Western.
3.2. Histopathology of liver of C57BL/6J and DBA/2J mice fed a MDD
The administration of a MDD to C57BL/6J and DBA/2J mice for 18 weeks resulted in fatty changes in the liver parenchyma (Figure 1). The presence of steatosis in the livers of mice fed a MDD was also evidenced by a pronounced increase in the hepatic triglyceride concentrations in both mouse strains; however, the level of triglycerides in DBA/2J mice was significantly greater than in C57BL/6J mice (Figure 1B). Additionally, livers of mice fed a MDD were characterized by significant hepatocellular degeneration and necrosis, liver inflammation, karyocytomegaly, enlarged hepatocytes with enlarged nuclei and oval cell proliferation (Figure 1A). These liver effects were progressive with duration time on diet being most severe overall in the DBA/2J mice fed a MDD for 18 weeks was substantially greater compared to those parameters in C57BL/6J mice (Table 2).
Figure 1. Histomorphological changes (A) and triglyceride concentrations (B) in the livers of C57BL/6J and DBA/2J mice fed a methyl-deficient diet for 18 weeks.
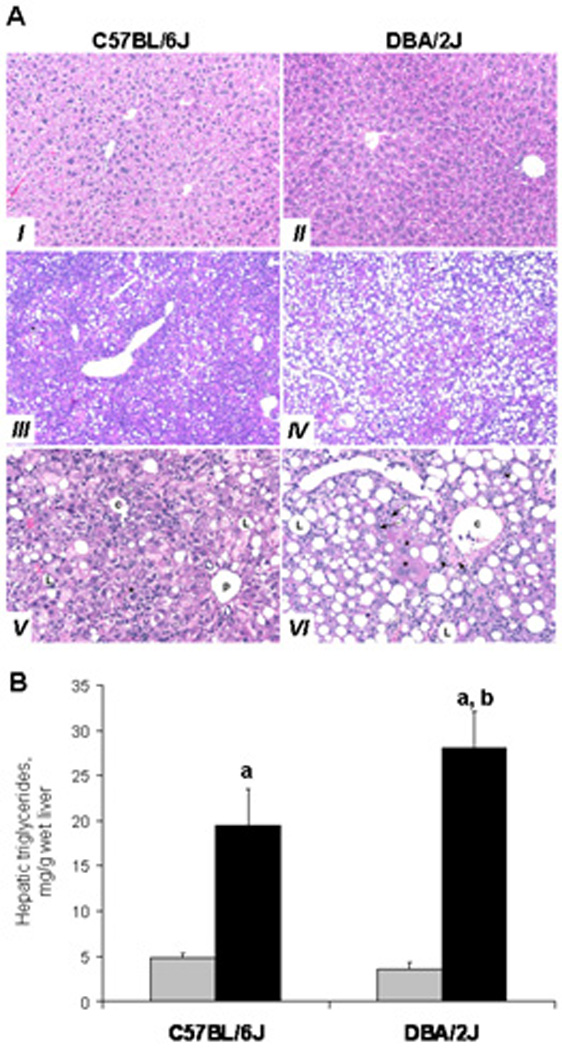
(A) Normal liver from a control C57BL/6J (I) and DBA/2J (II) mice. Representative histopathological changes in the livers of methyl-deficient C57BL/6J (III, IV) and DBA/2J (IV, VI) mice. Diffuse marked macrovesicular steatosis, grade 4, in C57BL/6J (III) and grade 5 in DBA/2J (IV) mice. Hepatic centrilobular region with typical changes in the livers of methyl-deficient DBA/2J mice (VI). Depleted (necrotic) hepatocytes replaced by fibrosis (short arrow), inflammation (arrow heads), and oval cell proliferation (long arrows). Note megalocytosis (karyocytomegally) of hepatocytes (*). Similar, but milder lesions observed in the livers of methyl-deficient C57BL/6J mice (V).
(III) and (IV). Original magnification 50x; (I), (II), (V), and (VI) – Original magnification 200x. c- centrilobular region, p – periportal region, L – lipid vacuole.
The hepatic triglycerides concentrations are presented as mean ± S.D. (n=5) relative to control at the same time point. a – Significantly different from control at the same time point; b - significantly different from C57BL/6J mice fed a methyl-deficient diet at the same time point.
Table 2.
Summary of pathomorphological changes in the livers of C57BL/6J and mice fed a methyl-deficient diet for 18 weeks (mean ± S.D., n=5).
| Morphology | Histopathology score | |
|---|---|---|
| DBA/2J | C57BL/6J | |
| Steatosis | 4.8 ± 0.4* | 3.8 ± 0.8 |
| Necrosis | 3.8 ± 0.4* | 2.0 ± 0.7 |
| Inflammation | 2.0 ± 0.1 | 2.4 ± 0.9 |
| Oval cell hyperplasia | 2.6 ± 0.5* | 1.4 ± 0.5 |
| Karyocytomegaly | 2.4 ± 0.6* | 1.0 ± 0.1 |
Significantly different from C57BL/6J mice fed a MDD.
3.3. Effects of a MDD on the DNA methylation in the livers of C57 BL/6J and DBA/2J mice
In the livers of control C57BL/6J and DBA/2J mice, the extent of DNA methylation did not change over the 18 week period (Figure 2). In the livers of mice fed a MDD, DNA became progressively demethylated, as evidenced from an increase in incorporation of [3H]dCTP into HpaII-digested DNA. However, the magnitude of DNA hypomethylation in the livers of methyl-deficient DBA/2J mice was more pronounced compared to the C57BL/6J strain, with the difference between strains being significant after 18 weeks on diet (Figure 2). Interestingly, the more pronounced loss of DNA methylation in the livers of DBA/2J mice cannot be explained by a difference in hepatic methyl-donor metabolism (Figure 3). This was evidenced by greater levels of methionine and SAM in the livers of control DBA/2J mice as compared to age-matched C57BL/6J mice (Figures 3A and 3B), and by a greater accumulation of SAH, a potent inhibitor of all cellular methylation reactions, in the livers of methyl-deficient C57BL/6J mice than in DBA/2J mice (Figure 3C). Additionally, we determined the effect of methyl-deficiency on the extent of cytosine methylation at GC-rich DNA domains. For this purpose, DNA was isolated from control and methyl-deficient mice after 18 weeks of deficiency was digested with AscI, BssHII, or NarI methylation-sensitive restriction endonucleases, whose recognition sequences occur predominantly at GC-rich regions. Similarly to global DNA hypomethylation, feeding a MDD resulted in substantial loss of cytosine methylation at GC-rich domains, especially in the livers of DBA/2J mice (Supplementary Figure 1).
Figure 2. Level of global DNA methylation in the livers of C57BL/6J and DBA/2J mice fed a methyl-deficient diet for 18 weeks and age-matched control mice.
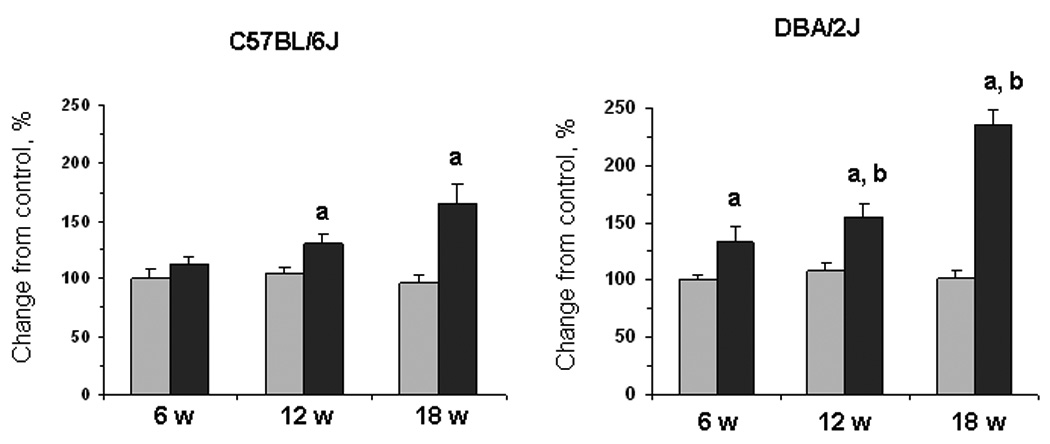
The DNA methylation status in the livers of control mice (gray bars) and mice fed a methyl-deficient diet (black bars) was assessed using [3H]dCTP extension assay after digestion of genomic DNA with methylation-sensitive restriction endonuclease HpaII that cleaves CCGG sequences when internal cytosine residues are unmethylated on both strands. The extent of [3H]dCTP incorporation is directly proportional to the number of unmethylated CpG sites. Data are presented as mean ± S.D. (n=5) relative to control at the same time point. a – Significantly different from control at the same time point; b - significantly different from C57BL/6J mice fed a methyl-deficient diet at the same time point.
Figure 3. Levels of methionine (A), SAM (B), SAH (C), and SAM/SAH ratio (D) in the livers of C57BL/6J and DBA/2J mice fed a methyl-deficient diet for 18 weeks and age-matched control mice.
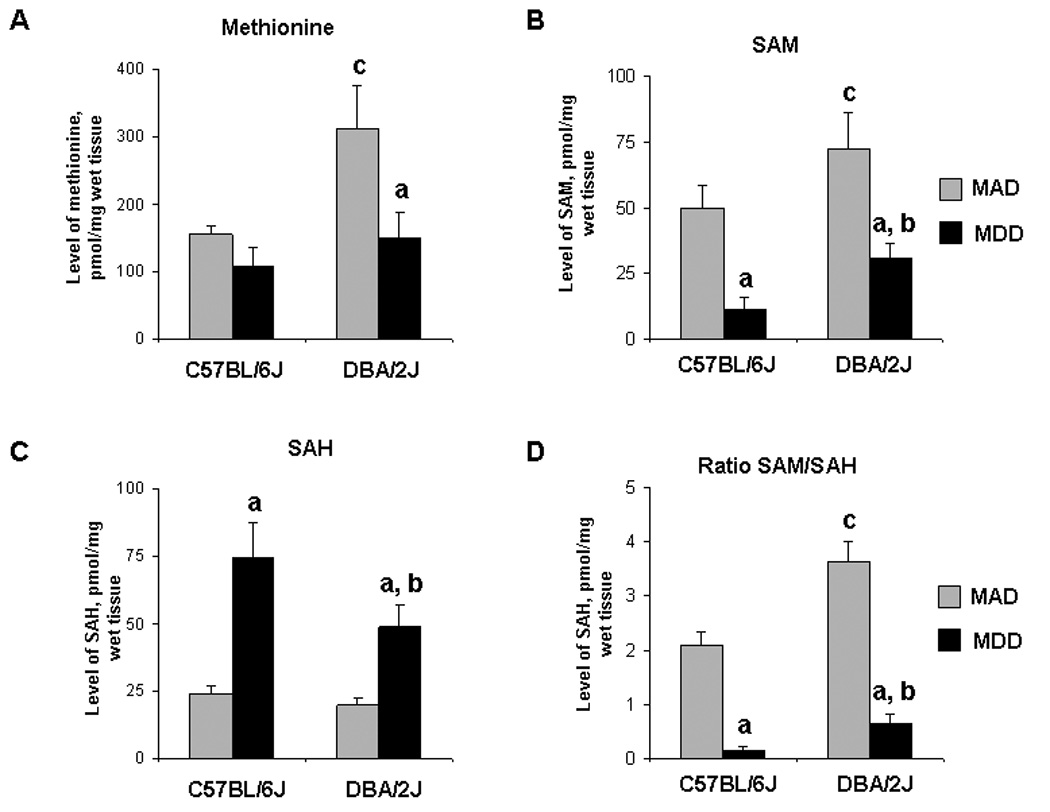
Data is presented as mean ± S.D. (n=5) relative to control at the same time point. a – Significantly different from control at the same time point; b - significantly different from C57BL/6J mice fed a methyl-deficient diet at the same time point; c - significantly different from control C57BL/6J mice.
3.4. Effects of a MDD on the extent of methylation of repetitive DNA elements
One of the primary functions of DNA methylation in normal cells is safeguarding the genome by silencing repetitive DNA elements [19], and global DNA hypomethylation is generally reflective of decreased methylation in those repetitive sequences [20]. In view of this, we measured the methylation status of major and minor satellites, LINE1, SINEs, and IAP elements that compose the majority of the mouse genome. Figure 4 shows the substantial loss of cytosine methylation at major and minor satellites, LINE1, SINEs, and IAP elements in the livers of both mouse strains after 18 weeks of methyl deficiency. More importantly, feeding a MDD caused a greater loss of cytosine methylation of all analyzed repetitive elements, especially major and minor satellites, in DBA/2J mice compared to C57BL/6J mice.
Figure 4. Level of DNA methylation of repetitive elements in the livers of C57BL/6J and DBA/2J mice fed a methyl-deficient diet for 18 weeks and age-matched control mice.
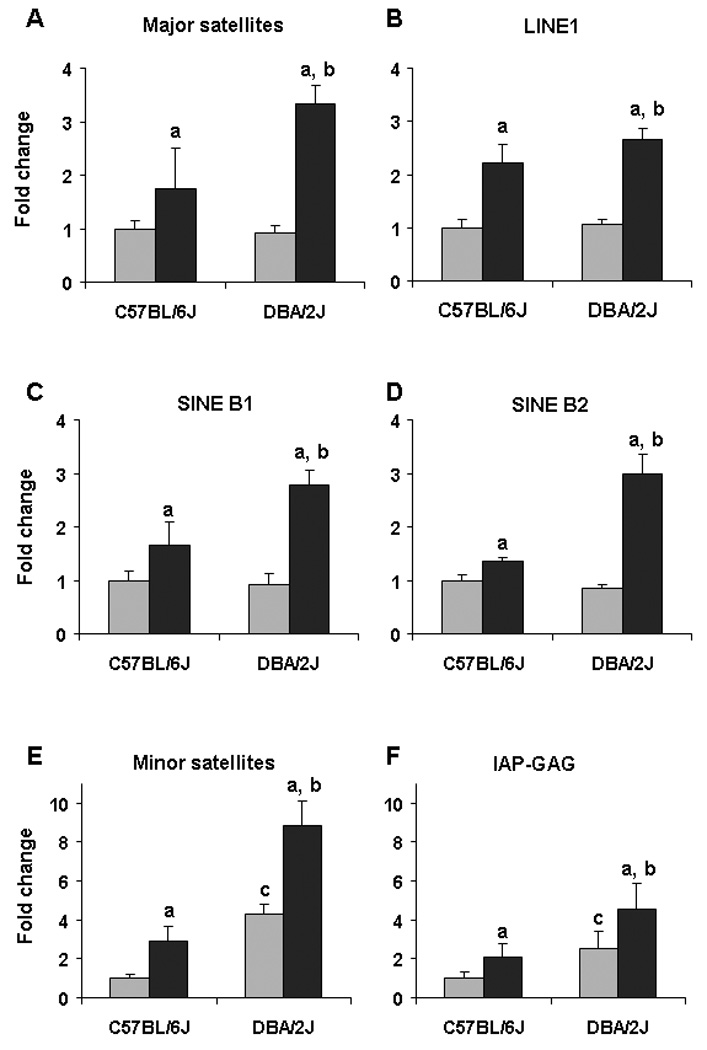
The DNA methylation status of major and minor satellites, IAP, LINE, and SINE elements in the livers of control mice (gray bars) and mice fed a methyl-deficient diet (black bars) was assessed using the methylation-sensitive McrBC-qPCR assay as detailed in “Materials and methods”. McrBC is a methylation-specific endonuclease, which, as opposed to methylation-sensitive restriction enzymes, cleaves DNA containing 5-methylsytosine residues on one or both strands but will not act on unmethylated DNA. Because of that a greater PCR product recovery, evidenced by lower Ct value, after pretreatment of DNA with McrBC, is indicative of hypomethylation. Data is presented as mean ± S.D. (n=5) relative to control at the same time point. a – Significantly different from control at the same time point; b - significantly different from C57BL/6J mice fed a methyl-deficient diet at the same time point; c - significantly different from control C57BL/6J mice.
3.5. Effects of a MDD on expression of repeat-associated transcripts
Since loss of cytosine methylation at repetitive elements could be linked to the increased expression of repeat-associated transcripts [21,22], we determined the levels of major-, minor-, LINE-, SINE-, and IAP-transcripts in the livers of C57BL/6J and DBA/2J mice fed a methyl-deficient diet. The expression of all analyzed repetitive elements in the livers of C57BL/6J mice, fed a MDD did not change over the 18 week period (data not shown); likewise, the expression of LINE, SINE, and IAP elements in the livers of DBA/2J mice fed a MDD did not change over the 18 week period (data not shown). In contrast, the levels of the major- and, especially, the minor-associated transcripts in the livers of DBA/2J mice fed a MDD increased after 18 weeks of exposure (Figure 5A and 5B). Interestingly, at that time, the level of minor-associated transcripts in the livers of DBA/2J mice fed a MDD was 3.1 times greater than in the livers of methyl-deficient C57BL/6J mice.
Figure 5. Expression of major- and minor-associated transcripts and Cpt1a gene in the livers of C57BL/6J and DBA/2J mice fed a methyl-deficient diet for 18 weeks and age-matched control mice.
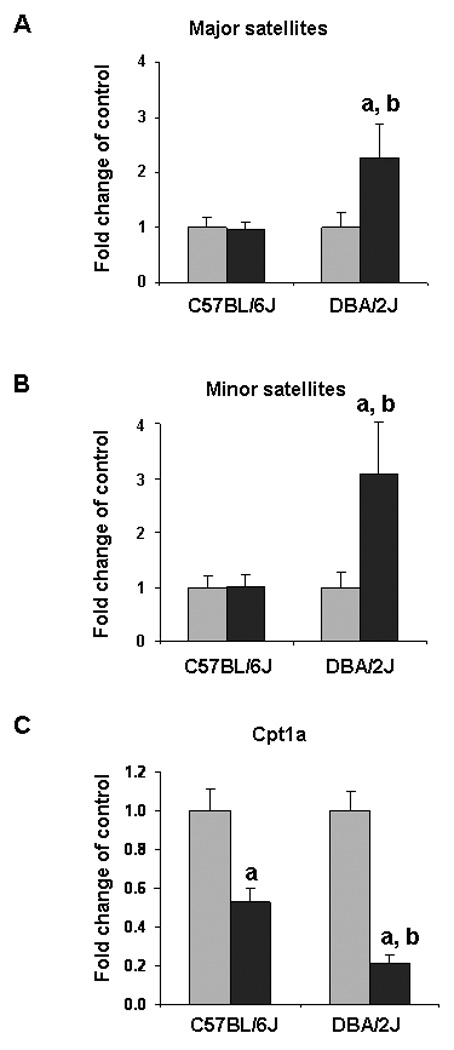
The level of expression of major- and minor-associated transcripts and Cpt1a gene was measured using the qRT-PCR. The results are presented as fold change of major- and minor-associated transcripts and Cpt1a gene in the livers of mice fed a methyl-deficient diet (black bars) relative to control mice (gray bars) at the same time point after normalization to Gapdh (mean ± S.D., n=5). a – Significantly different from control at the same time point; b - significantly different from C57BL/6J mice fed a methyl-deficient diet at the same time point.
An opposite trend was observed for changes in expression of the Cpt1a gene in the livers of C57BL/6J and DBA/2J mice (Figure 5C). Feeding a MDD resulted in down-regulation of the Cpt1a gene in the livers of both mouse strains; however, the loss of Cpt1a expression in the livers of methyl-deficient DBA/2J mice was 2.4 times greater than that observed in the C57BL/6J mice.
3.6. Effects of a MDD on histone modifications
The results of our previous studies demonstrated that feeding rats a MDD, in addition to the DNA methylation changes, was associated with profound alterations in the histone modification patterns [18]. In view of this, we studied the effect of MDD on the status of histone macroH2A and extent of histone H3K9, H3H27, H4K20 trimethylation in the livers of C57BL/6J and DBA/2J mice. In the livers of C57BL/6J and DBA/2J mice fed a MDD, the level of histone macroH2A increased considerably, especially in the livers of DBA/2J mice, with the difference between strains being significant after 12 and 18 weeks of feeding (Figure 6A). At those times, the level of histone macroH2A in the livers of DBA/2J mice was, respectively, 2.2 and 3.1 times greater than in the age-matched control mice, and 1.3 and 1.5 times, respectively, greater than in the methyl-deficient C57BL/6J mice. Feeding a MDD resulted in an increase of histone H3K9me3 levels in the livers of C57BL/6J and DBA/2J mice (Figure 6B), did not affect the trimethylation status of H3K27 in the livers of C57BL/6J mice, but caused a slight loss of H3K27 trimethylation in the livers of DBA/2J mice (Figure 6C), and resulted in a significant similar loss of H4K20me3 in both mouse strains (Figure 6D).
Figure 6. Western blot analysis of histone modifications in the livers of C57BL/6J and DBA/2J mice fed a methyl-deficient diet for 18 weeks and age-matched control mice.

Acid extracts of total histones were isolated from the livers of control mice (gray bars) and mice fed a methyl-deficient diet (black bars), separated by SDS-PAGE, and subjected to immunoblotting using specific antibodies against histone macroH2A and H3K9me3, H3K27me3, and histone H4K20me3. Chemifluorescence detection was performed with the ECF Substrate for Western Blotting (GE Healthcare Biosciences, Piscataway, NJ) and measured directly by a Storm Imaging System (Molecular Dynamics, Sunnyvale, CA). The signal intensity was analyzed by ImageQuant software (Molecular Dynamics). These results were reproduced in two independent experiments. (A) Level of histone macroH2A; (B) Level of H3K9me3; (C) Level of H3K27me3; (D) Level of H4K20me3.
Data are presented as mean ± S.D. (n=5) relative to control at the same time point.
a - Significantly different from control at the same time point; b - significantly different from C57BL/6J mice fed a methyl-deficient diet at the same time point; c - significantly different from control C57BL/6J mice.
3.7. Effects of a MDD on expression of proteins responsible for DNA and histone lysine methylation
The observed changes in the levels of DNA and histone lysine methylation in the livers of methyl-deficient mice prompted us to investigate the expression of proteins that are responsible for these epigenetic modifications. Figure 7 shows that feeding C57BL/6J and DBA/2J mice a MDD resulted in significant decrease in the levels of DNMT1 protein, the main DNA methyltransferase that is required for the accurate maintenance of the DNA methylation patterns in somatic cells, in the livers of both mouse strains. Interestingly, the protein levels of de novo DNA methyltransferase DNMT3A increased substantially in the livers of C57BL/6J methyl-deficient mice, but not in DBA/2J mice. Feeding a MDD did not affect the expression of methyl-CpG-binding protein MeCP2 and KMT Suv39h1 in both strains of mice, but caused a slight decrease in the level of Suv4-20h2 protein in the livers of DBA/2J mice (Figure 6). More importantly, a MDD diet induced a significant decrease of RIZ1, a critical target in methyl-deficient hepatocarcinogenesis [23].
Figure 7. Western blot analysis of proteins responsible for DNA and histone lysine methylation in the livers of C57BL/6J DBA/2J fed a methyl-deficient diet for 18 weeks and age-matched control mice.
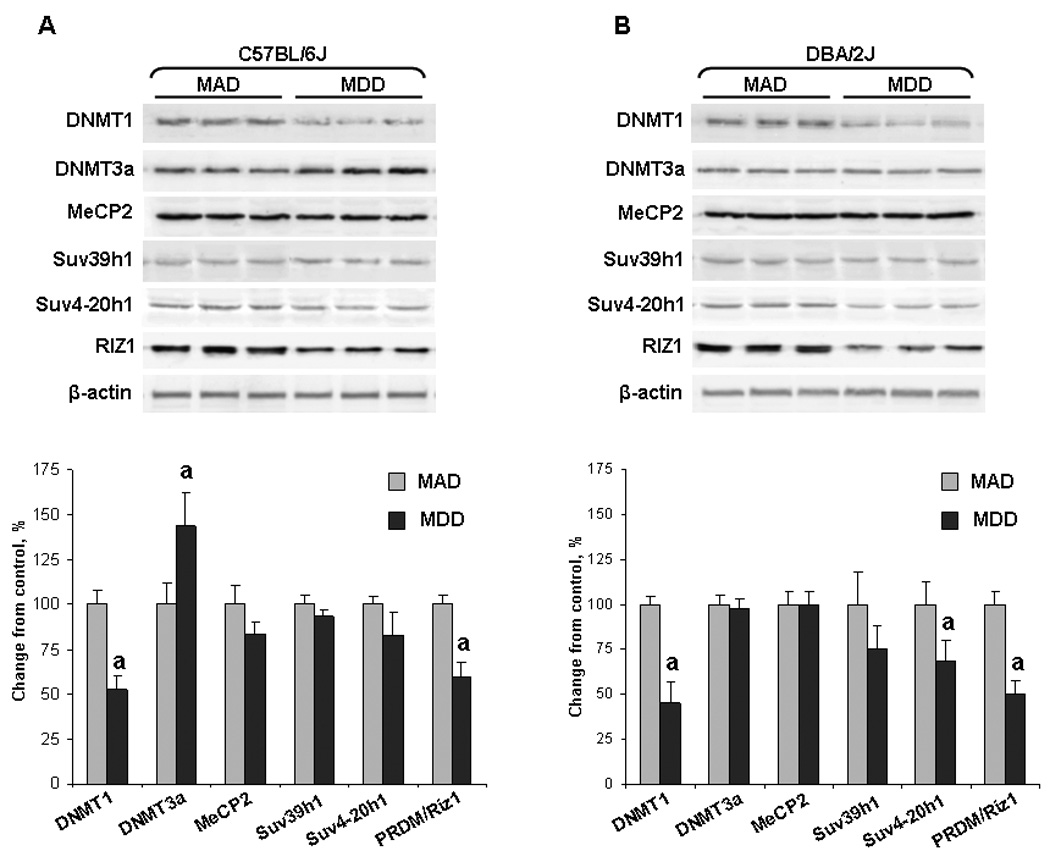
Liver tissue lysates from the livers of control mice (gray bars) and mice fed a methyl-deficient diet (black bars) were separated by SDS-PAGE and subjected to Western immunoblotting using specific antibodies against DNMT1, DNMT3A, methyl-CpG-binding protein MeCP2, and KMTs Suv39h1, Suv4-20h2, and RIZ1. Equal sample loading was confirmed by immunostaining against β-actin. These results were reproduced in two independent experiments. Representative Western immunoblot images are shown. The images were analyzed as described in Figure 5 legend. Data are presented as mean ± S.D. (n=5) relative to age-matched control mice. Control values at each time point were considered as 100%.
a .Significantly different from the control at the same time point.
4. Discussion
The results of the present study demonstrate that feeding of C57BL/6J and DBA/2J mice a MDD for 18 weeks resulted in the progressive accumulation of morphological changes in the livers similar to human NASH (Figure 1, Table 2). These pathomorphological changes were accompanied by prominent deregulation of epigenetic mechanisms, evidenced by the loss of genomic and repetitive sequences methylation, aberrant histone modifications and alterations in expression of proteins responsible for DNA and histone lysine methylation. More importantly, the pathological and epigenetic changes induced by methyl deficiency were more prominent in the livers of DBA/2J mice than in the C57BL/6J mice; however, they were not associated with interstrain differences in hepatic methionine metabolism (Figure 3).
The present study shows that administration of a MDD to C57BL/6J and DBA/2J mice resulted in pronounced demethylation of genome and repetitive elements (Figure 2 and Figure 4) accompanied by decreased expression of the maintenance DNMT1 and KMT RIZ1 (Figure 7) and loss of histone H3K27 and H4K20 trimethylation (Figures 6C and 6D). This may compromise integrity of genome via heterochromatin reorganization. Specifically, a low level of DNA methylation in combination with a high content of histone macroH2A and the decreased levels of H3K9 and H4K20 trimethylation, known marks of constitutive heterochromatin, is associated with formation of significantly altered chromatin configuration [24,25]. We detected similar changes in the livers of both mouse strains fed a methyl-deficient diet, with the magnitude being greater in DBA/2J mice. One of the possible explanations of the greater degree of demethylation of genomic DNA and, particularly, repetitive elements in the livers of methyl-deficient DBA2J mice compared to methyl-deficient C57BL/6J mice may be the differences in DNMTs expression. Both mouse strains fed a MDD were characterized by the profoundly decreased DNMT1 expression; however, the expression of de novo methyltransferase DNMT3A was increased only in the livers of C57BL/6J mice (Figure 7). It is has been shown that cooperativity between DNMT1 and DNMT3a is absolutely required for the maintenance of the methylation of repetitive elements and DNMT1, by itself, is not capable of maintaining the repetitive elements methylation [26]. The hypomethylation of repetitive sequences, especially centromeric minor and pericentromeric major satellites, in the livers of DBA/2J mice may lead to the induction of centromere abnormalities and chromosome segregation defects. Indeed, recent findings have demonstrated that DNA hypomethylation causes a permissive transcriptional activity at the centromere [21] and subsequent accumulation of small murine minor satellite transcripts that impaired centromeric architecture and function [27]. Interestingly, the Cpt1a, which encodes the liver isoform of CPT1, an enzyme critical for the proper function of β-oxidation in liver, is located in centromeric region of mouse chromosome 19 [28] and human chromosome 11 [29]. The profound accumulation of minor satellite transcripts associated with their severe demethylation may cause centromeric defects and compromise the function of the genes located in this chromosomal region. The down-regulation of Cpt1a gene expression detected in the current (Figure 4) and previous studies [7] support this suggestion. As has been mentioned above, the impaired β-oxidation of LCFA is one of the main mechanisms in the pathogenesis of mouse hepatic steatosis and human NASH [1,6,7,30].
One of the most important features of human NASH and mouse models of hepatic steatosis induced by a methyl-deficient diet is lipid accumulation in the liver [1,7,30,31]. Several mechanisms of lipid accumulation in human NASH and in mouse hepatic steatosis, including increased long-chain fatty acid (LCFA) uptake, increased de novo hepatic LCFA and triglyceride synthesis, decreased synthesis and secretion of very low density lipoprotein particles, and decreased mitochondrial β-oxidation have been proposed [1,6,30]. It has been suggested that the predominant pathogenic mechanism in the induction of hepatic steatosis in a mouse methyl-deficient model is impaired β-oxidation of LCFA [6,7]. However, the precise mechanisms by which the methyl-deficient diet leads to the development of hepatic steatosis and mechanisms of inter-strain differences in susceptibility are unknown [7].
These findings strongly suggest that epigenetic dysregulation is the prominent fundamental feature of hepatic steatosis in mice fed a methyl-deficient diet. More importantly, the results of our study indicate that differences in the cellular epigenetic status may be a predetermining factor to individual susceptibilities to NASH development in humans. This has a great significance for identification of vulnerable subpopulation to NASH and, considering the potential reversibility of epigenetic alterations, opens novel prevention approaches to NASH.
Supplementary Material
List of abbreviations
- NASH
nonalcoholic steatohepatitis
- MDD
methyl-deficient diet
- DNMT
DNA methyltransferase
- KMT
histone lysine methyltransferase
- SAM
S-adenosyl-L-methionine
- SAH
S-adenosyl-L-homocysteine
- H3K9
H3 lysine 9
- H3K27
histone H3 lysine 27
- H4K20
histone H4 lysine 20
- qRT-PCR
quantitative real-time-PCR
- IAP
intracesternal A particle
- LINE
long interspersed element
- SINE
short interspersed element
- ANOVA
analysis of variance
- LCFA
long-chain fatty acid
- Cpt1
carnitine palmitoyltransferase 1
- Gapdh
glyceraldehyde-3-phosphate dehydrogenase.
Footnotes
Financial disclosure: None
Note: The views expressed in this paper do not necessarily represent those of the U.S. Food and Drug Administration.
References
- 1.Marra F, Gastaldelli A, Baroni GS, Tell G, Tiribelli C. Molecular basis and mechanisms of progression of non-alcoholic steatohepatitis. Trends Mol Med. 2008;14:72–81. doi: 10.1016/j.molmed.2007.12.003. [DOI] [PubMed] [Google Scholar]
- 2.Merriman RB, Aouizerat BE, Bass NM. Genetic influences in nonalcolic fatty liver disease. J Clin Gastroenterol. 2006;40:S30–S33. doi: 10.1097/01.mcg.0000168643.16074.19. [DOI] [PubMed] [Google Scholar]
- 3.Milner JA. Nutrition and cancer: essential elements for a roadmap. Cancer Lett. 2008;269:189–198. doi: 10.1016/j.canlet.2008.05.030. [DOI] [PubMed] [Google Scholar]
- 4.Paigen K, Eppig JT. A mouse phenome project. Mamm Genome. 2000;11:715–717. doi: 10.1007/s003350010152. [DOI] [PubMed] [Google Scholar]
- 5.Bogue MA, Grubb SC, Maddatu TP, Bult CJ. Mouse phenome database (MPD) Nucleic Acids Res. 2007;35:D-643–D-649. doi: 10.1093/nar/gkl1049. [DOI] [PMC free article] [PubMed] [Google Scholar]
- 6.Anstee QM, Goldin RD. Mouse models in non-alcoholic fatty liver disease and steatohepatitis research. Int J Exp Path. 2006;87:1–16. doi: 10.1111/j.0959-9673.2006.00465.x. [DOI] [PMC free article] [PubMed] [Google Scholar]
- 7.Yamazaki Y, Kakizaki S, Takizawa D, Ichikawa T, Sato K, Takagi H, et al. Interstrain differences in susceptibility to non-alcoholic steatohepatitis. J Gastroenterol Hepatol. 2008;23:276–282. doi: 10.1111/j.1440-1746.2007.05150.x. [DOI] [PubMed] [Google Scholar]
- 8.Roberts RB, Arteaga CL, Threadgill DW. Modeling the cancer patient with genetically engineered mice: Prediction of toxicity from molecule-targeted therapies. Cancer Cell. 2004;5:115–120. doi: 10.1016/s1535-6108(04)00032-7. [DOI] [PubMed] [Google Scholar]
- 9.Feinberg AP. Phenotypic plasticity and the epigenetics of human disease. Nature. 2007;447:433–440. doi: 10.1038/nature05919. [DOI] [PubMed] [Google Scholar]
- 10.Bachman AN, Phillips JM, Goodman JI. Phenobarbital induces progressive patterns of GC-rich and gene-specific altered DNA methylation in the liver of tumor-prone B6C3F1 mice. Toxicol Sci. 2006;91:393–405. doi: 10.1093/toxsci/kfj155. [DOI] [PubMed] [Google Scholar]
- 11.Bagnyukova TV, Tryndyak VP, Montgomery B, Churchwell MI, Karpf A, James SR, et al. Genetic and epigenetic changes in rat preneoplastic liver tissue induced by 2-acetylaminofluorene. Carcinogenesis. 2008;29:638–646. doi: 10.1093/carcin/bgm303. [DOI] [PubMed] [Google Scholar]
- 12.Pogribny I, Yi P, James SJ. A sensitive new method for rapid detection of abnormal methylation patterns in global DNA and within CpG islands. Biochem Biophys Res Commun. 1999;262:624–628. doi: 10.1006/bbrc.1999.1187. [DOI] [PubMed] [Google Scholar]
- 13.Melnyk S, Pogribna M, Pogribny IP, Yi P, James SJ. Measurement of plasma and intracellular S-adenosylmethionine and S-adenosylhomocysteine utilizing coulometric electrochemical detection: alterations with plasma homocysteine and pyridoxal 5’-phosphate concentrations. Clin Chemistry. 2000;46:265–272. [PubMed] [Google Scholar]
- 14.Martens JHA, O’Sullivan RJ, Braunschweig U, Opravil S, Radolf M, Steinlein P, et al. The profile of repeat-associated histone lysine methylation states in the mouse epigenome. EMBO J. 2005;24:800–812. doi: 10.1038/sj.emboj.7600545. [DOI] [PMC free article] [PubMed] [Google Scholar]
- 15.Schmittgen TD, Livak KJ. Analyzing real-time PCR data by the comparative C(T) method. Nat Protoc. 2008;3:1101–1108. doi: 10.1038/nprot.2008.73. [DOI] [PubMed] [Google Scholar]
- 16.Tryndyak VP, Muskhelishvili L, Kovalchuk O, Rodriquez-Juarez R, Montgomery B, Churchwell MI, et al. Effect of long-term tamoxifen exposure on genotoxic and epigenetic changes in rat liver: implications for tamoxifen-induced hepatocarcinogenesis. Carcinogenesis. 2006;27:1713–1720. doi: 10.1093/carcin/bgl050. [DOI] [PubMed] [Google Scholar]
- 17.Pogribny IP, Tryndyak VP, Woods CG, Witt SE, Rusyn I. Epigenetic effects of the continuous exposure to peroxisome proliferator WY-14,643 in mouse liver are dependent upon peroxisome proliferator activated receptor α. Mutat Res. 2007;625:62–71. doi: 10.1016/j.mrfmmm.2007.05.004. [DOI] [PMC free article] [PubMed] [Google Scholar]
- 18.Pogribny IP, Tryndyak VP, Muskhelishvili L, Rusyn I, Ross SA. Methyl deficiency, alterations in global histone modifications, and carcinogenesis. J Nutr. 2007;137:216S–222S. doi: 10.1093/jn/137.1.216S. [DOI] [PubMed] [Google Scholar]
- 19.Yoder JA, Walsh CP, Bestor TH. Cytosine methylation and the ecology of intragenomic parasites. Trends Genet. 1997;13:335–340. doi: 10.1016/s0168-9525(97)01181-5. [DOI] [PubMed] [Google Scholar]
- 20.Dunn BK. Hypomethylation: one side of a larger picture. Ann N Y Acad Sci. 2003;983:28–42. doi: 10.1111/j.1749-6632.2003.tb05960.x. [DOI] [PubMed] [Google Scholar]
- 21.Wong NC, Wong LH, Quach JM, Canham P, Craig JM, Song JZ, et al. Permissive transcriptional activity at the centromere through pockets of DNA hypomethylation. PLoS Genet. 2006;2:e17. doi: 10.1371/journal.pgen.0020017. [DOI] [PMC free article] [PubMed] [Google Scholar]
- 22.Yehezkel S, Segev Y, Viegas-Péquignot E, Skorecli K, Selig S. Hypomethylation of subtelomeric regions in ICF syndrome is associated with abnormally short telomeres and enhanced transcription from telomeric regions. Hum Mol Genet. 2008;17:2776–2789. doi: 10.1093/hmg/ddn177. [DOI] [PubMed] [Google Scholar]
- 23.Zhou W, Alonso S, Takai D, Lu SC, Yamamoto F, Perucho M, Huang S. Requirement of RIZ1 for cancer prevention by methyl-balanced diet. PLos ONE. 2008;3:e3390. doi: 10.1371/journal.pone.0003390. [DOI] [PMC free article] [PubMed] [Google Scholar]
- 24.Ma Y, Jacobs SB, Jackson-Grusby L, Matrangelo MA, Torres-Betancourt JA, Jaenisch R, et al. DNA CpG hypomethylation induces heterochromatin reorganization involving the histone variant macroH2A. J Cell Sci. 2005;118:1607–1616. doi: 10.1242/jcs.02291. [DOI] [PubMed] [Google Scholar]
- 25.Jenuwein T. The epigenetic magic of histone lysine methylation. FEBS J. 2006;273:3121–3135. doi: 10.1111/j.1742-4658.2006.05343.x. [DOI] [PubMed] [Google Scholar]
- 26.Liang G, Chan MF, Tomigahara Y, Tsai YC, Gonzales F, Li E, et al. Cooperativity between DNA methyltransferases in the maintenance methylation of repetitive elements. Mol Cell Biol. 2002;22:480–491. doi: 10.1128/MCB.22.2.480-491.2002. [DOI] [PMC free article] [PubMed] [Google Scholar]
- 27.Bouzinba-Segard H, Guais A, Francastel C. Accumulation of small murine minor satellite transcripts leads to impaired centromeric architecture and function. Proc Natl Acad Sci USA. 2006;103:8709–8714. doi: 10.1073/pnas.0508006103. [DOI] [PMC free article] [PubMed] [Google Scholar]
- 28.Cox KB, Johnson KR, Wood PA. Chromosomal locations of the mouse fatty acid oxidation genes Cpt1a, Cpt1b, Cpt2m Acadvl, and metabolically related Crat gene. Mamm Genome. 1998;9:608–610. doi: 10.1007/s003359900830. [DOI] [PubMed] [Google Scholar]
- 29.Britton CH, Mackey DW, Esser V, Foster DW, Burns DK, Yarnal DP, et al. Fine chromosome mapping of the genes for human liver and muscle carnitine palmitoyltransferase 1 (CPT1A and CPT1B) Genomics. 1997;40:209–211. doi: 10.1006/geno.1996.4539. [DOI] [PubMed] [Google Scholar]
- 30.Rinella ME, Elias MS, Smolak RR, Fu T, Borensztajn J, Green RM. Mechanisms of hepatic steatosis in mice fed a lipogenic methionine choline-deficient diet. J Lipid Res. 2008;49:1068–1076. doi: 10.1194/jlr.M800042-JLR200. [DOI] [PMC free article] [PubMed] [Google Scholar]
- 31.Larter CZ, Yeh MM, Haigh WG, Williams J, Brown S, Bell-Anderson KS, et al. Hepatic free fatty acids accumulate in experimental steatohepatitis: Role of adaptive pathways. J Hepatol. 2008;48:638–647. doi: 10.1016/j.jhep.2007.12.011. [DOI] [PubMed] [Google Scholar]
Associated Data
This section collects any data citations, data availability statements, or supplementary materials included in this article.