Abstract
A novel ratiometric Raman spectroscopic (RMRS) method has been developed for quantitative determination of protein carbonyl levels. Oxidized bovine serum albumin (BSA) and oxidized lysozyme were used as model proteins to demonstrate this method. The technique involves conjugation of protein carbonyls with dinitrophenyl hydrazine (DNPH), followed by drop coating deposition Raman spectral acquisition (DCDR). The RMRS method is easy to implement as it requires only one conjugation reaction, a single spectral acquisition, and does not require sample calibration. Characteristic peaks from both protein and DNPH moieties are obtained in a single spectral acquisition, allowing the protein carbonyl level to be calculated from the peak intensity ratio. Detection sensitivity for the RMRS method is ~0.33 pmol carbonyl/measurement. Fluorescence and/or immunoassay based techniques only detect a signal from the labeling molecule and thus yield no structural or quantitative information for the modified protein while the RMRS technique provides for protein identification and protein carbonyl quantification in a single experiment.
Keywords: Raman, DCDR, Carbonyl, Protein Oxidation, Protein Modification, Biomolecule Modification
Introduction
Sensitive and accurate determination of protein post-translational modifications (PTM) such as phosphorylation, glycosylation and oxidation is critically important since they are widely associated with many physiological and pathological processes [1; 2]. Current analytical techniques for the detection of PTM are based mainly on mass spectrometry, fluorescence, and immunoassay methods [1; 3–7]. While these techniques offer excellent sensitivity, their accuracy can be limited for applications where small changes in protein modification levels may be biologically significant. Improving existing PTM detection methods or the development of new PTM detection techniques continues to be an area of scientific interest across several disciplines [8–10].
Protein oxidation has been associated with aging and a host of diseases [11–13]. Protein carbonyl, ketone and aldehyde groups are acceptable as biomarkers for protein damage. Current protein carbonyl detection methods include spectrophotometric, fluorescence [7], immunoblot[14], ELISA[15], and more recently, mass-spectrometry[16–20]. While the spectrophotometric technique remains the most accurate method, detection limits of 533 pmol carbonyl per measurement are too high for tissue extract studies. On the other hand, the immunoassay based methods have significantly higher sensitivity (~0.3 pmol carbonyl/measurement with immunoblotting), but they are semi-quantitative as they all involve highly variable antibody binding and/or protein gel staining techniques [21; 22]. Another limitation, shared by both techniques, is the difficulty in obtaining protein structural information such as the identity of the oxidized protein. Such information is clearly of critical biological importance as individual proteins have different susceptibilities to protein oxidative damage.
Raman spectroscopy has become an increasingly popular technique for protein characterization. The development of the Drop Coating Deposition Raman (DCDR) method has made it possible to obtain high quality Raman spectra for protein solutions at sub μM protein concentrations and/or for sub pmol quantities of protein [23; 24]. To date, DCDR spectroscopy has been used for detection of protein fibrillation, aggregation, protein identification and protein phosphorylation [25–32]. However, Raman detection of protein oxidation, particularly for quantitative determination of protein oxidative damage, has largely remained an unexplored area.
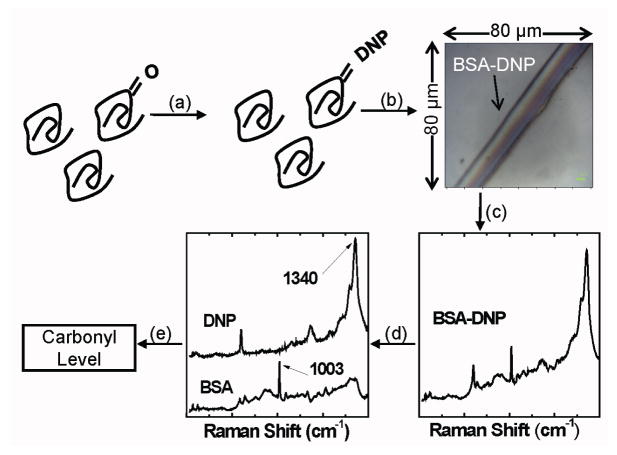
In this paper, we describe a novel ratiometric Raman spectroscopic (RMRS) method for quantitative determination of protein levels. The basics of this RMRS method are outlined in Figure 1 where bovine serum albumin (BSA) is used to illustrate this technique. Protein carbonyl is conjugated with dinitrophenyl hydrazine (DNPH), a label commonly used in spectrophotometric and immunoassay-based methods. Spectroscopy on the labeled protein detects characteristic peaks from both protein and DNPH moieties. Protein carbonyl levels i.e. the number of carbonyl groups per protein molecule, are obtained from the resulting peak intensity ratio.
Figure 1.
Schematic of ratiometric Raman quantification of protein carbonylation levels. (a) DNPH conjugation (b) BSA-DNPH deposition. Photograph shows 3 μL of 0.5 μM DNPH conjugated BSA deposited on a stainless steel plate. (c) Raman spectral acquisition, (d) spectral decomposition and (e) calculation of the protein carbonyl level using the the peak intensity ratio between the 1340 cm−1 peak of DNPH and the protein peak at 1003 cm−1
Experimental Section
Chemicals and equipment
All chemicals and proteins were obtained from Sigma-Aldrich. Raman spectra were obtained with a LabRam HR Raman microscopy system equipped with an 800 mm focal length spectrograph (Jobin Yvon Horiba, Inc). The substrate used for DCDR spectral acquisition was a mirror-polished stainless steel plate that provided a Raman and fluorescence free background. Nanopure water (Thermal Fisher) was used for all experiments. UV-visible spectra were acquired with an Evolution 300 UV-visible spectrophotometer (Fisher Scientific). Protein dialysis was performed using Spectra/Pro dialysis membranes with a molecular weight cut-off of 3,500 Daltons.
Protein oxidation
BSA and lysozyme oxidation was carried out according to Stadman and Oliver [33]. 9 mg of protein was dissolved in 1 ml of 7.4 pH Hepes buffer (50 mM Hepes, 100 mM KCl, 10 mM MgCl2). Protein solutions were subsequently exhaustively dialyzed against three changes of Hepes buffer at 4°C. Protein oxidation was carried out by incubation of the protein solutions with a freshly prepared, continuously shaken, equal volume mixture of neutral ascorbic acid and FeCl3 for 24 hours at 37 °C. The solution’s final concentration was ~8 mg/mL protein, 25 mM ascorbic acid and 100 μM FeCl3. Oxidation was terminated by adding an equal volume of 1 mM EDTA to the protein oxidation solution. The solution was then dialyzed against 10 mM phosphate buffered saline twice (400 mL and 6 hours each) before DNPH conjugation. BSA and lysozyme control samples were prepared with the same procedures but without oxidation reactants (ascorbic acid and FeCl3). Oxidized BSA and lysozyme will be referred to as oxiBSA and oxiLys respectively, whereas the un-oxidized control proteins will be referred to as BSA and Lys.
DNPH conjugation
Each of the oxidized protein solutions was divided into two fractions: one for DNPH conjugation and the other for label-free Raman detection. Conjugation of the protein with DNPH was carried out according to Levine et al [34]. Briefly, 500 μL of 10 mM 2,4-DNPH in 2 M HCl was added to 100 μL of oxidized BSA and lysozyme and their respective controls. After incubation of the solutions at room temperature for 20 minutes with occasional vortexing, the proteins were precipitated with 20% trichloroacetic acid. Excess DNPH was removed by a combination of four cycles of ethanol:ethyl acetate (1:1 v/v) washing and centrifugation [14]. The final protein pellet was dispersed in water and dialyzed against water three times (400 mL each), for ~6 hours, in order to remove any ethanol:ethyl acetate mixture and possible residue-free DNPH. DNPH conjugated, oxidized BSA and lysozyme will be referred to as DNPH-oxiBSA and DNPH-oxiLys respectively, while the unoxidized BSA and lysozyme samples, that also underwent DNPH conjugation reaction, will be termed DNPH-BSA and DNPH-lys, respectively.
Preparation of BSA standard solutions
Ten BSA standard solutions that contain different levels of protein carbonyls were prepared with by mixing BSA stock solution with the DNPH-oxiBSA stock solution that is with a carbonyl level of 2.6 mol carbonyl/mol BSA. Prior to their mixing, BSA concentrations in both stock solutions were adjusted with water to 0.5 μM so that the BSA concentration in all the standard solutions is 0.5 μM. The volume fraction of the DNPH-oxiBSA in the standard solutions varied from 0 to 100% with step value of 10%, so that the protein carbonyl level in these standard solutions changed from 0 to 2.6 mol carbonyl/mol BSA with a step value of 0.26 mol carbonyl/mol BSA.
DCDR spectral acquisition
All BSA DCDR spectra were obtained by manual deposition of 3 μL of 0.5 μM protein solution onto a stainless steel plate while the lysozyme spectra were acquired with samples with protein concentration of ~ 2 μM. The deposited solutions were dried at ambient temperature under a laminar flow chamber in order to avoid possible contamination. The spectra were obtained with a 632.8 nm HeNe excitation laser. A 100 X objective (NA=0.9, MPlan, Olympus), corresponding to a sampling area of ~2 μm in diameter on the protein ring, was used for all experiments. Full laser power (13.6 mW before objective) was used for all DCDR spectral acquisitions of protein samples that did not contain DNPH. A lower laser power of 1.36 mW before objective was used for DCDR spectral acquisition in the DNPH-conjugated protein experiments. The lower laser power was used in these experiments to avoid photodestruction of the DNP Raman signal. Spectra integration times varied from 100 s to 150 s.
Result and Discussion
Determination of protein carbonyl content
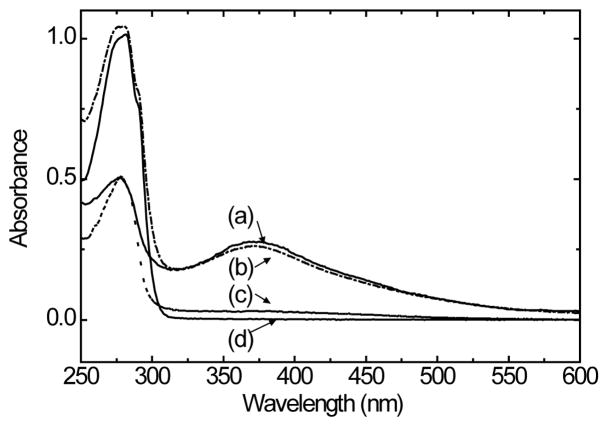
Since the spectrophotometric method is generally expected to be the most accurate approach for protein carbonyl quantification, it was used as the reference technique in this study. Figure 2 shows the UV-visible spectra of (a) DNPH-oxiBSA, (b) DNPH-oxiLys, (c) DNPH-BSA, and (d) DNPH-Lys, all obtained after removal of excessive DNPH in their respective solutions. As expected, UV-visible spectra of both oxidized protein samples showed a relatively intense DNPH specific peak centered at the ~370 nm region, indicating successful protein carbonyl generation and DNPH conjugation. The UV-vis spectra of the two DNPH reacted protein controls, however, are somewhat surprising. While there is not a DNPH spectral feature in the UV-vis spectrum of DNPH-Lys, indicating the effectiveness of our experimental procedure in removing free DNPH, the small, but detectable DNPH peak in the DNPH-BSA spectrum unambiguously indicates the incorporation of DNPH in the native BSA sample. Similar results were obtained with several repeated trials. Although the exact cause of the discrepancy observed between lysozyme and BSA is out of the scope of current study, the DNPH retained in the DNPH-BSA sample is likely due to so-called “nonhydrozone linkage” formed between DNPH and native BSA. It has been reported that when the duration of the conjugation reaction exceeds 15–30 mins, DNPH may form “nonhydrozone linkage”[34]. Our results suggest that different proteins may differ in their susceptibility to form “nonhydrozone linked ” products.
Figure 2.
UV-visible spectra of (a) DNPH-oxiBSA, (b) DNPH-oxiLys, (c) DNPH-BSA and (d) DNPH-Lys All the spectra were acquired after removal of excess DNPH from the conjugation solutions. Spectra were scaled for clarity.
Based on the UV-visible spectra shown in Figure 2, the protein carbonyl level in the DNPH-oxiBSA, DNPH-oxiLys, and DNPH-BSA were estimated [34] to be 2.6 mol carbonyl/BSA, 0.5 mol carbonyl/mol lysozyme, and 0.10 mol carbonyl/mol BSA respectively. It should be noted that in this estimation, the DNPH present in the protein samples was assumed to solely originate from protein carbonyl. Although it is possible in the DNPH-oxiBSA, that there is some DNPH from the “nonhydrozone linkage”, the DNPH amount is unlikely be more than 0.10 mol DNPH/mol BSA. In fact, the carbonylation level in our oxidized BSA is consistent with the carbonylation of 3 mol carbonyl/protein reported for the metal catalyzed oxidation (MCO) oxidized human serum albumin [19].
Label-free Raman spectroscopy of protein carbonylation
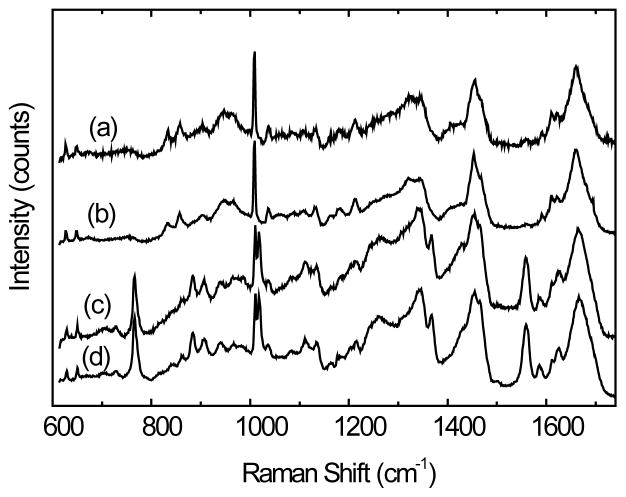
Figure 3 shows the DCDR spectra obtained with (a) oxiBSA, (b) BSA, (c) oxiLys and (d) lysozyme. Evidently, for both proteins, there are no appreciable differences in their Raman spectra obtained before and after the MCO reaction, indicating the difficulty of label-free Raman detection of protein oxidization performed under our experimental conditions. Since protein Raman spectra are dominated by spectral features of aromatic amino acids and the protein skeletal modes[35], the absence of spectral modification in the oxidized protein indicates that there are no significant structural modifications induced by the protein MCO reaction in the protein aromatic amino residues or in protein secondary structure. This observation is consistent with a previous report, which showed that lysine is the main target in MCO oxidation[19], and that oxidative modifications of the few lysine residues in either BSA or lysozyme is unlikely to induce any significant conformational change.
Figure 3.
DCDR spectra of (a) oxiBSA, (b) BSA control, (c) oxiLys and (d) lysozyme control. All spectra were scaled and offset for clarity.
Ratiometric determination of protein carbonyl level
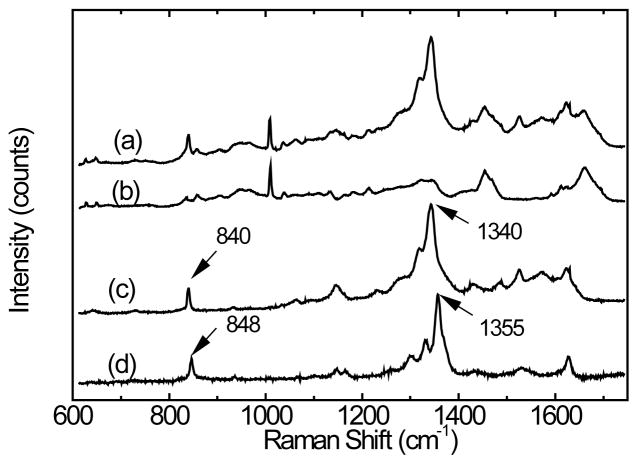
DNPH conjugation dramatically improves the detectability of protein carbonylation. Figure 4 shows the Raman spectra of (a) DNPH-oxiBSA and (b) BSA, and (c) the difference between (a) and (b), and (d) the Raman spectrum obtained for the protein-free DNPH solution. Evidently, DNPH and BSA conjugation, produces a marked change in the DNPH Raman spectra, mainly the red-shift of both the 1355 cm−1 peak (the dinitrophenyl-N bond stretch [36]), and the 848 cm−1 peak (ring breathing mode [37]). The major protein Raman features including the 1003 cm−1 phenylalanine peak and 1430 cm−1 methylene scissoring peak remains largely unchanged before and after DNPH conjugation. Similar results have been observed with lysozyme and in fact, the DNPH spectral profile extracted from both DNPH-oxiLys and DNPH-oxiBSA are highly similar, and will therefore be referred to as SDNP hereafter. (See supporting information).
Figure 4.
DCDR spectra of (a) DNPH-oxiBSA, (b) BSA, (c) BSA subtracted from DNPH-oxiBSA (d) Raman spectrum obtained with saturated DNPH solution. All spectra were scaled and offset for clarity. Solvent (water) contributions in the DNPH solution Raman spectrum were removed.
Even though there are only 2.6 DNPH groups conjugated to each oxidized BSA molecule, the DNPH characteristic peak at 1340 cm−1 is much more intense than the 1003 cm−1 protein peak. This indicates a large Raman cross-section for DNPH, especially since the protein peak is from the collective contribution of 30 phenylalanine residues in each BSA molecule. Based on the DNPH and phenylalanine protein Raman peak intensity ratio, normalized by their respective composition number of residues in each DNPH-oxiBSA molecule, it is estimated that the Raman cross-section of DNPH at 1340 cm−1 is ~21.5 times that of phenylalanine peak at 1003 cm−1. A similar relative cross-section (22.8 times) has been found with Raman spectra of DNPH-oxiLys shown in Figure S1 (supporting information). Based on this observation, Equation 1 can be derived for the RMRS determination of protein carbonyl levels using the DCDR spectrum of DNPH conjugated proteins,
| 1 |
where IDNP is the peak height at the 1340 cm−1 region in the DNPH profile SDNP obtained by subtracting the protein Raman feature from DCDR spectrum of the protein-DNPH conjugate, IPhe is the peak intensity at 1003 cm−1 in the Raman spectra obtained with DNPH conjugated protein sample, and NPhe the number of phenylalanine residues contained in each protein molecule. The constant of 22 is the Raman cross-section ratio between the 1340 cm−1 peak of the DNPH moiety and the 1003 cm−1 peak of the protein moiety, which was calculated by averaging the results obtained with both oxidized BSA and lysozyme samples, and assumed to be protein independent.
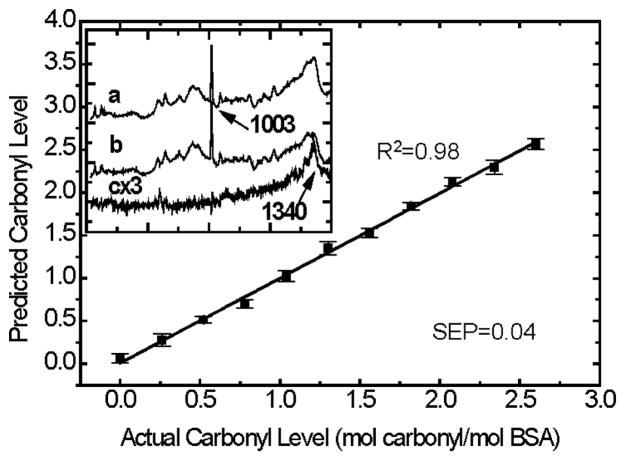
Quantification accuracy of the RMRS method is shown in Figure 5 where the correlation between the actual protein carbonyl content in the BSA standard solutions and the RMRS predicted values is plotted. The spectra in the inset shows that even for the samples with carbonyl levels as low as 0.26 mol carbonyl/mol BSA, an identifiable DNPH feature at the 1340 cm−1 region can be extracted from the DCDR spectrum of the protein-DNPH conjugate. This indicates that DNPH is an effective Raman tag for detection of protein oxidation detection. The standard error of prediction (SEP) shown in the figure is calculated using equation 2,
Figure 5.
Correlation between the actual protein carbonyl levels in the BSA standard solutions with RMRS predicted values calculated with Eq. 1. The error bar represents the standard deviation of four repeated measurements with different protein deposits of the same solution. Inset: (a) DCDR spectra of the 0.26 mol carbonyl/mol BSA sample (b) DCDR spectra of the BSA control and (c): Raman spectrum of( a) - (b).
| 2 |
where YPr e and Yact are the predicted and actual protein carbonyl content in the BSA standard solutions. N is the total number of measurements and i is the measurement index.
Our current estimated detection limit, based on the results shown in Figure 5, is about 0.22 mol carbonyl/mol BSA molecule, which is calculated by the summation of the blank response of DNPH-free BSA sample with 3 standard derivations of the blank average. Taking into account the total amount of BSA used for each Raman spectral acquisition, which is 1.5 pmol (3 μL × 0.5 μM), our detection sensitivity in terms of the total protein carbonyl required per measurement is ~0.35 pmol. This result represents more than 1000 times improvement over the 533 pmol/measurement for the spectrophotometric method, and is similar to the detection limit of 0.3 pmol/slot for the immunoblotting method, both reported using BSA as the model protein[21; 22].
Protein identification using the DCDR spectrum of DNPH-protein conjugate
In addition to its high detection sensitivity and accuracy, the RMRS technique allows rapid protein identification by using the fingerprint-like information of the protein Raman spectrum. Such a task is difficult to accomplish with other protein carbonyl detection methods such as spectrophotometric, fluorescence and immunoblotting methods. Furthermore, these techniques also rely on additional information such as molecular weight, extinction coefficient, etc. to accurately determine protein carbonyl levels. Theoretical considerations of protein Raman identification are outlined below.
Assuming SDNP-Protein is the DCDR spectrum of a DNPH conjugated protein, mathematically, it can be decomposed to SDNP and SProtein, the Raman spectra of the two constituent moieties using Equation 3,
| 3 |
where CDNP, and CPro are the decomposition coefficients specifying the signal contribution of SDNP and SProtein , respectively. It is important to emphasize that it is SDNP, the Raman spectral profile of the DNP moiety, and not the Raman spectrum of the DNPH, that should be used in Equation 3. However, since neither protein oxidization nor DNPH conjugation induced significant spectral modification to any Raman features characteristic to the protein moiety, the DCDR spectrum of native protein can be used for the spectral decomposition.
To identify an oxidized unknown protein, one can simply decompose the SDNP-Protein to a series of spectral base sets, each composed of a protein library Raman spectrum and the DNP spectral profile SDNP, the protein corresponding to the library spectrum that gives minimum decomposition error is the protein of interest. Although theoretically, it is possible to use this spectral decomposition technique for simultaneous protein identification and protein carbonyl level quantification, such an approach is not practical as it would require a multivariate calibration model constructed for every protein in the protein Raman library. In contrast, for sequential protein identification and carbonyl quantification as we propose here, only one DCDR spectrum is needed for the construction of a protein Raman library for the protein identification application. Once the oxidized protein is identified, its phenylalanine content can be easily obtained through public accessible protein databases. Such information will be sufficient for the univariate protein carbonyl quantification based on Eq. 2.
To demonstrate the utility of the protein identification strategy outlined above, a protein Raman library consisting of DCDR spectra of 15 different proteins was constructed, and a Matlab program was developed for automatic spectral decomposition using the steps below.
Step 1: Obtain the Savistky-Golay second derivative spectra with the proper window-size for all the protein Raman library spectra, DNP spectral profile SDNP and the Raman spectrum of protein-DNPH conjugate. It has been shown that with second derivative spectra, the influence of the possible fluorescence background interference on Raman discriminant analysis can be greatly reduced[38].
Step 2: Normalize all the second derivative spectra so that their sum of square of the spectral intensity is equal to 1.
Step 3: Least-square decompose the normalized protein-DNPH second derivative spectra to all the possible combinations of [Si, SDNP] where Si is the ith normalized second derivative Raman spectrum in the protein Raman library. For each decomposition, the magnitude of the decomposition error is calculated, which is defined as the norm (sum of the square) of the residue spectrum obtained with least square decomposition.
Step 4: Output the magnitude of the decomposition errors and the identity of the protein associated with the library spectrum giving the minimum decomposition error.
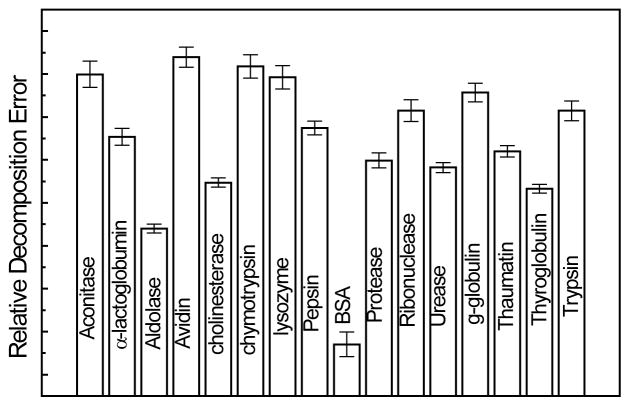
Figure 6 shows the decomposition errors when forty DNPH-oxiBSA spectra obtained with the BSA standard solutions were decomposed into SDNP paired with each of the 15 protein Raman spectra in a library built for this work. As expected, when the correct library spectrum is used, the decomposition error reaches its minimum, indicating the effectiveness of this proposed scheme for protein identification. It should also be pointed out that in order to avoid a false positive result, the SDNP spectrum was extracted from DNPH-oxiLys in this calculation.
Figure 6.
Relative decomposition errors of Raman spectra of DNPH-oxiBSA into series of protein library spectrum paired with Raman spectrum of DNPH. Error bar represents one standard deviation calculated with all the Raman spectra obtained with BSA standard solutions in which the protein carbonyl level changes from 0.26 to 2.6 mol carbonyl/mol BSA. (See text for details)
For the proteins whose Raman spectra are not available in the protein Raman libary, protein identification can be readily achieved with MALDI-TOF mass spectrometry techniques. Since DCDR is a nondestructive technique, the same protein deposit on the stainless steel plate can be directly used for mass spectrometric analysis after DCDR is completed[23]. On plate trypsin digestion, followed by MALDI-TOF, protein identification has been demonstrated by Vitorino et al [39].
Conclusion
The RMRS method is a new protein carbonyl detection technique that combines convenience, sensitivity and accuracy. It involves only one chemical conjugation reaction and requires no sample calibrations. The RMRS technique allows sequential protein identification and protein carbonyl quantification using one spectral acquisition. This is in sharp contrast to fluorescence or immunoassay based techniques that can only detect the signal from the labeling molecule and yield no structural or quantitative information of the protein of interest. Current detection limits with the RMRS technique for protein carbonyl level is 0.33 pmol carbonyl/measurement, which is comparable to that obtained with the immunblotting method, but with much higher quantification accuracy. Extension of the RMRS technique for quantification of other biomolecule modification reactions such as protein glycosylation, protein phosphorylation, and DNA abasic modification may also be possible. The existing chemical tags and/or tagging chemistries developed for the fluorescence detection of the listed biomolecule modifications may be directly applicable or may be easy adapted for the RMRS method. Additional improvement of the sensitivity of the RMRS method could be achieved with the development of more Raman active chemical tags and additional optimization of the data acquisition conditions.
Supplementary Material
References
- 1.Witze ES, Old WM, Resing KA, Ahn NG. Mapping protein post-translational modifications with mass spectrometry. Nat Meth. 2007;4:798–806. doi: 10.1038/nmeth1100. [DOI] [PubMed] [Google Scholar]
- 2.Sohal RS, Agarwal S, Dubey A, Orr WC. Protein Oxidative Damage is Associated with Life Expectancy of Houseflies. PNAS. 1993;90:7255–7259. doi: 10.1073/pnas.90.15.7255. [DOI] [PMC free article] [PubMed] [Google Scholar]
- 3.Wayne FP. A thousand points of light: The application of fluorescence detection technologies to two-dimensional gel electrophoresis and proteomics. Electrophoresis. 2000;21:1123–1144. doi: 10.1002/(SICI)1522-2683(20000401)21:6<1123::AID-ELPS1123>3.0.CO;2-E. [DOI] [PubMed] [Google Scholar]
- 4.Makita Z, Vlassara H, Cerami A, Bucala R. Immunochemical detection of advanced glycosylation end products in vivo. J Biol Chem. 1992;267:5133–8. [PubMed] [Google Scholar]
- 5.Perez-Cerda C, Quelhas D, Vega AI, Ecay J, Vilarinho L, Ugarte M. Screening using serum percentage of carbohydrate-deficient transferrin for congenital disorders of glycosylation in children with suspected metabolic disease. Clin Chem. 2008;54:93–100. doi: 10.1373/clinchem.2007.093450. [DOI] [PubMed] [Google Scholar]
- 6.Seferian KR, Tamm NN, Semenov AG, Tolstaya AA, Koshkina EV, Krasnoselsky MI, Postnikov AB, Serebryanaya DV, Apple FS, Murakarni MM, Katrukha AG. Immunodetection of glycosylated NT-proBNP circulating in human blood. Clin Chem. 2008;54:866–873. doi: 10.1373/clinchem.2007.100040. [DOI] [PubMed] [Google Scholar]
- 7.Chaudhuri AR, de Waal EM, Pierce A, Van RH, Ward WF, Richardson A. Detection of protein carbonyls in aging liver tissue: A fluorescence-based proteomic approach Mech. Ageing Dev. 2006;127:849–861. doi: 10.1016/j.mad.2006.08.006. [DOI] [PubMed] [Google Scholar]
- 8.Li H, Sundararajan N. Charge Switch Derivatization of Phosphopeptides for Enhanced Surface-Enhanced Raman Spectroscopy and Mass Spectrometry Detection. J Proteome Res. 2007;6:2973–2977. doi: 10.1021/pr0606225. [DOI] [PubMed] [Google Scholar]
- 9.Chen S, LaRoche T, Hamelinck D, Bergsma D, Brenner D, Simeone D, Brand RE, Haab BB. Multiplexed analysis of glycan variation on native proteins captured by antibody microarrays. Nat Methods. 2007;4:437–444. doi: 10.1038/nmeth1035. [DOI] [PubMed] [Google Scholar]
- 10.Chen Z, Tabakman SM, Goodwin AP, Kattah MG, Daranciang D, Wang X, Zhang G, Li X, Liu Z, Utz PJ, Jiang K, Fan S, Dai H. Protein microarrays with carbon nanotubes as multicolor Raman labels. Nat Biotech. 2008;26:1285–1292. doi: 10.1038/nbt.1501. [DOI] [PubMed] [Google Scholar]
- 11.Stadtman ER. Protein Oxidation and Aging. Science. 1992;257:1220–1224. doi: 10.1126/science.1355616. [DOI] [PubMed] [Google Scholar]
- 12.Sohal RS. Role of oxidative stress and protein oxidation in the aging process. Free Radical Biol Med. 2002;33:37–44. doi: 10.1016/s0891-5849(02)00856-0. [DOI] [PubMed] [Google Scholar]
- 13.Levine RL. Carbonyl modified proteins in cellular regulation, aging, and disease. Free Radical Biol Med. 2002;32:790–796. doi: 10.1016/s0891-5849(02)00765-7. [DOI] [PubMed] [Google Scholar]
- 14.Robinson CE, Keshavarzian A, Pasco DS, Frommel TO, Winship DH, Holmes EW. Determination of Protein Carbonyl Groups by Immunoblotting. Anal Biochem. 1999;266:48–57. doi: 10.1006/abio.1998.2932. [DOI] [PubMed] [Google Scholar]
- 15.Winterbourn CC, Buss IH, Lester P. Methods in Enzymology. Academic Press; 1999. Protein carbonyl measurement by enzyme-linked immunosorbent assay; pp. 106–111. [DOI] [PubMed] [Google Scholar]
- 16.Mirzaei H, Regnier F. Affinity Chromatographic Selection of Carbonylated Proteins Followed by Identification of Oxidation Sites Using Tandem Mass Spectrometry. Anal Chem. 2005;77:2386–2392. doi: 10.1021/ac0484373. [DOI] [PubMed] [Google Scholar]
- 17.Chung W, Miranda CL. Detection of carbonyl-modified proteins in interfibrillar rat mitochondria using aminooxymethylcarbonylhydrazino--biotin as an aldehyde/keto-reactive probe in combination with Western blot analysis and tandem mass spectrometry. Electrophoresis. 2008;29:1317–1324. doi: 10.1002/elps.200700606. [DOI] [PubMed] [Google Scholar]
- 18.Singh NR, Rondeau P, Hoareau L, Bourdon E. Identification of preferential protein targets for carbonylation in human mature adipocytes treated with native or glycated albumin. Free Rad Res. 2007;41:1078–1088. doi: 10.1080/10715760701487674. [DOI] [PubMed] [Google Scholar]
- 19.Temple A, Yen TY, Gronert S. Identification of Specific Protein Carbonylation Sites in Model Oxidations of Human Serum Albumin. J Amer Soc Mass Spectrom. 2006;17:1172–1180. doi: 10.1016/j.jasms.2006.04.030. [DOI] [PubMed] [Google Scholar]
- 20.Prokai L, Yan L, Vera-Serrano J, Stevens SM, Forster MJ. Mass spectrometry-based survey of age-associated protein carbonylation in rat brain mitochondria. J Mass Spectrom. 2007;42:1583–1589. doi: 10.1002/jms.1345. [DOI] [PubMed] [Google Scholar]
- 21.Levine RL, Williams JA, Stadtman EP, Shacter E, Lester P. Methods in Enzymology. Academic Press; 1994. [37] Carbonyl assays for determination of oxidatively modified proteins; pp. 346–357. [DOI] [PubMed] [Google Scholar]
- 22.Dalle-Donne I, Rossi R, Giustarini D, Milzani A, Colombo R. Protein carbonyl groups as biomarkers of oxidative stress. Clinica Chimica Acta. 2003;329:23–38. doi: 10.1016/s0009-8981(03)00003-2. [DOI] [PubMed] [Google Scholar]
- 23.Zhang D, Xie Y, Mrozek MF, Ortiz C, Davisson VJ, Ben-Amotz D. Raman detection of proteomic analytes. Anal Chem. 2003;75:5703–5709. doi: 10.1021/ac0345087. [DOI] [PubMed] [Google Scholar]
- 24.Ortiz C, Zhang D, Xie Y, Ribbe AE, Ben-Amotz D. Validation of the drop coating deposition Raman method for protein analysis. Anal Biochem. 2006;353:157–166. doi: 10.1016/j.ab.2006.03.025. [DOI] [PubMed] [Google Scholar]
- 25.Gryniewicz CM, Kauffman JF. Multivariate calibration of covalent aggregate fraction to the Raman spectrum of regular human insulin. J Pharm Sci. 2008;97:3727–3734. doi: 10.1002/jps.21326. [DOI] [PubMed] [Google Scholar]
- 26.Xie Y, Zhang D, Ben-Amotz D. Protein-ligand binding detected using ultrafiltration Raman difference spectroscopy. Anal Biochem. 2008;373:154–160. doi: 10.1016/j.ab.2007.10.040. [DOI] [PubMed] [Google Scholar]
- 27.Ortiz C, Zhang D, Ribbe Alexander E, Xie Y, Ben-Amotz D. Analysis of insulin amyloid fibrils by Raman spectroscopy. Biophys chem. 2007;128:150–5. doi: 10.1016/j.bpc.2007.03.012. [DOI] [PubMed] [Google Scholar]
- 28.Ortiz C, Zhang D, Xie Y, Davisson VJ, Ben-Amotz D. Identification of insulin variants using Raman spectroscopy. Anal Biochem. 2004;332:245–252. doi: 10.1016/j.ab.2004.06.013. [DOI] [PubMed] [Google Scholar]
- 29.Xie Y, Zhang D, Jarori Gotam K, Davisson VJ, Ben-Amotz D. The Raman detection of peptide tyrosine phosphorylation. Anal Biochem. 2004;332:116–21. doi: 10.1016/j.ab.2004.05.052. [DOI] [PubMed] [Google Scholar]
- 30.Jarvis RM, Blanch EW, Golovanov AP, Screen J, Goodacre R. Quantification of casein phosphorylation with conformational interpretation using Raman spectroscopy. The Analyst. 2007;132:1053–1060. doi: 10.1039/b702944f. [DOI] [PubMed] [Google Scholar]
- 31.Das G, Mecarini F, De Angelis F, Prasciolu M, Liberale C, Patrini M, Di Fabrizio E. Attomole (amol) myoglobin Raman detection from plasmonic nanostructures. Microelectron Eng. 2008;85:1282–1285. [Google Scholar]
- 32.Filik J, Stone N. Investigation into the protein composition of human tear fluid using centrifugal filters and drop coating deposition raman spectroscopy. J Raman Spectrosc. 2009;40:218–224. [Google Scholar]
- 33.Stadtman E, Oliver C. Metal-catalyzed oxidation of proteins. Physiological consequences. J Biol Chem. 1991;266:2005–2008. [PubMed] [Google Scholar]
- 34.Levine RL, Garland D, Oliver CN, Amici A, Climent I, Lenz A-G, Ahn B-W, Shaltiel S, Stadtman ER, Lester P, Alexander NG. Methods in Enzymology. Academic Press; 1990. Determination of carbonyl content in oxidatively modified proteins; pp. 464–478. [DOI] [PubMed] [Google Scholar]
- 35.Wei F, Zhang D, Halas NJ, Hartgerink JD. Aromatic Amino Acids Providing Characteristic Motifs in the Raman and SERS Spectroscopy of Peptides. J Phys Chem B. 2008;112:9158–9164. doi: 10.1021/jp8025732. [DOI] [PubMed] [Google Scholar]
- 36.Fryling MA, Zhao J, McCreery RL. Resonance Raman Observation of Surface Carbonyl Groups on Carbon Electrodes Following Dinitrophenylhydrazine Derivatization. Anal Chem. 1995;67:967–75. [Google Scholar]
- 37.Curley D, Siiman O. Conformation and orientation of the haptens, 2,4-dinitrophenyl amino acids, on colloidal silver from surface-enhanced Raman scattering. Langmuir. 1988;4:1021–1032. [Google Scholar]
- 38.Zhang D, Ben-Amotz D. Enhanced chemical classification of Raman images in the presence of strong fluorescence interference. Appl Spectrosc. 2000;54:1379–1383. [Google Scholar]
- 39.Vitorino R, Guedes S, Tomer K, Domingues P, Duarte J, Amado F. On-plate digestion using a commercial microfraction collector for nano-HPLC matrix-assisted laser desorption/ionization tandem time-of-flight protein analysis. Anal Biochem. 2008;380:128–130. doi: 10.1016/j.ab.2008.05.006. [DOI] [PMC free article] [PubMed] [Google Scholar]
Associated Data
This section collects any data citations, data availability statements, or supplementary materials included in this article.


