Abstract
Accurate prediction of the binding affinities of small-molecule ligands to their biological targets is fundamental for structure-based drug design but remains a very challenging task. In this paper, we have performed computational studies to predict the binding models of 31 small-molecule Smac (the second mitochondria-derived activator of caspase) mimetics to their target, the XIAP (X-linked inhibitor of apoptosis) protein, and their binding affinities. Our results showed that computational docking was able to reliably predict the binding models, as confirmed by experimentally determined crystal structures of some Smac mimetics complexed with XIAP. However, all the computational methods we have tested, including an empirical scoring function, two knowledge-based scoring functions and MM-GBSA (molecular mechanics generalized Born surface area), yield poor to modest prediction for binding affinities. The linear correlation coefficient (r2) value between the predicted affinities and the experimentally determined affinities was found to be between 0.21 and 0.36. Inclusion of ensemble protein-ligand conformations obtained from molecular dynamic simulations did not significantly improve the prediction. However, major improvement was achieved when the free-energy change for ligands between their free- and bound-states, or “ligand-reorganization free energy”, was included in the MM-GBSA calculation and the r2 value increased from 0.36 to 0.66. The prediction was validated using ten additional Smac mimetics designed and evaluated by an independent group. This study demonstrates that ligand reorganization free energy plays an important role in the overall binding free energy between Smac mimetics and XIAP. This term should be evaluated for other ligand-protein systems and included in the development of new scoring functions. To our best knowledge, this is the first computational study to demonstrate the importance of ligand reorganization free energy for the prediction of protein-ligand binding free energy.
INTRODUCTION
Accurate prediction of the binding affinities of small-molecule ligands to their biological targets is fundamental to structure-based drug design but remains a very challenging task. Over the years, a number of scoring functions have been developed.1 Although these scoring functions can yield good predictions for the binding affinities of small-molecule ligands to their protein targets in some cases, they typically give poor to modest prediction when applied to a large number of proteins from different families and ligands with diverse chemical structures2,3. This is especially troubling even when experimentally determined high-resolution crystal structures of the protein-ligand complexes are used as the starting points for binding-affinity prediction. For example, our previous evaluations of 11 scoring functions showed that the best scoring functions were only able to yield an r2 value of 0.4 for 100 protein-ligand complexes, even when the experimentally determined crystal structures were used4. More recently, we have developed a new knowledge-based scoring function, named M-Score, based upon 2331 high-resolution protein-ligand crystal structures5. Evaluation of M-Score against 896 structurally diverse protein-ligand complexes not included in the training set yielded an overall correlation of r2 = 0.24 between the experimentally determined binding affinities and the calculated scores5. Further analysis of M-score with 17 protein families having more than 10 protein-ligand complex crystal structures for each protein showed that while we were able to achieve good to excellent correlation between the predicted scores and experimentally determined binding affinities with r2 values between 0.42 and 0.85 for six protein families, we obtained poor to modest correlation for nine protein families and anti-correlation for two protein families5. In general, our inability to accurately predict the binding affinities of small-molecule ligands to their biological targets is a major impediment to the success of many structure-based drug design projects. There is therefore a clear need to achieve a much better understanding of the factors that contribute to protein-ligand binding and to include them in the prediction of protein-ligand binding affinities.6
In this study, we have evaluated X-Score7, Drugscore8, M-Score5 and MM-GBSA9 for their ability to predict the binding affinities of 31 small-molecule Smac mimetics to XIAP. The 31 inhibitors include both peptides and peptidomimetics and have binding affinities (Ki) to XIAP ranging from 4 nM to 68 µM. We have found that all these four computational methods yield poor to modest prediction for binding affinities when using a single protein-ligand complex structure. The linear correlation coefficient (r2) value between the experimentally determined affinities and the predicted values was found to be between 0.21 and 0.36. Inclusion of an ensemble of protein-ligand conformations obtained from molecular dynamic (MD) simulation failed to improve the prediction significantly for three of the scoring functions. However, when the reorganization free energy for ligands was included in the MM-GBSA calculation, the r2 value increased from 0.36 to 0.66. The prediction was further validated using additional Smac mimetics from other laboratories.10,11
To our best knowledge, this is the first computational study to demonstrate the importance of ligand reorganization free energy for the prediction of protein-ligand binding free energy. Our present study clearly demonstrates that the reorganization free energy for ligands can make a significant contribution to the overall binding free energy between small-molecule ligands and their biological targets. Accordingly, this term should be included in the development of new computational methods for binding-affinity prediction of protein-ligand interaction.
METHODS AND CALCULATIONS
The XIAP protein consists of three Baculoviral IAP repeat (BIR) domains. It is known that Smac-based peptides bind to both BIR2 and BIR3 domains but have much higher affinities to the BIR3 domain12. Accordingly, our current study has focused on the interaction between XIAP BIR3 domain and Smac mimetics. The XIAP-BIR3 protein used in our simulations consists of 102 residues (L256-E357) with the sequence:
LPRNPSMADYEARIFTFGTWIYSVNKEQLARAGFYALGEGDKVKCFHCGG
GLTDWKPSEDPWEQHAKWYPGCKYLLEQKGQEYINNIHLTHSLEECLVRTTE.
The structure of the complex formed by XIAP-BIR3 and Smac protein was determined previously,13 and the coordinates were obtained from the Protein Data Bank14 (PDB entry: 1G73). Based upon the crystal structure, the first four residues (AVPI) in Smac mediate the interaction between Smac and XIAP BIR3. Thus, only a monomer unit (chain D) of XIAP and the first four residues (AVPI, chain A) of the Smac protein from the x-ray structure were used in the current study.
Models of all compounds were prepared and minimized with the Sybyl15 program. Docking simulations were performed using the GOLD 3.2 program16 to predict their binding models. The center of the binding site was set at T308 of XIAP BIR3 and its radius was defined as 13 Å, large enough to cover all the residues in the binding site. For each genetic algorithm (GA) run, a maximum number of 200,000 operations were performed on a population of 5 islands of 100 individuals. Operator weights for crossover, mutation and migration were set to 95, 95 and 10 respectively. The docking was terminated after 20 runs for each ligand. GoldScore, implemented in Gold 3.2, was used as the fitness function to evaluate the docked conformations. The twenty highest ranked conformations by each fitness function were saved for analysis. Since all the small-molecule inhibitors in our current study were designed to mimic the Smac AVPI peptide in its binding to XIAP BIR3, we used the following two criteria for the selection of the initial binding pose for each compound for subsequent MD simulations: (1) it should be a high ranked pose; and (2) the backbone atoms of the Smac mimetic should closely mimic the corresponding atoms of the Smac AVPI peptide in the crystal structure.
Amber (version 8)17 was used for the MD simulations. The Amber 99 force field parameters18 were used for the amino acids. Some parameters not found in the standard amino acid library are also required to perform the simulations. First, in XIAP-BIR3, a zinc ion is covalently bonded with His320, Cys300, Cys303, and Cys327 in a tetrahedral structure. Because the zinc ion only has a structural role and does not have direct interactions with the ligands, we used the force field parameters derived by Ryde19 and constrained the four residues in the zinc-coordinated center with modest harmonic forces (1 kcal/mol-Å2). Second, we used the Antechamber module in Amber to derive the force field parameters for all the compounds. The protocol for generating the point charge parameters is as follows: The docked pose of each compound was minimized at the RHF level using a 6–31G** basis set with Gaussian9820. The electrostatic field potential calculated from Gaussian98 was used to generate the point charges at each atom site based on the RESP fitting procedure.
To prepare the topology and coordinate files, counter ions were added to neutralize the charges in the complex before it was placed in a 10 Å cubic box of water. The TIP3P21 water model was used. After a 500-step minimization, a 0.5 ps simulation was performed to raise the temperature of the system to 150K, followed by another 1 ps of simulation to increase the temperature further to 298K. The system was then equilibrated for 8.5 ps at 298K. The production run was 1 ns. Conformations were saved from the trajectory at intervals of 0.4 ps. Conformations collected from 0.2 ns to 1 ns were used for the binding affinity prediction calculations. All the MD simulations were in the isothermal isobaric (NTP, T = 298K and P = 1 atm) ensemble. The SHAKE22 algorithm was used to fix bonds involving hydrogen. The PME method23 was used and the non-bonded cutoff distance was set at 10 Å. The time step was 2 fs, and the neighboring pairs list was updated in every 20 steps.
The unbound ligand conformation simulations were performed with the Generalized Born (GB) model.24 The force field parameters of the ligand were the same as those used in the protein-ligand complex simulation. When preparing the topology file, PBradii was set to mbondi2 and igb to 5. During simulations, the nonbonded cutoff distance was set to 999 Å, which was equivalent to no cutoff. Langevin dynamics was turned on with the collision frequency set to 5 ps−1. The temperature of the simulation was set to 300K. A time step of 1 fs was used in the simulation and the total length of simulation was 10 ns. Forty-nine conformations of each ligand from the 10 ns simulation were used for the free energy calculations. Convergence of the results was checked by using twice as many conformations from the same 10 ns simulations.
We evaluated three scoring functions (X-Score7, Drugscore8 and M-Score5) and the MM-GBSA7 method for binding affinity prediction. The ensemble average binding affinity predictions using X-Score, Drugscore and M-Score were calculated as follows: A snapshot of each single protein-ligand complex conformation from the trajectory was used to calculate a single score. It should be noted that the conformations of both the protein and the ligand are different in different snapshots. For every compound, 41 conformations, taken at intervals of 20 ps in the MD simulation (0.2 to 1 ns), were used to compute the average score and standard deviation to represent the binding affinity of each ligand. In the MM-GBSA calculation, the same 41 conformations corresponding to 20 ps intervals in the trajectory were used for the molecular mechanics calculations. Nine conformations (taken at intervals of 100 ps) from the 1 ns trajectory were chosen for the normal mode calculations for entropic contribution to the binding free energy. In the normal mode calculations, a distance-dependent dielectric constant ε = 4r was used, the maximum cycle was set to 60,000, and the convergence tolerance was 0.0002 kcal mol−1Å−1.
In general, the ligand reorganization free energy is defined as the free energy difference of the ligand with conformations at two different states, namely protein-bound and protein-free states. This quantity can be calculated using appropriate theories with consistent force field parameters. In this work, because we used the MM-GBSA model to estimate the relative binding free energy of the ligands and the protein, we used the same level of theory and force field parameters (i.e. MM-GBSA) to estimate the ligand reorganization free energy. Detailed theoretical models and calculations are as follows.
Based on the two-state endpoint approach in the MM-GBSA model25,26, the absolute binding free energy between protein and ligand is defined and can be calculated as:
| (1) |
where Gcomplex(x), Gprotein(unbound) and Gligand(unbound) stand for the free energy of the protein-ligand complex, of the unbound protein and of the unbound ligand in solution. We will use (x) and (unbound) to denote conformations in the protein-ligand complex and the unbound states respectively. Individual terms of the free energy according to the MM-GBSA model are calculated as, Gsolute = EMM + Gsolv − TS, where EMM is the molecular mechanics energy, Gsolv is the solvation free energy and S is the entropy for the solute. A direct computation of the binding free energy using equation (1) will give the absolute binding free energy between the protein and its ligand. However, convergence of the absolute binding free energy typically requires a lengthy simulation. When the relative binding free energies of a series of compounds are needed, the one-state endpoint MM-GBSA model is frequently used in which case only a single trajectory of the protein-ligand complex simulation is needed. The connection between the two-state and one-state endpoint MM-GBSA models can be obtained by rearranging equation (1) as:
| (2) |
where δGprotein,re and δGligand,re are the protein and ligand reorganization free energy, respectively. When calculating the binding free energy of a series of compounds, the two-state endpoint model accounts for the differences of the structural changes in the protein and the ligand upon binding whereas the one-state endpoint model assumes that both δGprotein,re and δGligand,re contribute similarly to the binding free energy. In this assume δGprotein,re is the same for the series of compounds but explicitly included the δGligand,re term for each compound.
To calculate δGligand,re, we need to compute Gligand(x) and Gligand(unbound). Gligand(x) is the free energy of the ligand at the protein-bound state and was calculated directly from the MM-GBSA module in the Amber program suite using the simulated trajectories of the protein-ligand complex system. To be consistent with the force field parameters, Gligand(unbound) was calculated from the same MM-GBSA module using the simulated trajectories of the unbound ligand in the implicit GB solvent model. The choice of using the implicit GB solvent model to sample the unbound ligand conformations as opposed to the explicit solvent model results from considering the computational efficiency and consistency in force field parameters when calculating the free energy of the ligand. To extract Gligand(unbound) in the MM-GBSA module, snapshots of the ligand conformations from the unbound ligand simulations were used and the ligand was treated as a “receptor”. For both Gligand(x) and Gligand(unbound), enthalpic and entropic terms in the free energy were included as has been shown in the equation previously. Throughout the text, we have abbreviated and δGligand,re as ΔG and δΔGre.
RESULTS AND DISCUSSION
Analysis of the Smac binding site in XIAP BIR3
The crystal structure of the XIAP BIR3 domain protein complexed with Smac protein13, and the NMR solution structure of XIAP BIR3 bound to a Smac-based peptide,12 reveal the detailed interactions between Smac and XIAP BIR3 and have provided a structural basis for the design of small-molecule Smac mimetics as inhibitors of XIAP.
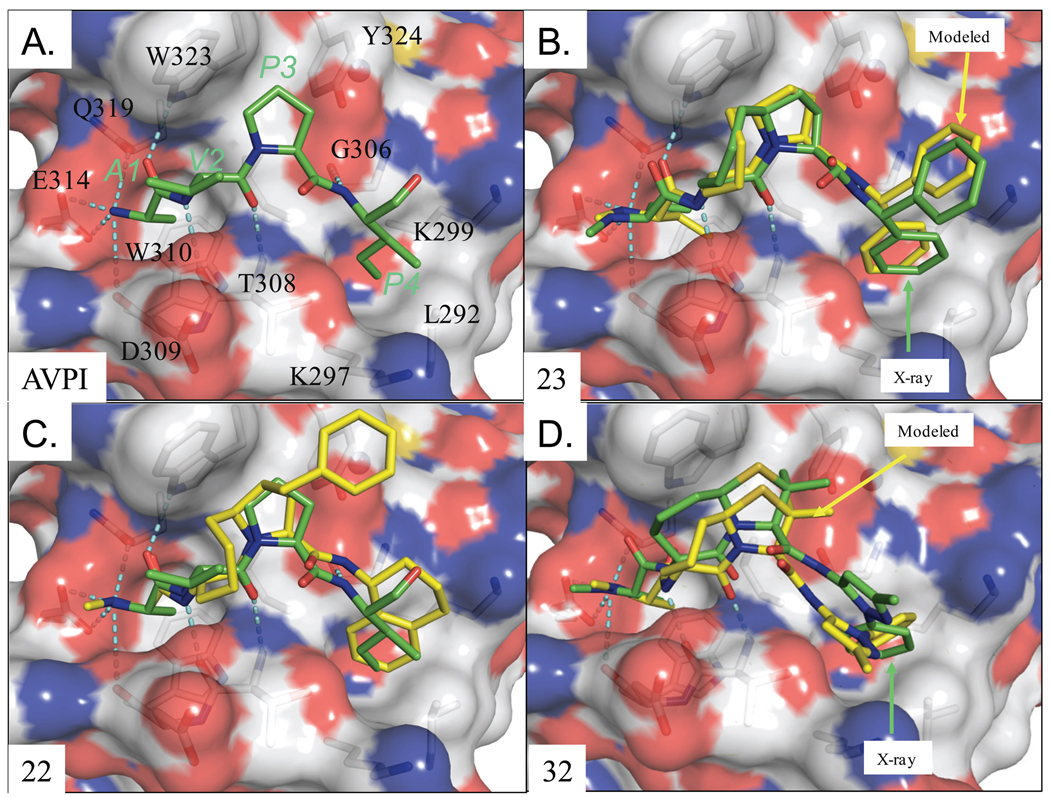
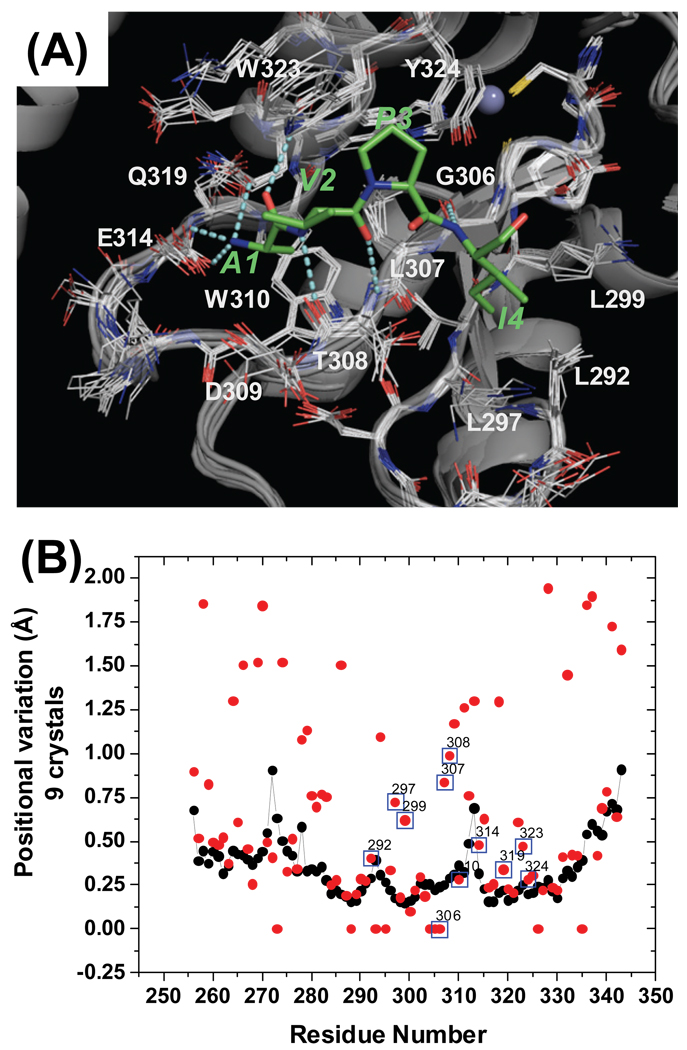
The interactions between Smac and XIAP BIR3 are mediated by the Ala1-Val2-Pro3-Ile4 (A1-V2-P3-I4) four-residue binding motif in Smac and a well-defined groove on the surface of XIAP BIR3 protein.13 The methyl group of the Ala1 residue inserts into a small hydrophobic pocket, the free amino group forms strong hydrogen bonds to the Glu314 and Gln319 residues on the protein, and the backbone carbonyl group forms a suboptimal hydrogen bond to the indole NH group of Trp323. The amino and carbonyl groups of Val2 form optimal hydrogen bonds with the carbonyl and amino groups of Thr308, respectively, while the Val2 side chain is exposed to solvent and has no interaction with protein residues. The 5-membered ring of Pro3 has van der Waals contacts with the side chains of Trp323 and Tyr324 and finally, the amino group of the Ile4 residue forms a hydrogen bond with the carbonyl group of Gly306, and its hydrophobic side chain inserts into the hydrophobic pocket formed by the side chains of Leu292 and Val298 and the hydrophobic portion of the side chains in Lys297 and Lys299.
In addition to these two initial structures, seven crystal structures of small-molecule Smac peptidomimetics and non-peptidic mimetics complexed with XIAP BIR3 protein have been reported, and their coordinates are available in the Protein Data Bank (Supporting Information, Table S1). The availability of these experimental structures afforded us the opportunity to examine if these Smac mimetics have similar interactions with XIAP BIR3 and if ligand binding induces significant conformational change.
Superimposition of the nine available structures of XIAP BIR3 complexed with Smac protein, Smac peptide or small-molecule Smac mimetics showed that positional variation of the backbone atoms around the binding site (residues 292 to 324) in XIAP is minimal, with a root-mean-standard-deviation (RMSD) between 0.20Å and 0.75Å. Positional variations of the side chain of residues directly interacting with ligands (L292, K297, K299, L307, W310, E314, Q319, W323 and Y324) are also small and the RMSD value for non-hydrogen side chain atoms is between 0.28Å (W310) and 0.73Å (K297). Thus, the very similar conformations for the XIAP binding-site when bound to different ligands in these crystal structures suggest that the binding site may have limited conformational flexibility.
A possibility that the XIAP binding-site adopts similar conformations in the crystal structures is that all these small-molecule Smac mimetics were designed based upon the Smac AVPI peptide, and thus have very similar interactions with XIAP. To further assess the conformational flexibility of the XIAP binding site, we removed the peptide from the crystal structure of XIAP BIR3 complexed with the AVPI peptide and performed a lengthy (9 ns) MD simulation on the ligand-free XIAP BIR3 structure in the presence of explicit water molecules. This MD simulation showed that in the first 5.4 ns, the backbone atoms of the binding site (R285-P325) deviate very little from the ligand-bound conformation, with an RMSD around 0.8 Å for all non-hydrogen atoms (Supporting Information, Figure S1). After 5.4 ns, an increase in the RMSD of the backbone atoms to around 1.2 Å was observed. This increase in the backbone RMSD was found to be primarily attributable to the motion of the loop between K311 and D315. Since the hydrophobic side chain of W323 is exposed to solvent and is involved in interactions with the ligands, we expected that this residue might undergo a major conformational change to refold its hydrophobic side chain onto the binding site in the absence of the ligand. It was found however that throughout the entire 9 ns simulation, W323 remained in its open conformation.
Taken together, the MD simulations with the experimental structures of XIAP BIR3 complexed with different ligands indicate that XIAP BIR3 has a well-defined binding site with limited flexibility.
Computational prediction of the binding models of Smac mimetics to XIAP BIR3
Binding models of these Smac mimetics, including both peptidomimetics and non-peptidic mimetics, to XIAP BIR3 were predicted using the GOLD program, starting from the high-resolution crystal structure of XIAP BIR3 complexed with Smac.13 The chemical structures of these Smac-based ligands and their binding affinities to XIAP BIR3 are provided in Table 1.
Table 1.
Chemical Structures of Smac mimetics and their binding affinities to XIAP BIR3 studied in this work.
| Compd. | Ref. | Structure | Ki ± SD (µM) | Compd. | Ref. | Structure | Ki ± SD (µM) |
|---|---|---|---|---|---|---|---|
| 1 | 32 |  |
0.29 ± 0.07 | 17 | 33 |  |
54 ± 7 |
| 2 | 32 |  |
4.47 ± 0.65 | 18 | 34 | 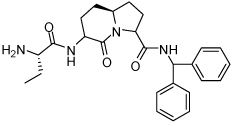 |
0.35 ± 0.005 |
| 3 | 33 |  |
13.40 ± 1.6 | 19 | 32 | 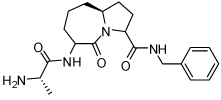 |
0.16 ± 0.02 |
| 4 | 33 |  |
2.45 ± 0.7 | 20 | 35 | 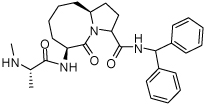 |
0.026 ± 0.0026 |
| 5 | 33 |  |
4.41 ± 1.5 | 21 | 36 | 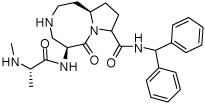 |
0.02 ± 0.0145 |
| 6 | 33 |  |
1.27 ± 0.2 | 22 | 37 | 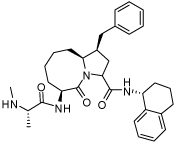 |
0.0039 ± 0.0018 |
| 7 | 33 |  |
0.22 ± 0.07 | 23 | 34 | 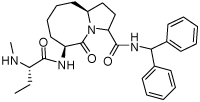 |
0.067 ± 0.0018 |
| 8 | 33 |  |
0.18 ± 0.07 | 24 | 37 | 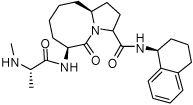 |
0.209 ± 0.073 |
| 9 | 33 |  |
4.9 ± 2.1 | 25 | 37 | 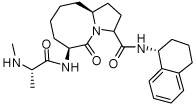 |
0.014 ± 0.005 |
| 10 | 33 |  |
0.15 ± 0.09 | 26 | 36 | 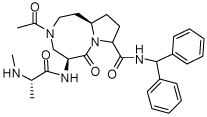 |
0.0054 ± 0.003 |
| 11 | 33 | 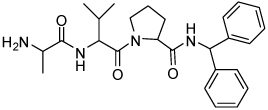 |
0.028 ± 0.020 | 27 | 36 | 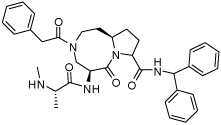 |
0.0084 ± 0.0016 |
| 12 | 33 | 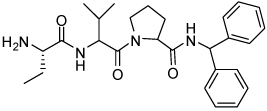 |
0.024 ± 0.020 | 28 | 38 | 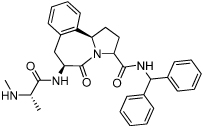 |
0.030 ± 0.0044 |
| 13 | 33 |  |
1.2 ± 0.4 | 29 | 38 | 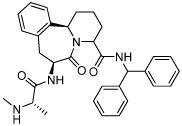 |
0.69 ± 0.2 |
| 14 | 33 |  |
68 ± 7 | 30 | 38 | 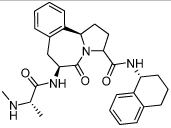 |
0.018 ± 0.010 |
| 15 | 33 |  |
0.081 ± 0.06 | 31 | 33 |  |
0.58 ± 0.15 |
| 16 | 33 |  |
4.15 ± 1.2 |
Analysis of the predicted binding models for these compounds showed that they all have very similar interactions with XIAP BIR3. The key charge-charge interactions, hydrogen bonding and hydrophobic contacts observed between the Smac AVPI peptide and XIAP BIR3 were essentially maintained in the predicted binding models for each of these compounds.
Since the binding model for compound 23 (SM-130) was predicted prior to the determination of its crystal structure in complex with XIAP BIR3, it provided an opportunity to directly validate the predicted binding model for this compound. Our analysis showed that the peptidic backbone conformation of compound 23 is the same in the predicted model and the crystal structure. The small binding cavity, in which Ala1 in Smac docks, has adequate room for the additional carbon atom of the ethyl group in compound 23. This ethyl group adopts two slightly different orientations in the model and in the crystal structure. The model also shows a more energetically favorable conformation for the peptide bond connecting the lactam and the biphenyl group as opposed to the distorted conformation in the crystal structure. Finally, the biphenyl group in compound 23 assumes the same orientation in the model and in the crystal structure.
The predicted binding model for 22 from our group and that for 32 reported by scientists from Genentech are shown in Figure 3 (B)–3(D). The crystal structure of compound 32 in the complex with an XIAP-ML-IAP BIR3 chimera has been reported (PDB ID: 2I3I), and closely mimics the predicted binding pose for this compound complexed with XIAP. The bicyclic core of compound 32 in the docked pose has less contact with the protein surface than that in the chimera crystal structure, which may be attributed to the fact that Phe324 in the chimera protein is replaced with a slightly bulkier and polar Tyr324 in XIAP BIR3.
Figure 3.
(A) Crystal structure of XIAP-BIR3 and the AVPI peptide (PDB entry: 1G73) in green. XIAP-BIR3 residues interacting with the AVPI peptide are labeled in black. (B) Binding model of compound 23 and XIAP-BIR3 superimposed with the crystal structure (RMSD=0.81 Å). (C) Binding model of XIAP-BIR3 with compound 22 and (D) with compound 32. The AVPI peptide is superimposed with compounds 22 in (C). The crystal structure of compound 32 is with XIAP-ML-IAP chimera protein.
Assessment of the binding affinities of Smac mimetics to XIAP using a single binding model
Based upon the predicted binding models for Smac ligands, we have calculated their relative binding affinities using three different scoring functions, X-Score, Drugscore and M-Score, and correlated the calculated values with their experimentally determined Ki values binding to XIAP BIR3. We included compounds 1–31 in the correlation analysis since their binding affinities to XIAP BIR3 were determined under the same assay conditions.
As seen in Figure 4, the r2 between the calculated relative binding affinities or scores and experimentally determined Ki values are 0.16 by X-Score, 0.25 by Drugscore and 0.30 by M-Score, respectively. Hence, all these three scoring functions yield poor to modest accuracy in their prediction of the relative binding affinities for these 31 Smac ligands.
Figure 4.
Correlation between the experimental Ki values and the binding affinities for 31 compounds, calculated by three scoring functions. (A) X-Score, (B) Drugscore, (C) M-Score. A single docked pose of each compound was selected from the docking simulation using GOLD v3.2.
Prediction of the binding affinities of Smac mimetics to XIAP using an ensemble of binding models
Although it has been a common practice to use a single predicted binding model for each compound to assess the relative binding-affinities between a set of compounds, this practice has its inherent limitations. For example, although the highest ranked binding pose based upon the scoring function in the GOLD program was selected as the predicted binding model for each ligand, there were a number of top ranked binding poses which were similar but not identical to the highest ranked binding pose. Furthermore, although our MD simulation of the XIAP BIR3 protein suggested that its binding site has limited flexibility, a number of polar/charged side chains of key binding residues exhibited significant conformational changes during the 9 ns simulation. Therefore, we tested whether inclusion of an ensemble of binding poses for each compound can improve the prediction of the relative binding affinities of Smac ligands to XIAP over the use of a single binding pose for each compound.
To generate an ensemble of conformations, MD simulation was performed for each protein-ligand complex in the presence of explicit water molecules starting from the predicted binding pose. The ensemble of conformations was then used to calculate an average score by X-score, Drugscore and M-score for each protein-ligand complex. A correlation analysis between the averaged scores and the experimentally determined Ki values is shown in Figure 5. As can be seen, using the average scores generated from an ensemble of conformations for protein-ligand complexes generally improved the correlation between the predicted scores and the experimental Ki values for all three scoring functions. However, the overall correlation obtained for each of the scoring functions is still modest. The largest improvement was observed for Drugscore, in which the r2 value improves from 0.25 to 0.36.
Figure 5.
Correlation between the experimental Ki values and the binding affinities for 31 compounds, calculated by three scoring functions. (A) X-Score, (B) Drugscore, (C) M-Score. 41 snapshots taken from a 1 ns simulation between XIAP-BIR3 and compounds were used to calculate the ensemble average scores. Standard deviations of the scores for each compound calculated from the ensemble structures are shown with bars.
Prediction of the binding affinities using the MM-GBSA method
Since use of an ensemble of conformations still only yielded modest accuracy by Drugscore, M-score and X-score in the prediction of the relative binding affinities for these Smac ligands, we next evaluated the MM-GBSA method. In the context of using an ensemble of conformations for binding affinity assessment, the MM-GBSA method provides several advantages. First, the same force field parameters are used for simulation and post-processing for calculating binding affinity. Second, individual free-energy components can be analyzed. Third, other parameters related to the overall binding free energy, such as conformational free-energy changes for a protein and ligand that cannot be obtained from the protein-ligand complex structure alone, can be considered on the same theoretical basis.
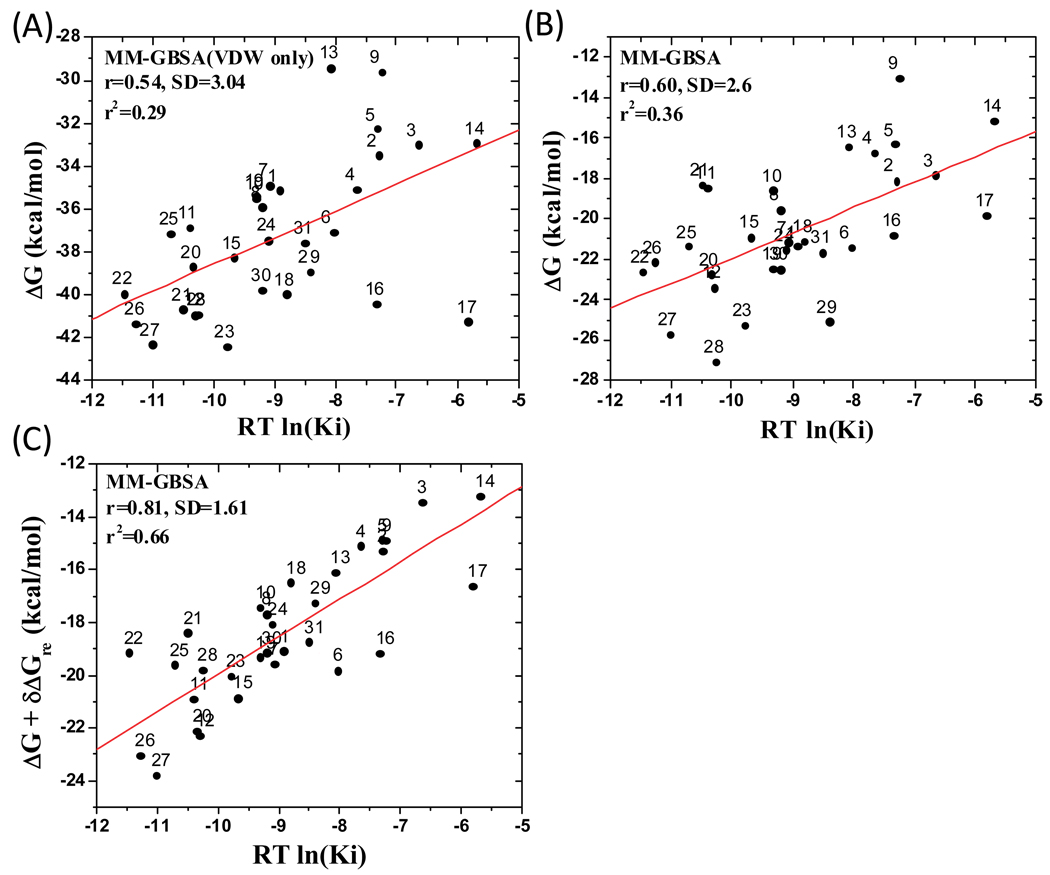
We first performed energetic decomposition and correlated each term with the experimental Ki values. It was found that the most significant correlation is between the van der Waals interaction of ligands with protein and the experimentally determined Ki values, yielding an r2 value of 0.29. This correlation is similar to those obtained by Drugscore, M-score and X-score. Including all other terms in the MM-GBSA method (Table S3, Supporting Information), the r2 value increases from 0.29 to 0.36 [Figure 6(B)]. Hence, our MM-GBSA analysis showed that the dominant contribution to the binding affinity difference of these 31 compounds with XIAP BIR3 is from the van der Waals interaction, but the correlation is still modest.
Figure 6.
Correlation for 31 compounds between the experimental Ki values and (A) van der Waals interaction, (B) binding free energy, (C) binding free energy with ligand reorganization free energy upon binding based on the MM-GBSA method. Here, ΔG is the calculated binding free energy based on the protein-ligand complex conformations.
Inclusion of ligand reorganization free energy in the MM-GBSA calculation
In our design of Smac mimetics, we have applied the classical conformational constraining strategy on the Smac peptide to improve their binding affinities to XIAP by reducing the entropic cost. Therefore, we next investigated whether inclusion of ligand reorganization free energy, the free-energy change between protein-free and protein-bound states for the ligands, can significantly improve the correlation in the MM-GBSA calculation. Since the binding site of XIAP BIR3 adopted a very similar conformation when bound to different ligands in the crystal structures and based upon our computational studies, we made an assumption that the XIAP protein has a similar conformational free-energy change upon binding to different ligands and focused our investigation on the ligand conformational free energy.
We generated ligand ensemble conformations in the protein-bound and protein-free states through MD simulations, which were necessary to calculate the ligand reorganization free energy change. Because ligands bound to the protein occupy a restricted conformational space, a relatively short simulation (1 ns) was performed to sample the ligand conformations bound to the protein. Ligands in the protein-free state (i.e. in solution) are much less restricted by the environment and much longer simulation is needed to adequately sample their conformational space. Accordingly, we performed a 10 ns simulation for each ligand using the generalized Born (GB) inexplicit solvation model. Conformations of the ligand from both simulations were used to calculate the free energies of the ligand in the respective states and the difference between them is the ligand reorganization free energy.
This calculated ligand reorganization free energy was then included in the correlation analysis, together with other terms calculated using the MM-GBSA method, and the results are shown in Figure 6C. As can be seen, inclusion of the ligand reorganization free-energy change significantly improves the correlation between the calculated binding free energies and experimental Ki values for these 31 Smac ligands. The r2 value was increased from 0.36 to 0.66 and the standard deviation (SD) was improved by 1.0 kcal/mol, from 2.6 to 1.6 kcal/mol.
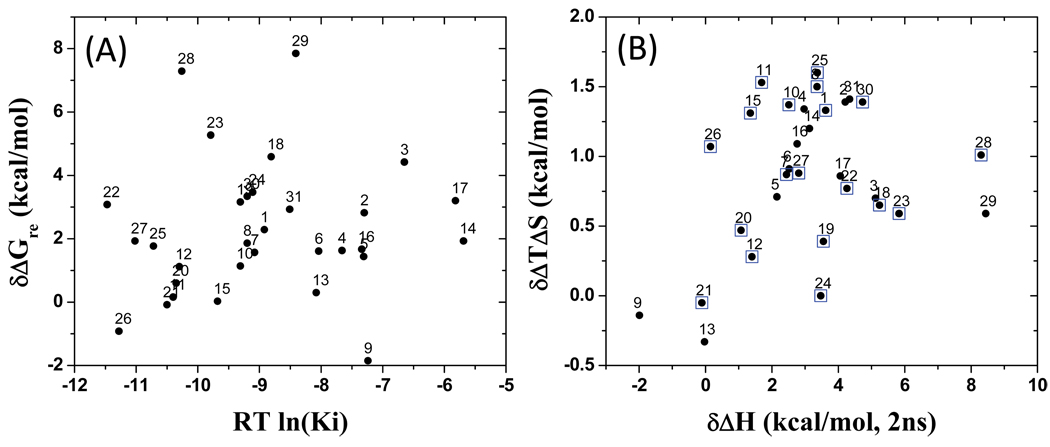
Analysis of the ligand reorganization free energy showed that between different ligands, there is a quite large variation in this term. The most positive contributions (most negative values for δΔGre) are −1.85 and −0.92 kcal/mol for compounds 9 and 26, respectively. The most negative contributions (most positive values for δΔGre) are 7.85, 7.29 and 5.24 kcal/mol for compounds 29, 28 and 23, respectively. The most potent compounds 26, 27 and 25 have a relatively small penalty in their ligand reorganization free energy; an exception is found in compound 22.
We decomposed the ligand reorganization free energy into the enthalpic and entropic terms. One major surprise to us was that there is a positive entropic contribution (negative value for −δΔTΔS) for most compounds but a negative enthalpic contribution for all the compounds except 9, 21 and 26. Most of the compounds gain some entropy (up to 1.62 kcal/mol) but lose more enthalpy (up to 8.44 kcal/mol) when they transition from the protein-free to protein-bound state (Figure 7B). On average, enthalpic loss dominates over entropic gain by a factor of 6, and while the reorganization enthalpic loss can change the total ΔH by about 25%, the entropic gain resulting from reorganization accounts for at most 9% of the total TΔS (cf. Supporting Information, Tables S3 and S4).
Figure 7.
(A) Ligand reorganization free energy upon binding (δΔGre) of the 31 ligands versus their binding affinity. (B) Ligand reorganization enthalpy (δΔH) loss versus entropy gain (δTΔS) upon binding of the 31 compounds. Compounds enclosed by squares are more potent than the AVPI peptide.
To quantify the ligand conformational changes between protein-bound and protein-free states, we use the radius of gyration, commonly used in protein folding studies, as an indicator. The average radius of gyration (Rg) of the ligands in protein-bound and protein-free states is found to be 4.68 and 4.22 Å, respectively (Table S5, Supporting Information), indicating that there is a 10% extension of the ligand geometry upon binding. The data are consistent with the structural information that these ligands adopt an extended conformation when bound to the protein, similar to the β-turn conformation of the Smac AVPI peptide that is observed in the crystal structure. In solution, they form more compact conformations, corresponding to the hydrophobic collapse of the side chains of A1, P3, and I4. Such conformational changes allow ligands to maximize hydrophobic contact with the protein and minimize their hydrophobic surface in solution.
Leave-one-out cross-validation
We next performed the leave-one-out cross-validation to further examine the improvement in binding affinity prediction by inclusion of the ligand reorganization free energy in the MM-GBSA calculation. The results are provided in Table 2.
Table 2.
Leave-one-out correlation and cross-validation of the 31 compounds between the experimental Ki values and binding affinity calculations from the MM-GBSA method (ΔG) and MM-GBSA + ligand reorganization free energy (ΔG+δΔGre).
| Compound # | RT ln(Ki) | ΔG | Leave one out r2 |
prediction | Error | ΔG+δΔGre | Leave one out r2 |
prediction | Error |
|---|---|---|---|---|---|---|---|---|---|
| 1 | −8.92 | −21.36 | 0.36 | −9.56 | −0.64 | −9.40 | 0.65 | −18.39 | −0.48 |
| 2 | −7.30 | −18.12 | 0.35 | −6.91 | 0.39 | −6.65 | 0.64 | −16.20 | 0.65 |
| 3 | −6.65 | −17.86 | 0.34 | −6.74 | −0.09 | −5.17 | 0.63 | −15.43 | 1.48 |
| 4 | −7.66 | −16.73 | 0.34 | −5.64 | 2.02 | −6.48 | 0.65 | −16.73 | 1.18 |
| 5 | −7.31 | −16.31 | 0.34 | −5.26 | 2.05 | −6.31 | 0.64 | −16.24 | 1.00 |
| 6 | −8.04 | −21.43 | 0.37 | −9.63 | −1.59 | −9.96 | 0.68 | −17.06 | −1.92 |
| 7 | −9.08 | −21.14 | 0.36 | −9.37 | −0.29 | −9.76 | 0.66 | −18.61 | −0.68 |
| 8 | −9.20 | −19.54 | 0.36 | −8.04 | 1.16 | −8.37 | 0.66 | −18.85 | 0.83 |
| 9 | −7.24 | −13.03 | 0.34 | −1.91 | 5.33 | −6.32 | 0.64 | −16.14 | 0.92 |
| 10 | −9.31 | −18.58 | 0.37 | −7.26 | 2.05 | −8.19 | 0.66 | −19.02 | 1.12 |
| 11 | −10.40 | −18.48 | 0.40 | −7.23 | 3.17 | −10.71 | 0.64 | −20.47 | −0.31 |
| 12 | −10.30 | −23.41 | 0.35 | −11.25 | −0.95 | −11.80 | 0.65 | −20.24 | −1.50 |
| 13 | −8.08 | −16.40 | 0.35 | −5.36 | 2.72 | −7.23 | 0.65 | −17.28 | 0.85 |
| 14 | −5.69 | −15.15 | 0.30 | −4.21 | 1.48 | −5.11 | 0.60 | −14.01 | 0.58 |
| 15 | −9.68 | −20.90 | 0.36 | −9.15 | 0.53 | −10.71 | 0.65 | −19.43 | −1.03 |
| 16 | −7.34 | −20.84 | 0.38 | −9.17 | −1.83 | −9.50 | 0.70 | −15.98 | −2.16 |
| 17 | −5.82 | −19.83 | 0.40 | −8.47 | −2.65 | −7.83 | 0.69 | −13.53 | −2.01 |
| 18 | −8.81 | −21.08 | 0.36 | −9.33 | −0.52 | −7.51 | 0.66 | −18.32 | 1.30 |
| 19 | −9.31 | −22.47 | 0.36 | −10.47 | −1.16 | −9.56 | 0.65 | −18.95 | −0.25 |
| 20 | −10.35 | −22.71 | 0.35 | −10.64 | −0.29 | −11.66 | 0.64 | −20.32 | −1.31 |
| 21 | −10.50 | −18.32 | 0.41 | −7.12 | 3.38 | −8.84 | 0.68 | −20.80 | 1.66 |
| 22 | −11.47 | −22.62 | 0.36 | −10.46 | 1.01 | −9.32 | 0.70 | −22.41 | 2.15 |
| 23 | −9.79 | −25.28 | 0.36 | −12.93 | −3.14 | −10.09 | 0.65 | −19.62 | −0.30 |
| 24 | −9.11 | −21.54 | 0.36 | −9.70 | −0.59 | −8.66 | 0.66 | −18.70 | 0.45 |
| 25 | −10.72 | −21.36 | 0.37 | −9.48 | 1.24 | −9.70 | 0.66 | −21.06 | 1.02 |
| 26 | −11.28 | −22.11 | 0.36 | −10.05 | 1.23 | −12.35 | 0.62 | −21.58 | −1.07 |
| 27 | −11.02 | −25.71 | 0.32 | −13.39 | −2.37 | −13.02 | 0.63 | −21.12 | −2.00 |
| 28 | −10.26 | −27.10 | 0.35 | −14.72 | −4.46 | −9.89 | 0.65 | −20.33 | 0.37 |
| 29 | −8.41 | −25.10 | 0.41 | −12.56 | −4.15 | −8.08 | 0.65 | −17.71 | 0.33 |
| 30 | −9.20 | −22.49 | 0.36 | −10.49 | −1.29 | −9.45 | 0.65 | −18.80 | −0.25 |
| 31 | −8.51 | −21.66 | 0.37 | −9.81 | −1.30 | −9.16 | 0.66 | −17.81 | −0.65 |
| Mean ± SD | 0.36 ± 0.02 | 0.65 ± 0.02 | |||||||
| Average unsigned error(kcal/mol) | 1.78 | 1.03 | |||||||
Without the ligand reorganization free-energy term (ΔG only), the cross-validated r2 is 0.36 ± 0.02 in the leave-one-out analysis. In comparison, inclusion of δΔGre in the leave-one-out analysis improves the cross-validated r2 value to 0.65 ± 0.02. Importantly, the average unsigned error was reduced to 1.03 kcal/mol from 1.78 kcal/mol by inclusion of the ligand reorganization free-energy term in the cross-validation analysis.
Prediction of the binding affinities of ten Smac mimetics
We next assessed the true predictive power of the MM-GBSA calculation with or without the ligand reorganization free energy for novel compounds not included in the correlation analysis.
The regression calculation in Figure 6C gives a relation between calculated binding free energy (ΔG+δΔGre) and experimental Ki value [RT ln(Ki)] in equation 1:
| (3) |
where the number in parentheses is the fitting error of each parameter27 and the standard deviation of the fit is 1.61 kcal/mol.
When only ΔG is used, equation 2 was obtained:
| (4) |
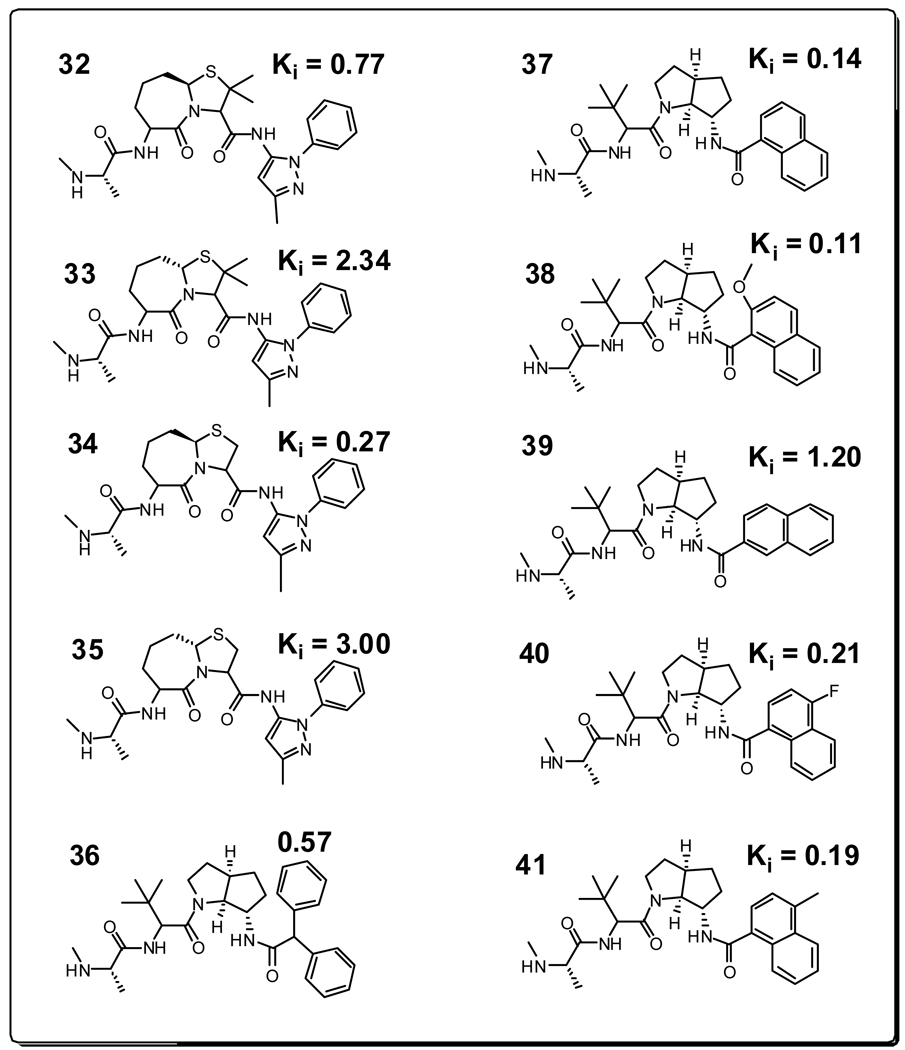
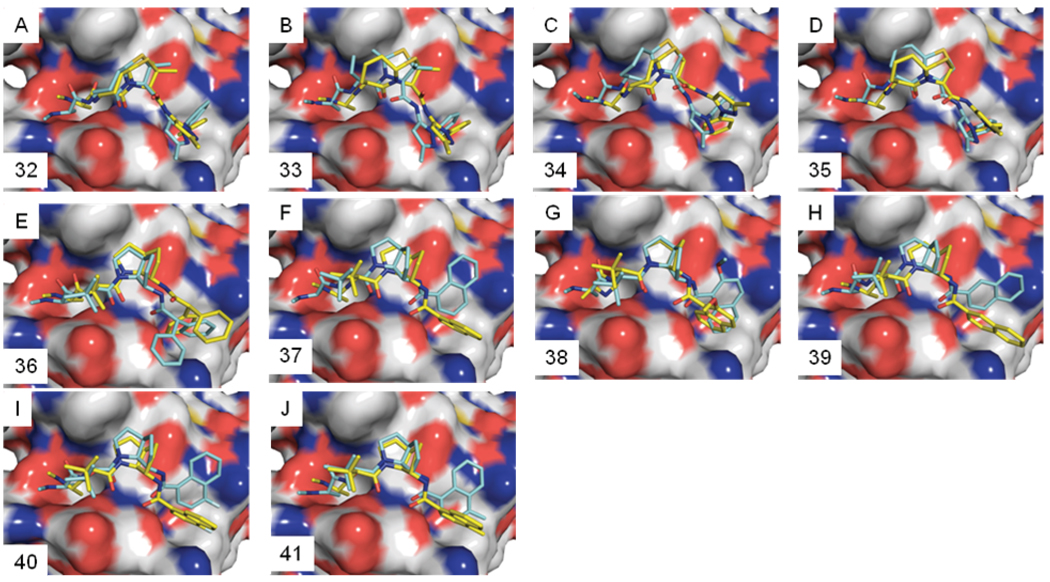
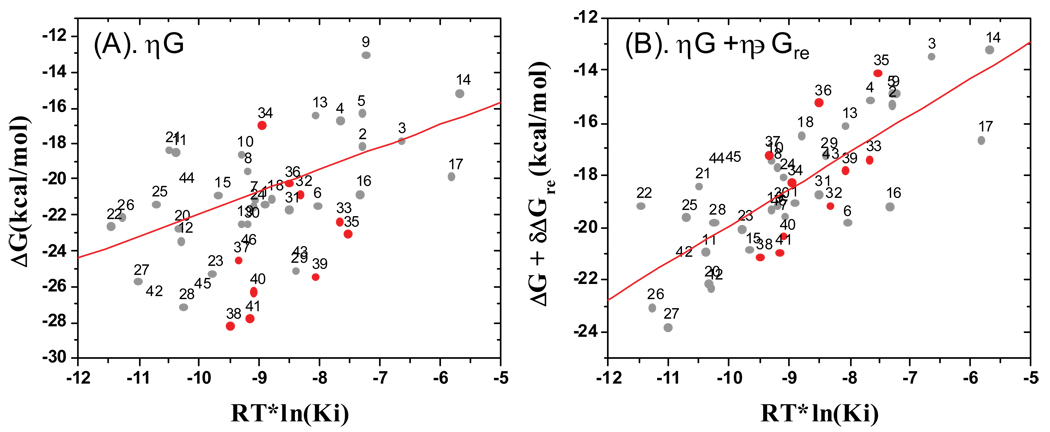
Equation 3 and Equation 4 were then used to predict the binding affinities of ten Smac mimetics (compounds 32–41 in Figure 8), which were reported by scientists from Genentech.10,11,28,29 The crystal structures of compounds 32, 36 and 37 with the XIAP-ML-IAP chimera have been determined (PDB entries, 2I3I, 3F7H and 3F7I)10,11. Since the binding sites between XIAP-ML-IAP chimera and XIAP BIR3 are similar, these crystal structures can be used to validate our predicted binding poses for compounds 32–41 to XIAP BIR3. The docked pose and the final snapshots of the 1 ns MD simulations of compounds 32–41 are depicted in Figure 9, which show that there are substantial changes of the initial docked poses for these compounds upon MD simulations.
Figure 8.
Chemical structures of new Smac mimetics used in the validation and their binding affinities with XIAP BIR3 obtained from references 10,11.
Figure 9.
Predicted binding models for ten new Smac mimetics used in the validation. (A–J) Initial docking poses (yellow) and the final snapshot (blue) of structures from the 1 ns simulations. The surface representation is the XIAP BIR3 structure used in docking simulations.
The predictions using equation 3 and equation 4 for compounds 32–41 are provided in Table 3 and Figure 10. Using only ΔG (equation 4), the average unassigned error of the predicted binding affinities for compounds 32–41 from the experimentally determined values is 3.26 kcal/mol. In comparison, using ΔG+δΔGre (equation 3), the average unassigned error of the predicted binding affinities for compounds 32–41 from the experimentally determined values is 1.11 kcal/mol. As can be seen from Figure 10, the predicted values for compounds 32–41 (depicted in red circle) all fall within the error ranges observed for compounds 1–31 (depicted in grey dots). The predicted r2 value was improved from 0.13 for compounds 32–41 when equation 2 was used, to 0.45 when equation 3 was used. The lower predicted r2 value of 0.45 for compounds 32–41 than the cross-validated r2 value of 0.65 for compounds 1–31 may be attributed, at least in part, to the fact that the binding affinity difference between compounds 32–41 is only 30 times. These data strongly suggest that inclusion of the ligand reorganization free energy in the MM-GBSA calculation not only significantly improves the correlation between the calculated values and the experimentally determined binding affinities for compounds in the training set, but also greatly enhances the prediction of the binding affinities for new compounds.
Table 3.
Cross-validation using ten compounds from Genentech. All units are in kcal/mol.
| Compound # | RT*ln(Ki), kcal/mol | ΔG | predicton | Error | ΔG + δΔGre | prediction | Error |
|---|---|---|---|---|---|---|---|
| 32 | −8.34 | −20.84 | −9.12 | −0.78 | −19.14 | −9.44 | −1.10 |
| 33 | −7.68 | −22.31 | −10.3 | −2.62 | −17.40 | −8.20 | −0.52 |
| 34 | −8.96 | −16.97 | −6.01 | 2.95 | −18.29 | −8.83 | 0.13 |
| 35 | −7.54 | −23.05 | −10.89 | −3.35 | −14.08 | −5.84 | 1.70 |
| 36 | −8.52 | −20.24 | −8.64 | −0.12 | −15.21 | −6.64 | 1.88 |
| 37 | −9.35 | −24.5 | −12.06 | −2.71 | −17.22 | −8.07 | 1.28 |
| 38 | −9.49 | −28.16 | −14.99 | −5.50 | −21.13 | −10.85 | −1.36 |
| 39 | −8.08 | −25.44 | −12.81 | −4.73 | −17.80 | −8.48 | −0.40 |
| 40 | −9.11 | −26.28 | −13.49 | −4.38 | −20.32 | −10.27 | −1.16 |
| 41 | −9.17 | −27.75 | −14.67 | −5.5 | −20.92 | −10.7 | −1.53 |
| Average unsigned error (kcal/mol) | 3.26 | 1.11 | |||||
Figure 10.
Validation of the MM-GBSA methods with ten novel Smac mimetics. (A) Binding free energy calculated using the MM-GBSA method without inclusion of the ligand reorganization free energy (B) Binding free energy calculated using the MM-GBSA method with inclusion of the ligand reorganization free energy. The red circles are for compounds 32–41, whereas the grey circles are for compound 1–31, used as references.
SUMMARY
Despite significant progress, accurate prediction of the binding affinities (binding free-energies) of protein-ligand interaction remains a very challenging task. Poor prediction for protein-ligand affinities may arise from incorrectly predicted binding models, lack of consistent binding data obtained using different assay methods and conditions, and defects in computational methods for calculating the binding affinity of a protein-ligand complex. In this study, we have performed computational studies to investigate the strengths and weaknesses of current computational methods for the prediction of binding models, as well as binding affinities. We have chosen the XIAP protein and its ligands (which are also called Smac mimetics) as our model system due to the following reasons: (1). the availability of a number of high-resolution crystal structures for this system; (2). the availability of a relatively large number of designed ligands for XIAP, both peptides and non-peptidic in nature; (3). the availability of consistent experimental binding affinity data obtained using the same method and under the same assay conditions; and (4). The important role of this system in regulation of apoptosis.
Our studies showed that computational docking was able to reliably predict the binding models of these Smac mimetics to XIAP, as confirmed by crystal structures for some of these compounds. However, all of the four computational methods tested (X-Score, Drugscore, M-Score and MM-GBSA) yield poor to modest correlations between computational scores and experimentally determined binding affinities. Inclusion of the ensemble conformations for the protein-ligand complex structures failed to yield a significant improvement. A major improvement to the correlation by the MM-GBSA method was found when the ligand reorganization free energy change between protein-free and protein-bound states was included in the calculation, which improved the correlation r2 value from 0.36 to 0.66, and the unassigned error from 2.6 to 1.6 kcal/mol. Our leave-one-out cross-validation analysis further showed that inclusion of the ligand reorganization free energy change in the MM-GBSA calculation indeed significantly improves the prediction accuracy. Importantly, when tested for ten new compounds reported by another research group, significant improvement in binding affinity prediction accuracy was also observed with the inclusion of the ligand reorganization free energy change.
The majority of the current computational methods for binding affinity prediction include terms accounting for the interaction energy between protein and ligand and desolvation effect for both ligand and protein. However, the importance of the ligand reorganization free energy between protein-free and protein-bound states, as well as that of the protein reorganization free energy between ligand-free and ligand-bound states, for the overall binding free-energy between protein and ligand is not known. This is in part due to the experimental difficulty in obtaining the ensemble conformations for both ligand and protein in two different states.30,31 Using computational methods, our present study clearly shows that the ligand reorganization free energy change between protein-free and protein-bound states can play a very important role in the binding affinity between small-molecule inhibitors and their targets. This term should be evaluated in the binding affinity prediction for other protein-ligand systems and in the development of a new generation of scoring functions with improved accuracy. To our knowledge, this is the first computational study which examines the importance of the ligand reorganization free energy between protein-free and protein-bound states for the prediction of protein-ligand binding free energy.
In our present study, we have found that the XIAP protein experiences very limited conformational changes when binding to different ligands. Furthermore, the small-molecule inhibitors of XIAP in our study were all designed to mimic the Smac AVPI peptide and have very similar interactions with the protein, both in our predicted models and in the crystal structures. Therefore, we made an assumption that the XIAP protein reorganization free energy changes between ligand-free and ligand-bound states for these ligands are similar. This assumption may not be valid in cases in which a protein adopts very different conformations as it binds to different ligands and/or ligands vary significantly in their binding modes. In such cases, both the ligand and protein reorganization free energy terms may have to be included in order to significantly improve binding affinity prediction between proteins and ligands. We are currently investigating the importance of the protein reorganization free energy term in binding affinity prediction, and the results will be reported in due course.
Supplementary Material
Figure 1.
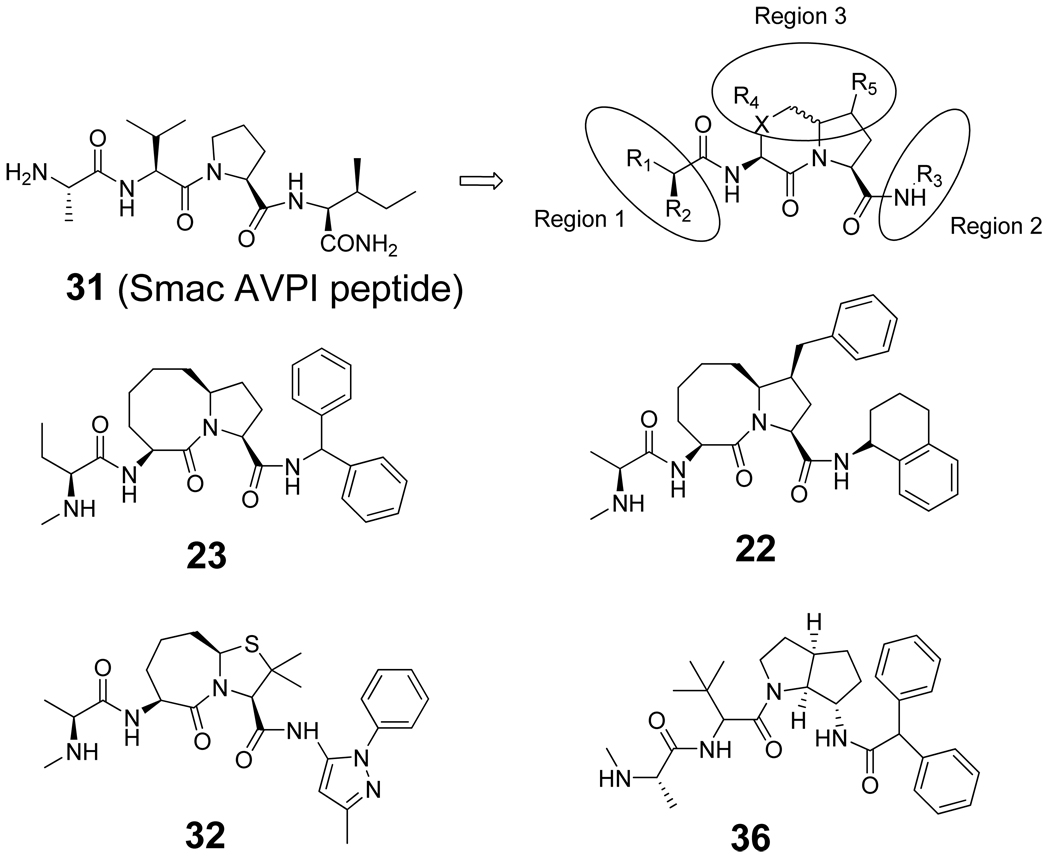
Smac AVPI peptide and the general modification strategy for the design of small-molecule Smac mimetics. Compounds 22 and 23 were designed in our laboratory, whereas compounds 32 and 36 were designed and evaluated by scientists at Genentech.
Figure 2.
(A) Structure of the XIAP BIR3 - AVPI complex and alignment of the nine ligand bound XIAP BIR3 crystal structures. Residues around the binding site (L292-Y324) are shown as line structures. The AVPI peptide is colored in green. Residues of XIAP BIR3 which directly interact with AVPI are labeled. (B) Per residue positional variation of XIAP BIR3 calculated from the alignment of nine structures. Black points correspond to backbone atoms, red points to side chain atoms.
ACKNOWLEDGMENTS
We are grateful for financial support from the National Cancer Institute, National Institutes of Health, USA, (R01CA109025), the Breast Cancer Research Foundation, the Susan G. Komen Foundation, the University of Michigan Cancer Center Core grant (P30CA046592) and the National Center for Integrative Biomedical Informatics grant (U54DA021519).
Abbreviations
- IAP
inhibitor of apoptosis protein
- XIAP
X-linked IAP
- cIAP-1/-2
cellular IAP 1/2
- Smac
second mitochondria-derived activator of caspase
- BIR
baculoviral IAP repeats
- BIR2/BIR3
the second or third BIR domain
- FP
fluorescence polarization
- MD
molecular dynamics
- MM-GBSA
molecular mechanics and generalized Born surface area.
Footnotes
SUPPORTING INFORMATION
Crystal structure information between nine ligands and XIAP BIR3, scores calculated by three scoring functions, binding free energy and ligand reorganization free energy calculated by the MM-GBSA method, radius of gyration of the ligands are provided free of charge via the Internet at http://pubs.acs.org.
REFERENCES
- 1.Kitchen DB, Decornez H, Furr JR, Bajorath J. Nat Rev Drug Discov. 2004;3:935–949. doi: 10.1038/nrd1549. [DOI] [PubMed] [Google Scholar]
- 2.Leach AR, Shoichet BK, Peishoff CE. Journal of Medicinal Chemistry. 2006;49:5851–5855. doi: 10.1021/jm060999m. [DOI] [PubMed] [Google Scholar]
- 3.Warren GL, Andrews CW, Capelli A-M, Clarke B, LaLonde J, Lambert MH, Lindvall M, Nevins N, Semus SF, Senger S, Tedesco G, Wall ID, Woolven JM, Peishoff CE, Head MS. Journal of Medicinal Chemistry. 2006;49:5912–5931. doi: 10.1021/jm050362n. [DOI] [PubMed] [Google Scholar]
- 4.Wang R, Lu Y, Wang S. Journal of Medicinal Chemistry. 2003;46:2287–2303. doi: 10.1021/jm0203783. [DOI] [PubMed] [Google Scholar]
- 5.Yang C-Y, Wang R, Wang S. Journal of Medicinal Chemistry. 2006;49:5903–5911. doi: 10.1021/jm050043w. [DOI] [PubMed] [Google Scholar]
- 6.Gilson MK, Zhou HX. Annu. Rev. Biophys. Biomolec. Struct. 2007;36:21–42. doi: 10.1146/annurev.biophys.36.040306.132550. [DOI] [PubMed] [Google Scholar]
- 7.Wang R, Lai L, Wang S. Journal of Computer-Aided Molecular Design. 2002;16:11–26. doi: 10.1023/a:1016357811882. [DOI] [PubMed] [Google Scholar]
- 8.Gohlke H, Hendlich M, Klebe G. Journal of Molecular Biology. 2000;295:337–356. doi: 10.1006/jmbi.1999.3371. [DOI] [PubMed] [Google Scholar]
- 9.Kollman PA, Massova I, Reyes C, Kuhn B, Huo S, Chong L, Lee M, Lee T, Duan Y, Wang W, Donini O, Cieplak P, Srinivasan J, Case DA, Cheatham TE. Accounts of Chemical Research. 2000;33:889–897. doi: 10.1021/ar000033j. [DOI] [PubMed] [Google Scholar]
- 10.Zobel K, Wang L, Varfolomeev E, Franklin MC, Elliott LO, Wallweber HJA, Okawa DC, Flygare JA, Vucic D, Fairbrother WJ, Deshayes K. ACS Chemical Biology. 2006;1:525–533. doi: 10.1021/cb600276q. [DOI] [PubMed] [Google Scholar]
- 11.Cohen F, Alicke B, Elliott LO, Flygare JA, Goncharov T, Keteltas SF, Franklin MC, Frankovitz S, Stephan J-P, Tsui V, Vucic D, Wong H, Fairbrother WJ. Journal of Medicinal Chemistry. 2009;52:1723–1730. doi: 10.1021/jm801450c. [DOI] [PubMed] [Google Scholar]
- 12.Liu Z, Sun C, Olejniczak ET, Meadows RP, Betz SF, Oost T, Herrmann J, Wu JC, Fesik SW. Nature. 2000;408:1004–1008. doi: 10.1038/35050006. [DOI] [PubMed] [Google Scholar]
- 13.Wu G, Chai J, Suber TL, Wu J-W, Du C, Wang X, Shi Y. Nature. 2000;408:1008–1012. doi: 10.1038/35050012. [DOI] [PubMed] [Google Scholar]
- 14.Berman HM, Westbrook J, Feng Z, Gilliland G, Bhat TN, Weissig H, Shindyalov IN, Bourne PE. Nucl. Acids Res. 2000;28:235–242. doi: 10.1093/nar/28.1.235. [DOI] [PMC free article] [PubMed] [Google Scholar]
- 15.Sybyl, a molecular modeling system, is supplied by Tripos, Inc., St. Louis, MO 63144.
- 16.Jones G, Willett P, Glen RC, Leach AR, Taylor R. Journal of Molecular Biology. 1997;267:727–748. doi: 10.1006/jmbi.1996.0897. [DOI] [PubMed] [Google Scholar]
- 17.Case DA, et al. San Francisco: University of California; 2004. [Google Scholar]
- 18.Wang J, Cieplak P, Kollman Peter A. Journal of Computational Chemistry. 2000;21:1049–1074. [Google Scholar]
- 19.Ryde U. Proteins. 1995;21:40–56. doi: 10.1002/prot.340210106. [DOI] [PubMed] [Google Scholar]
- 20.Frisch MJ, et al. Pittsburgh PA: Gaussian, Inc.; 1998. [Google Scholar]
- 21.Jorgensen WL, Chandrasekha J, Madura JD, Impey RW, Klein ML. J. Chem. Phys. 1983;79 [Google Scholar]
- 22.Ryckaert J-P, Ciccotti G, Berendsen HJC. Journal of Computational Physics. 1977;23:327–341. [Google Scholar]
- 23.Darden TA, York DM, Pedersen L. J. Chem. Phys. 1993;98:10089. [Google Scholar]
- 24.Bashford D, Case DA. Annu. Rev. Phys. Chem. 2000;51:129–152. doi: 10.1146/annurev.physchem.51.1.129. [DOI] [PubMed] [Google Scholar]
- 25.Hiroaki Gouda IDK, Case David A., Kollman Peter A. Biopolymers. 2003;68:16–34. doi: 10.1002/bip.10270. [DOI] [PubMed] [Google Scholar]
- 26.Lee MS, Olson MA. Biophysical Journal. 2006;90:864–877. doi: 10.1529/biophysj.105.071589. [DOI] [PMC free article] [PubMed] [Google Scholar]
- 27.The correlation calculation and the parameters are obtained by using Origin 6.0 from OriginLab.
- 28.Park C-M, Sun C, Olejniczak ET, Wilson AE, Meadows RP, Betz SF, Elmore SW, Fesik SW. Bioorganic & Medicinal Chemistry Letters. 2005;15:771–775. doi: 10.1016/j.bmcl.2004.11.010. [DOI] [PubMed] [Google Scholar]
- 29.Chauhan D, Neri P, Velankar M, Podar K, Hideshima T, Fulciniti M, Tassone P, Raje N, Mitsiades C, Mitsiades N, Richardson P, Zawel L, Tran M, Munshi N, Anderson KC. Blood. 2007;109:1220–1227. doi: 10.1182/blood-2006-04-015149. [DOI] [PMC free article] [PubMed] [Google Scholar]
- 30.Snyder JP, Nevins N, Cicero DO, Jansen J. Journal of the American Chemical Society. 2000;122:724–725. [Google Scholar]
- 31.Lange OF, Lakomek N-A, Fares C, Schroder GF, Walter KFA, Becker S, Meiler J, Grubmuller H, Griesinger C, de Groot BL. Science. 2008;320:1471–1475. doi: 10.1126/science.1157092. [DOI] [PubMed] [Google Scholar]
- 32.Sun H, Nikolovska-Coleska Z, Yang C-Y, Xu L, Liu M, Tomita Y, Pan H, Yoshioka Y, Krajewski K, Roller PP, Wang S. Journal of the American Chemical Society. 2004;126:16686–16687. doi: 10.1021/ja047438+. [DOI] [PubMed] [Google Scholar]
- 33.Sun H, Nikolovska-Coleska Z, Chen J, Yang C-Y, Tomita Y, Pan H, Yoshioka Y, Krajewski K, Roller PP, Wang S. Bioorganic & Medicinal Chemistry Letters. 2005;15:793–797. doi: 10.1016/j.bmcl.2004.11.008. [DOI] [PubMed] [Google Scholar]
- 34.Sun H, Stuckey JA, Nikolovska-Coleska Z, Qin D, Meagher JL, Qiu S, Lu J, Yang C-Y, Saito NG, Wang S. Journal of Medicinal Chemistry. 2008;51:7169–7180. doi: 10.1021/jm8006849. [DOI] [PMC free article] [PubMed] [Google Scholar]
- 35.Sun H, Nikolovska-Coleska Z, Lu J, Meagher JL, Yang C-Y, Qiu S, Tomita Y, Ueda Y, Jiang S, Krajewski K, Roller PP, Stuckey JA, Wang S. Journal of the American Chemical Society. 2007;129:15279–15294. doi: 10.1021/ja074725f. [DOI] [PMC free article] [PubMed] [Google Scholar]
- 36.Peng Y, Sun H, Nikolovska-Coleska Z, Qiu S, Yang C-Y, Lu J, Cai Q, Yi H, Kang S, Yang D, Wang S. Journal of Medicinal Chemistry. 2008;51:8158–8162. doi: 10.1021/jm801254r. [DOI] [PMC free article] [PubMed] [Google Scholar]
- 37.Sun W, Nikolovska-Coleska Z, Qin D, Sun H, Yang C-Y, Bai L, Qiu S, Wang Y, Ma D, Wang S. Journal of Medicinal Chemistry. 2009;52:593–596. doi: 10.1021/jm801101z. [DOI] [PMC free article] [PubMed] [Google Scholar]
- 38.Zhang B, Nikolovska-Coleska Z, Zhang Y, Bai L, Qiu S, Yang C-Y, Sun H, Wang S, Wu Y. Journal of Medicinal Chemistry. 2008;51:7352–7355. doi: 10.1021/jm801146d. [DOI] [PMC free article] [PubMed] [Google Scholar]
Associated Data
This section collects any data citations, data availability statements, or supplementary materials included in this article.


