

Abstract
Hepatitis B virus (HBV) infection is a global public health problem that plays a crucial role in the pathogenesis of chronic hepatitis, cirrhosis, and hepatocellular carcinoma. However, the pathogenesis of HBV infection and the mechanisms of host-virus interactions are still elusive. In this study, two-dimensional gel electrophoresis and mass spectrometry-based comparative proteomics were applied to analyze the host response to HBV using an inducible HBV-producing cell line, HepAD38. Twenty-three proteins were identified as differentially expressed with glucose-regulated protein 78 (GRP78) as one of the most significantly up-regulated proteins induced by HBV replication. This induction was further confirmed in both HepAD38 and HepG2 cells transfected with HBV-producing plasmids by real time RT-PCR and Western blotting as well as in HBV-infected human liver biopsies by immunohistochemistry. Knockdown of GRP78 expression by RNA interference resulted in a significant increase of both intracellular and extracellular HBV virions in the transient HBV-producing HepG2 cells concomitant with enhanced levels of hepatitis B surface antigen and e antigen in the culture medium. Conversely overexpression of GRP78 in HepG2 cells led to HBV suppression concomitant with induction of the positive regulatory circuit of GRP78 and interferon-β1 (IFN-β1). In this connection, the IFN-β1-mediated 2′,5′-oligoadenylate synthetase and RNase L signaling pathway was noted to be activated in GRP78-overexpressing HepG2 cells. Moreover GRP78 was significantly down-regulated in the livers of chronic hepatitis B patients after effective anti-HBV treatment (p = 0.019) as compared with their counterpart pretreatment liver biopsies. In conclusion, the present study demonstrates for the first time that GRP78 functions as an endogenous anti-HBV factor via the IFN-β1-2′,5′-oligoadenylate synthetase-RNase L pathway in hepatocytes. Induction of hepatic GRP78 may provide a novel therapeutic approach in treating HBV infection.
Hepatitis B virus infection is a global public health problem. An estimated 2 billion (one-third of the world's population) people are infected with HBV1 worldwide, and more than 400 million are chronic hepatitis B (CHB) carriers (1). Epidemiological studies have shown that HBV infection is one of the major risk factors for chronic hepatitis, liver fibrosis, and hepatocellular carcinoma (HCC). Every year, over 1 million people die of HBV-related liver diseases, 30–50% of which are attributed to HCC (2). In China, more than 130 million (10% of the national population) people are suffering from CHB (3), and HCC has been ranked as the second major cause of cancer-related death since 1990 (4). However, the limited efficacy of antiviral therapies, high rates of post-treatment HBV relapse, and the emergence of drug-resistant viral mutants have greatly hindered the effective management of CHB infection. Therefore, it is of prime importance to understand the mechanisms of HBV-host interactions during malignant transformation in CHB infection to identify novel therapeutic anti-HBV targets.
Because human HBV is incapable of infecting hepatocytes in vitro efficiently and the availability of reliable in vitro culture systems that favor HBV replication is limited, the pathogenetic studies of HBV and the development of anti-HBV drugs have long been hampered. HepAD38 and HepG2.2.15, both of which are derived from HepG2 cells and integrated with a greater than 1-unit-length HBV genome, have been widely accepted and are well established cell lines for the study of the HBV life cycle and screening potential HBV inhibitors since the late 1990s (5, 6). Recently comparative proteomics analysis of the HBV-expressing HepG2.2.15 cells and the parental HepG2 cells has been performed in two independent laboratories to characterize the altered proteome profile induced by HBV (7, 8). However, the different genetic backgrounds of HepG2.2.15 and HepG2 may lead to an inaccurate evaluation of the impact of HBV replication on host genes. When compared with HepG2.2.15 cells, which produce HBV particles in a continuous manner, HepAD38 cells produce higher levels of HBV DNA in a controllable and inducible way (5). HBV production in HepAD38 is under the strict control of a tetracycline-responsive promoter; therefore, a direct comparison of cellular characteristics with or without HBV replication in HepAD38 is easily achieved. To date, changes in the proteome profile of HepAD38 induced by HBV replication have not been reported.
In this study, we performed comparative proteomics to globally analyze the host response to HBV by using an inducible HBV-producing cell line, HepAD38. The combination of two-dimensional gel electrophoresis (2-DE) and MALDI-TOF MS revealed that 23 cellular proteins were differentially expressed when HBV replicated. Among them, GRP78, which was one of the most highly up-regulated proteins, was further selected for functional assessment.
EXPERIMENTAL PROCEDURES
Plasmid Constructs and siRNA Synthesis
The pHBV (1.1-fold HBV genome, genotype C) was used to produce HBV virion as described previously (9). The Renilla luciferase expression plasmid pSV40-RL (Promega) was used as the internal control to normalize the transfection efficiency. The full-length complementary DNA encoding human GRP78 was obtained by reverse transcription-PCR amplification of HepG2 RNA using a set of specific primers (forward, 5′-CGCGATATCGCCACCATGAAGCTCTCCCTGGTG-3′; reverse, 5′-ATAAGAATGCGGCCGCCTACAACTCATCTTTTTCTGC-3′; EcoRV and NotI sites, respectively, are underlined). The amplified PCR products were predigested with EcoRV and NotI restriction enzymes and then subcloned into the same sites of pAAV/EF1α vector to obtain a GRP78 expression plasmid, pAAV-GRP78. pAAV-EGFP was generated by replacing the expression cassette of GRP78 with the sequence encoding EGFP and used as the negative control. All constructs were verified by automated DNA sequencing.
According to the “Dharmacon siDesign Center,” two small interfering RNA (siRNA) oligonucleotide duplexes targeting human GRP78 messenger RNA ( mRNA, GenBank™ accession number NM_005347) were designed (siGRP78-1: sense, 5′-AAUUUCUGCCAUGGUUCUCACUAAAAU-3′; siGRP78-2: sense, 5′-AACUUCUACAGCUUCUGAUAAUGAGUC-3′) and then synthesized by Sigma-Proligo. The knockdown effects of both siRNAs were measured by real time RT-PCR and Western blot assays. Finally the siGRP78-1, which induced specific and potent GRP78 silencing in HepG2 cells, was chosen for the study. A nonspecific siRNA targeting the replicase 1A region of the severe acute respiratory syndrome (SARS) coronavirus genome (siSARS: sense, 5′GCACUUGUCUACCUUGAUGdTdT-3′) (10, 11), which had no homology to HBV or the human genome, was used as the negative control in this part of the study.
Cell Culture and Transfection
The human hepatoma cell lines HepAD38 and HepG2 were maintained in Invitrogen Dulbecco's modified Eagle's medium supplemented with 10% fetal bovine serum, 1% penicillin/streptomycin, and 1% glutamine at a humidified condition of 5% CO2 at 37 °C. For HepAD38 cells, the medium was further supplied with 400 μg/ml G418 and 2 μg/ml tetracycline. To begin an assay, confluent HepAD38 cells were washed with prewarmed PBS sufficiently and then fed with medium without tetracycline in which the replication of wild-type HBV was induced. Forty-eight hours later, both tetracycline-treated and non-tetracycline-treated HepAD38 cells were submitted to 2-DE analysis. To rule out the effects of tetracycline instead of HBV replication on the host proteome profile, comparative proteomics analysis of tetracycline-treated and non-tetracycline-treated HepG2 cells was performed in parallel.
All transfections were carried out in 12-well plates using Lipofectamine™ 2000 (Invitrogen) according to the manufacturer's instructions unless otherwise indicated. Transfections were done in triplicates and repeated at least three times. For knockdown of GRP78, HepG2 cells were transfected with either siGRP78-1 or siSARS when cells reached about 70% confluence. A final concentration of 50 nmol/liter was used for both siRNAs. Mock transfection was carried out concurrently with Lipofectamine alone. For overexpression of GRP78, HepG2 cells were transfected with 1.6 μg of pAAV/EF1α (empty vector), pAAV-EGFP, or pAAV-GRP78/well. Cells were lysed for Western blot analysis 48 h after transfection.
HepAD38 cells were transfected with 200 nmol/liter siGRP78-1 or siSARS after tetracycline withdrawal. HepG2 cells were cotransfected with pHBV and pSV40-RL together with siGRP78-1/siSARS or pAAV-GRP78/pAAV/EF1α. The final concentration of siRNAs was 50 nmol/liter, and the ratio of transfected plasmids was pAAV-GRP78 or pAAV/EF1α:pHBV:pSV40-RL = 5:1:0.1. Two days after transfection, supernatants were collected for core-associated HBV DNA extraction and quantification as well as hepatitis B surface antigen (HBsAg) and hepatitis B e antigen (HBeAg) detection. Cells were processed for HBV DNA quantification and luciferase activity measurement. Luciferase activities in cell lysates were determined by using a luciferase assay system (Promega).
To detect the expression level of GRP78, 2 × 10⁶ HepG2 cells were transfected with 5 μg of pHBV or empty vector by nucleofection using Cell Line Nucleofector™ kit V and an Amaxa Nucleofector II device (program T-28, Amaxa Biosystems). For detecting the expression levels of IFNs and IFN-inducible genes triggered by GRP78 overexpression, HepG2 cells were nucleofected with pAAV-EGFP or pAAV-GRP78 as described above. After nucleofection, cells were transferred to 6-well plates and left for incubation for 48 h before real time RT-PCR and Western blot analysis.
To investigate the regulation of IFNs on GRP78 expression, HepG2 cells were treated with various concentrations of IFN-αA (1000 units/ml) or IFN-β1a (0, 1, 10, 100, and 1000 units/ml; Sigma) for the indicated intervals. After the indicated incubation periods, cells were harvested and lysed for real time RT-PCR and Western blotting.
Clinical Specimens
Paired pre- and postlamivudine treatment paraffin-embedded liver biopsies were collected from 19 patients (mean age ± S.D.), 35.3 ± 10.3 years; range, 21–57 years; male:female, 14:5) who were diagnosed with chronic hepatitis B at the Hepatitis Clinic of the Prince of Wales Hospital, Hong Kong, China between June 2000 and January 2003. All patients had been positive for HBsAg for at least 6 months, were HBeAg-positive, had a serum HBV DNA level of at least 500,000 copies/ml with an alanine aminotransferase level that was 1.3–5 times the upper limit of normal, and were treatment-naïve before receiving the 52-week lamivudine monotherapy. Patients who met one of the following criteria were excluded from the study: history of decompensated liver disease or interferon or antiviral agent use; co-infection with hepatitis C virus, hepatitis D virus, or human immunodeficiency virus; history of HCC; other causes of liver disease (12); serious medical or psychiatric illness; concurrent use of corticosteroid or immunosuppressive agents; and pregnancy. Liver biopsy was performed within 4 weeks before treatment began and at the end of treatment. Sera were collected immediately before and after lamivudine treatment for HBV DNA quantification. The study was approved by the ethics committee of the Chinese University of Hong Kong, and written informed consent was obtained from each patient.
Two-dimensional Gel Electrophoresis and Image Analysis
The HepAD38 cells and the parental HepG2 cells were harvested 48 h post-treatment (with and without tetracycline). HepG2 cells were used to exclude the cell responses to tetracycline. Cells were washed with PBS, lysed in lysis buffer (8 m urea, 2 m thiourea, 2% CHAPS, 1% Nonidet P-40, 2 mm tributylphosphine, 1× Roche Applied Science protease inhibitor mixture, 1× nuclease mixture, 1 mm PMSF, 2% IPG buffer), and then left on ice for 45 min. After centrifugation at 14,000 × g for 15 min at 4 °C, the supernatant was collected and stored at −80 °C until use. Protein concentrations were determined by the Bradford method (Bio-Rad).
Isoelectric focusing was performed using 13-cm precast IPG strips (pH 4–7, linear; GE Healthcare) in an Ettan IPGphor II IEF System (Amersham Biosciences) according to the manufacturer's instructions. The IPG strips were rehydrated for 10 h at 30 V with 250 μl of rehydration buffer (8 m urea, 2% CHAPS, 0.4% DTT, 0.5% IPG buffer, 0.002% bromphenol blue) containing 150 μg of protein samples. The rehydrated strips were then focused by using a stepwise voltage increment program: 500 and 1000 V for 1 h each and 8000 V afterward until 64 kV-h. After IEF, the isoelectrically focused strips were incubated in an equilibration buffer (6 m urea, 1% DTT, 2% SDS, 30% glycerol, 0.002% bromphenol blue, 50 mm Tris-HCl, pH 6.8) for 15 min with gentle agitation followed by an incubation in the same buffer containing 2.5% iodoacetamide in place of DTT for another 15 min. The equilibrated strips were loaded onto 12.5% SDS-polyacrylamide gels. The gels were run at 15 mA/gel for 30 min and then 30 mA/gel until the dye fronts reached the bottoms of the gels.
The gels were stained by the modified silver staining method compatible with MS analysis. The staining procedure was carried out as described previously (13). Gel images were acquired with a calibrated GS-800 scanner and Quantity One software (Bio-Rad). Further data processing was completed by using PDQuest™ 2-D analysis software (version 8.0; Bio-Rad) for spot detection, spot matching, volume normalization, and quantitative intensity analysis. The parameters for spot detection were set as follows: ruby speckles, 50; smoothing, medium 7 × 7; background removal, floating ball, 61; removal of vertical streaks, 93; removal of horizontal streaks, 93; sensitivity, 16.51; size scale, 5; and minimum peak, 868. After manual editing, spots on different gels were matched, compared, and analyzed. All paired samples were run thrice independently to guarantee reproducibility. A 2-fold increase/decrease (non-tetracycline-treated HepAD38 versus tetracycline-treated HepAD38) in spot intensities was set as the threshold for indicating significant changes.
In-gel Tryptic Digestion
Spots showing significant changes in intensities were manually cut from the gels. Gel pieces were destained and washed before in-gel digestion as described previously (13). Gels were then dried completely by vacuum and digested with 10 μg/ml trypsin (Promega) in 25 mm ammonium bicarbonate, pH 8.0 for 16–18 h at 37 °C. Thereafter the supernatants containing tryptic peptides were collected.
MALDI-TOF/TOF MS and MS/MS Spectrometry Analysis
For acquisition of mass spectra, 0.5 μl of peptide solution was mixed with 0.5 μl of matrix (4 mg/ml α-cyano-4-hydroxylcinnamic acid in 35% ACN and 1% TFA) before spotting onto the MALDI plate. Mass spectrometric analyses were performed on a MALDI-TOF/TOF tandem mass spectrometer ABI 4700 proteomics analyzer (Applied Biosystems). The instrument was equipped with a 337 nm nitrogen laser and was operated in batched processing and automatic MS to MS/MS switching modes. All mass spectra were accumulated from 2000 laser shots with an accelerating voltage of 20 kV and acquired over a mass range of 800–3500 m/z in a positive ion reflectron mode by using the 4000 Series Explorer™ V3.0 software package. An internal calibration in MS mode was achieved with the ions of porcine trypsin autolysis peptides at m/z 842.509, m/z 1045.564, m/z 1940.935, and m/z 2211.104, resulting in mass errors of less than 30 ppm. The MS spectrum exclusion lists are shown in the supplemental Fig. S1. The MS peaks (MH+) were detected on a minimum S/N ratio ≥20 and cluster area S/N threshold ≥25 without smoothing and raw spectrum filtering. Peptide precursor ions corresponding to contaminants, including human keratin and trypsin autolysis peptides, were excluded in a mass tolerance of ±0.2 Da. The precursor ions with a minimum signal to noise ratio of 50 were selected for MS/MS scanning. Fragmentation of precursor ions was performed in a CID cell using argon as collision gas with 1-kV energy in the positive ion mode. MS/MS spectra were obtained by collecting 3000 laser shots with a default calibration. The MS/MS peaks were detected on a minimum S/N ratio ≥3 and cluster area S/N threshold ≥15 with smoothing.
Database Search
Combined MS (peptide mass fingerprint approach) and MS/MS (de novo sequencing approach) analysis was applied for protein identification. The MS and MS/MS spectra were submitted to the Mascot search engine (version 1.9.05; Matrix Science) and searched against the NCBInr database (5,825,255 protein sequences; released on January 10, 2008) using GPS Explorer™ software (version 3.5; Applied Biosystems). The search parameters were defined as follows: taxonomy of Homo sapiens, trypsin digest with a maximum of one missed cleavage, fixed modification of cysteine carbamidomethylation, variable modification of methionine oxidation, monoisotopic peptide mass (MH+), mass range of 800–3500 Da, pI of 0–14, precursor tolerance of 50 ppm, and MS/MS fragment tolerance of 0.1 Da. Known contaminant ions corresponding to human keratin and trypsin autolysis peptides were removed from the spectra before database searching. The top five hits for each protein search were reported. Only proteins with Mascot protein scores (based on both MS and MS/MS spectra) over 67 (p < 0.05), sequence coverage over 13%, and a minimum of two matched peptides were considered to be positively identified. If a protein spot matched multiple members of a protein family, the protein candidate with the maximum number of matched peptides and a pI value nearest to the observed value was chosen to report. Each isoform of a protein family identified in our study was considered to be a distinct protein for analysis.
Quantitative PCR
Total RNA was isolated using TRIzol reagent (Invitrogen) according to the manufacturer's instructions. 1 μg of total RNA was subjected to reverse transcription using the ImProm-II™ Reverse Transcription System (Promega). The quantitative real time PCR was carried out in the ABI 7500 Real-Time PCR System with Power SYBR Green Master Mix (Applied Biosystems) using the following program: 50 °C for 2 min and 95 °C for 10 min followed by 45 cycles of 95 °C for 15 s and 60 °C for 1 min. Fluorescence signals were collected during the extension phase of each PCR cycle. Primers used for GRP78, IFN-α1, IFN-β1, IFN-stimulated protein of 15 kDa (ISG15), myxovirus resistance 1 (Mx1), OAS1, OAS2, OAS3, OAS-like (OASL), RNase L, protein kinase R (PKR), and glyceraldehyde-3-phosphate dehydrogenase (GAPDH; internal control) are listed in Table I . Standard curves for quantification were obtained by serial dilutions of the PCR products containing corresponding gene fragments. All samples were run in triplicate, and the experiment was repeated thrice. The mRNA level of each target gene was normalized to the mRNA copies of GAPDH in the same sample, and results were expressed as a percentage of the negative control (set as 100%).
Table I . Primers used in the quantitative real time PCR F, forward; R, reverse.
| Gene | GenBank accession no. | Sequences of primers |
|---|---|---|
| GRP78 | NM_005347 | F 5′-GACGGGCAAAGATGTCAGGAA-3′ |
| R 5′-TCATAGTAGACCGGAACAGATCCA-3′ | ||
| IFN-α1 | NM_024013 | F 5′-GCCTCGCCCTTTGCTTTACT-3′ |
| R 5′-GGATCAGCTCATGGAGGACAGA-3′ | ||
| IFN-β1 | NM_002176 | F 5′-GACCAACAAGTGTCTCCTCCAAA-3′ |
| R 5′-GAACTGCTGCAGCTGCTTAATC-3′ | ||
| ISG15 | NM_005101 | F 5′-ATGGGCTGGGACCTGACG-3′ |
| R 5′-GCCAATCTTCTGGGTGATCTG-3′ | ||
| Mx1 | NM_002462 | F 5′-GCTTGCTTTCACAGATGTTTCG-3′ |
| R 5′-AAGGGATGTGGCTGGAGATG-3′ | ||
| OAS1 | NM_016816 | F 5′-TCCACCTGCTTCACAGAACTACA-3′ |
| R 5′-TGGGCTGTGTTGAAATGTGTTT-3′ | ||
| OAS2 | NM_016817 | F 5′-TACCTGAAGCCCTACGAAGAATG-3′ |
| R 5′-TCAGCTTATCCCCAGTTTTATCG-3′ | ||
| OAS3 | NM_006187 | F 5′-CCCTGGTCTGAGACTCACGTTT-3′ |
| R 5′-GACTTGTGGCTTGGGTTTGAC-3′ | ||
| OASL | NM_003733 | F 5′-CGTGAAACATCGGCCAACTAAG-3′ |
| R 5′-GTACCCATTTCCCAGGCATAGA-3′ | ||
| RNase L | NM_021133 | F 5′-TCATTCATCGTCTCTTCCATCCT-3′ |
| R 5′-ACATTCCGAAGCGTCCTATAGC-3′ | ||
| PKR | NM_002759 | F 5′-AATGATGGAAAGCGAACAAGGAGTA-3′ |
| R 5′-CTTCCACACAGTCAAGGTCCTTAGT-3′ | ||
| GAPDH | NM_002046 | F 5′-GATTCCACCCATGGCAAATTCCA-3′ |
| R 5′-TGGTGATGGGATTTCCATTGATGA-3′ |
Western Blotting
Cells were washed with PBS and lysed on ice for 30 min in RIPA buffer (50 mm Tris·HCl, pH 7.5, 150 mm NaCl, 1 mm EDTA, 1% Triton X-100, 0.1% SDS, 1× Roche Applied Science protease inhibitor mixture, 1× Roche Applied Science PhosSTOP™ phosphatase inhibitor mixture) with occasional vortexing. Lysates were then collected by centrifugation at 14,000 rpm for 10 min at 4 °C, and protein concentrations were determined by the Bradford method (Bio-Rad). Total proteins (20 μg/sample) were separated by 12% SDS-PAGE and transferred onto polyvinylidene difluoride membranes (Amersham Biosciences). Membranes were blocked by 5% skim milk in TBST (20 mm Tris·HCl, pH 7.4, 150 mm NaCl, 0.1% Tween 20) followed by an incubation with specific antibodies (Santa Cruz Biotechnology) against GRP78 (1:500 dilution) or GAPDH (1:10,000 dilution). Target proteins were finally visualized with horseradish peroxidase-conjugated secondary antibodies (1:3000 dilution; Santa Cruz Biotechnology) using a chemiluminescence detection system (Amersham Biosciences). Each immunoblot was done thrice to confirm the results.
Immunohistochemistry
Paraffin sections from 19 paired liver biopsy specimens were used in this study. After deparaffinization and rehydration, tissue sections (4 μm thick) were microwaved in citrate buffer, pH 6.0 for 5 min in a pressure cooker for antigen retrieval. Hydrogen peroxide (3%) was then applied to the sections to quench endogenous peroxidase activity. After blocking nonspecific binding with 10% non-immune goat serum, sections were incubated with primary antibodies against GRP78 (1:200 dilution in 1% BSA; Cell Signaling Technology) for 2 h at room temperature. A negative control was done by replacing the primary antibody with 1% BSA in PBS. After extensive rinsing, sections were successively treated with biotinylated secondary antibodies and horseradish peroxidase-streptavidin conjugate (Histostain-Plus kits, Zymed Laboratories Inc.). GRP78 signals were visualized by diaminobenzidine, and the sections were counterstained with hematoxylin. The immunoreactivity of GRP78 was evaluated by two independent investigators who were blinded to all clinical data and was scored by staining intensity and immunoreactive cell percentage (1, weak staining; 2, moderate staining in ≤30% of cells; 3, moderate staining in 30–80% of cells; 4, intense staining in ≥80% of cells). In cases of disagreement, slides were re-evaluated until consensus was achieved.
Core-associated HBV DNA Purification and Quantitative Analysis
Core-associated HBV DNA was extracted as described previously with minor modifications (9). For extracellular virions, culture medium was collected 48 h post-transfection and briefly centrifuged to remove cell debris. Viral core particles were precipitated with 10% polyethylene glycol 8000 in 0.5 m NaCl at 4 °C overnight. After centrifugation at 16,000 × g for 30 min, viral cores were pelleted and subsequently treated with DNase I (100 μg/ml) in 50 mm Tris·HCl, pH 8.0, 10 mm MgCl2 at 37 °C for 3 h. The mixture was further digested with 400 μg/ml proteinase K in 15 mm EDTA, 100 mm NaCl, 0.5% SDS at 55 °C for 2 h followed by phenol/chloroform extraction. HBV DNA released from lysed cores was dissolved in TE buffer (10 mm Tris·HCl, pH 8.0, 1 mm EDTA). For intracellular virions, cells were lysed in 100 μl/well lysis buffer (1% Triton X-100 and 1× Roche Applied Science protease inhibitor mixture in PBS) 48 h post-transfection. 20 μl of the cell lysates was assayed for luciferase activity, and the remaining cell lysates were used for the purification of core-associated HBV DNA, which was processed as mentioned earlier.
The core-associated HBV DNA was quantitated by real time PCR using Power SYBR Green Master Mix with forward primer 5′-AGTGTGGATTCGCACTCCT-3′ and reverse primer 5′-GAGTTCTTCTTCTAGGGGACCTG-3′. Cycling parameters described above were performed with the ABI 7500 Real-Time PCR System. Serial dilutions of pHBV were used to generate the standard curve. All samples were analyzed in triplicate. The copy numbers of HBV DNA were normalized against the luciferase activities in the corresponding wells. Results were presented as a percentage of the negative control and confirmed by five independent experiments.
ELISA for Determining the Levels of HBsAg and HBeAg
The levels of HBsAg and HBeAg in the culture medium were measured by ELISA using the Murex HBsAg Version 3 kit and Murex HBeAg/anti-HBe kit (Abbott Murex) according to the manufacturer's instructions. Absorbance was measured at 450/690 nm using an Expert Plus microplate reader (ASYS Hitech), and the data were normalized to luciferase activity. All samples were examined in triplicate, and results were expressed as -fold changes relative to the negative controls.
Statistical Analysis
Data are expressed as mean ± S.D. All statistical analyses were carried out with SPSS 14.0 software (SPSS Inc.). Two-tailed Student's t test was applied for two-group comparison. A p value less than 0.05 was considered as statistically significant.
RESULTS
2-DE Profiling of Tetracycline-treated and Non-tetracycline-treated HepAD38 Cells
To study the effects of HBV replication on the proteome profile of the host cell, proteins from tetracycline-treated (HBV suppression, Tet+) and non-tetracycline-treated (HBV induction, Tet−) HepAD38 were extracted and resolved by 2-DE 48 h post-treatment. Fig. 1 shows a representative pair of silver-stained 2-DE maps between two samples (Fig. 1, A and B). After comparing the images from HepG2 and HepAD38 cells treated with or without tetracycline, 40 protein spots were found to be differentially expressed (over ±2-fold, p < 0.05) in three pairs of gels. Cropped and enlarged images of five paired spots are presented in Fig. 1C.
Fig. 1.

Protein profile differences between tetracycline-treated and non-tetracycline-treated HepAD38 cells. A and B, representative silver-stained 2-DE maps of proteins from tetracycline-treated (HBV suppression, Tet+; A) and non-tetracycline-treated (HBV induction, Tet−; B) HepAD38 cells (n = 3). Twenty-three differentially expressed spots that were identified by MALDI-TOF-MS and MS/MS scanning are marked with numbers. C, enlarged sections of the 2-DE maps showing different expressions of spot 1 (PCNA), spot 17 (LMNB1), spot 26 (GRP78), spot 34 (cathepsin D preproprotein (CTSD)), and spot 36 (PDIA3) between tetracycline-treated (Tet+) and non-tetracycline-treated (Tet−) HepAD38 cells.
Identification and Classification of Differentially Expressed Proteins
Among the 40 selected spots, a total of 23 proteins were successfully identified by MALDI-TOF MS and MS/MS analysis. Sixteen proteins (70%) were markedly up-regulated whereas seven (30%) were down-regulated in HBV-replicating (Tet−) HepAD38 cells. The characteristics of all identified proteins, including protein name, NCBI accession number, theoretical molecular mass/pI, peptide count, protein score (confidence interval in percent), number of unmatched masses, sequence coverage, -fold change, and functions, are listed in Table II, and the MS spectrum and peak lists for each protein are listed in supplemental Figs. S2–S24. In general, the 23 proteins can be functionally categorized into six categories: antioxidant enzymes (13%), metabolism (26%), cytoskeleton and transport proteins (17%), gene transcription-associated proteins (9%), heat shock proteins and chaperones (26%), and cell proliferation, metastasis, and signaling-associated proteins (9%).
Table II . Differentially expressed proteins identified by 2-DE and MS analysis between tetracycline-treated (HBV suppression) and non-tetracycline-treated (HBV induction) HepAD38 cells.
At a 2-fold difference cutoff in intensity, 40 spots were selected for further MALDI-TOF-MS/MS-MS analysis, and 23 proteins were finally identified. CI, confidence interval.
| Spot no.a | Protein name | Abbreviation | NCBI accession no. | Theoretical molecular mass (Da)/pI | Peptide count | Protein score (CI) | Unmatched masses no. | Sequence coverage | -Fold changeb |
|---|---|---|---|---|---|---|---|---|---|
| % | |||||||||
| Antioxidant enzymes | |||||||||
| 19 | Superoxide dismutase 1 | SOD1 | gi|4507149 | 15,925.9/5.70 | 3 | 115 (100%) | 15 | 30 | 2.0 |
| 31 | Peroxiredoxin 2 isoform a | PRDX2 | gi|32189392 | 21,878.2/5.66 | 9 | 235 (100%) | 49 | 40 | 2.6 |
| 37 | Peroxiredoxin 3 | PRDX3 | gi|14250063 | 27,705.2/7.11 | 6 | 190 (100%) | 35 | 24 | 3.9 |
| Metabolism | |||||||||
| 10 | Pyruvate dehydrogenase E1, β subunit precursor | PDHB | gi|387010 | 36,464.4/5.38 | 12 | 393 (100%) | 40 | 46 | 2.4 |
| 12 | Enolase 1 | ENO1 | gi|4503571 | 47,139.3/7.01 | 8 | 106 (100%) | 20 | 25 | −2.1 |
| 20 | Aldehyde dehydrogenase | ALDH | gi|178390 | 56,344.6/7.00 | 20 | 383 (100%) | 37 | 45 | 2.4 |
| 24 | ATP synthase, δ subunit precursor | ATP5D | gi|4502297 | 17,479.2/5.38 | 2 | 84 (99.96%) | 32 | 13 | 2.2 |
| 25 | ATP synthase, β subunit precursor | ATP5B | gi|32189394 | 56,524.6/5.26 | 18 | 609 (100%) | 40 | 49 | 4.6 |
| 34 | Cathepsin D preproprotein | CTSD | gi|4503143 | 44,523.6/6.10 | 11 | 294 (100%) | 30 | 32 | 2.1 |
| Cytoskeleton and transport proteins | |||||||||
| 4 | Tubulin α6 | TUBA6 | gi|14389309 | 49,863.5/4.96 | 5 | 85 (99.97%) | 17 | 13 | −2.1 |
| 17 | Lamin B1 | LMNB1 | gi|5031877 | 66,367.6/5.11 | 22 | 378 (100%) | 19 | 37 | −2.6 |
| 30 | Actin, β | ACTB | gi|14250401 | 40,978.4/5.56 | 13 | 486 (100%) | 50 | 49 | 3.0 |
| 38 | Fatty acid-binding protein | FABP | gi|182356 | 14,169.4/6.60 | 4 | 151 (100%) | 35 | 44 | 3.6 |
| Gene transcription | |||||||||
| 1 | Proliferating cell nuclear antigen | PCNA | gi|4505641 | 28,750.3/4.57 | 9 | 99 (100%) | 36 | 37 | 2.0 |
| 28 | Heterogeneous nuclear ribonucleoprotein K isoform a | HNRPK | gi|14165437 | 50,996.4/5.19 | 14 | 307 (100%) | 35 | 32 | 2.0 |
| Heat shock proteins and chaperones | |||||||||
| 6 | Calreticulin precursor | CALR | gi|4757900 | 48,111.8/4.29 | 15 | 369 (100%) | 35 | 47 | −2.2 |
| 18 | Chaperonin | CPN60 | gi|31542947 | 61,016.4/5.70 | 19 | 428 (100%) | 25 | 43 | 2.1 |
| 26 | Glucose-regulated protein, 78 kDa | GRP78 | gi|16507237 | 72,288.4/5.07 | 28 | 791 (100%) | 32 | 50 | 5.0 |
| 33 | Chaperonin containing TCP1, subunit 5 (ϵ) | CCT5 | gi|24307939 | 59,632.8/5.45 | 11 | 125 (100%) | 25 | 19 | 3.4 |
| 36 | Protein-disulfide isomerase-associated 3 precursor | PDIA3 | gi|21361657 | 56,746.8/5.98 | 23 | 394 (100%) | 36 | 51 | 6.6 |
| 39 | Chaperonin containing TCP1, subunit 6A isoform a | CCT6A | gi|4502643 | 57,987.6/6.23 | 7 | 67 (98.30%) | 23 | 14 | −3.3 |
| Cell proliferation, metastasis, and signal transduction | |||||||||
| 5 | Laminin-binding protein | LAMBR | gi|34234 | 31,773.9/4.84 | 8 | 182 (100%) | 15 | 36 | −2.2 |
| 32 | Prohibitin | PHB | gi|4505773 | 29,785.9/5.57 | 9 | 374 (100%) | 22 | 35 | −2.8 |
a Spot numbers are shown in Fig. 1.
b The spot intensities were quantified using PDQuest software (Bio-Rad). The average -fold change of spot intensity for each protein was calculated from three independent experiments (non-tetracycline-treated HepAD38 versus tetracycline-treated HepAD38). −, decrease.
In the present study, GRP78 (also known as heat shock 70-kDa protein 5) was one of the most striking proteins elevated by HBV replication in HepAD38 cells. It was up-regulated by 5-fold in the non-tetracycline-treated HepAD38 cells when compared with the tetracycline-treated counterparts. Fig. 2 illustrates the MS and MS/MS spectrums of GRP78. As shown in Table II, the protein score of 791 in the Mascot search indicated a highly significant match of GRP78 protein sequences (p < 0.05).
Fig. 2.

Identification of GRP78 (spot 26) by MALDI-TOF MS and MS/MS analysis. A, MALDI-TOF MS spectrum of GRP78 labeled with masses detected and peptide assignments. The precursor ion 1934.04 m/z, highlighted by an open circle, was submitted for MS/MS scanning. Mox, oxidized methionine. B, MS/MS spectra of the precursor ion 1934.04 m/z for peptide DNHLLGTFDLTGIPPAPR of GRP78. b ions and y ions with corresponding peak values are marked.
Validation of Differentially Expressed GRP78 by Real Time RT-PCR and Western Blotting
To confirm the overexpression of GRP78 induced by HBV replication, Western blotting was carried out to detect the expression level of GRP78 in HepAD38 cells at day 1, 2, 3, and 4 post-tetracycline treatment. As shown in Fig. 3A, a time-dependent decrease in GRP78 expression was observed when tetracycline, which suppressed HBV replication, was added into the medium. In addition both quantitative real time PCR and immunoblot data (Fig. 3B) showed a convincing elevation of GRP78 in HepG2 cells that were transiently transfected with pHBV as compared with the control.
Fig. 3.

Confirmation of GRP78 overexpression in HBV-replicating HepAD38 and pHBV-transfected HepG2 cells. A, a time-dependent decrease of GRP78 expression was revealed by Western blot in HepAD38 cells when HBV replication was suppressed by tetracycline. Tet+, tetracycline treatment. B, elevated mRNA and protein (inset) expression of GRP78 was confirmed by quantitative PCR and Western blotting, respectively, in HepG2 cells 48 h postnucleofection. GAPDH was used as the internal control. Data are expressed as mean ± S.D. Error bars represent S. D. (n = 3; *, p < 0.01).
Suppression of GRP78 Increases HBV Replication and Antigen Expression
As shown in Fig. 4A1, the cytoplasmic and supernatant HBV titers (HBV DNA copy number/luciferase activity) caused by GRP78 silencing were nearly 4-fold and more than 6-fold higher than the corresponding untreated controls, respectively. Concomitantly the levels of both HBsAg and HBeAg in culture medium were significantly increased (Fig. 4A2). The silencing effect of siGRP78-1 was clearly demonstrated by Western blotting in Fig. 4A3.
Fig. 4.

The functional significance of GRP78 in HBV replication. The HBV titers (HBV/luciferase) of both cytoplasm and supernatant (A1) and the levels (absorbance/luciferase) of both secreted HBsAg and HBeAg (A2) were significantly increased when GRP78 was knocked down. A3, down-regulation of GRP78 by siGRP78-1 was confirmed by Western blotting in HepG2 cells 48 h post-transfection (n = 3). In contrast the HBV titers (HBV/luciferase) of both cytoplasm and supernatant (B1) and the levels (absorbance/luciferase) of both the secreted HBsAg and HBeAg (B2) were markedly decreased during the overexpression of GRP78. B3, up-regulation of GRP78 was validated by Western blotting in pGRP78-transfected HepG2 cells 48 h post-transfection (n = 3). Data are expressed as mean ± S.D. (n = 5; *, p < 0.05; **, p < 0.01).
Overexpression of GRP78 Suppresses HBV Replication and Antigen Expression
Herein the empty vector pAAV/EF1α was used instead of the EGFP expression plasmid as the negative control for the fluorescence emitted by EGFP perturbing the measurement of Renilla luciferase luminescence. Fig. 4B1 shows a marked decrease of cytoplasmic and supernatant HBV titers upon GRP78 overexpression. The levels of both HBsAg and HBeAg in the culture medium were also significantly decreased (Fig. 4B2). Fig. 4B3 illustrates the overexpression of GRP78 clearly after 48 h of transfection in the HepG2 cells.
Kinetics of Intracellular HBV Virions and GRP78 Transcript Levels
To further confirm the intracellular anti-HBV activity of GRP78, we investigated the intracellular HBV kinetics in HepAD38 cells with and without the silencing of GRP78 expression. As shown in Fig. 5A, HBV replication was delayed for 24 h after tetracycline withdrawal. This may reflect the retention of tetracycline in the cytoplasm. Twenty-four hours after the withdrawal of tetracycline, the intracellular HBV continuously increased 15-fold from 24 to 96 h in GRP78-silenced HepAD38 cells. However, the intracellular HBV was significantly inhibited in HepAD38 cells treated with mock siRNAs against SARS coronavirus (p < 0.01); particularly the intracellular HBV levels were almost the same at time points 72 and 96 h. To show how GRP78 responded to HBV replication, we performed quantitative RT-PCR experiments to demonstrate the mRNA levels of GRP78. As shown in Fig. 5B, the GRP78 transcripts rapidly increased 25% from 12 to 48 h and were maintained at almost the same high levels from 48 to 96 h in HepAD38 cells. In contrast, the GRP78 mRNA level was reduced by about 70% in those cells treated with specific siRNAs against GRP78 at 24 h and remained at similar low levels until 96 h. Taken together, these results demonstrated that GRP78 responded to HBV replication and physiologically inhibited HBV replication.
Fig. 5.

Kinetics of HBV and GRP78 mRNA levels in HepAD38 cells. A, the intracellular HBV virions in siSARS- and siGRP78-1-treated HepAD38 cells. B, the mRNA levels of GRP78 in siSARS- and siGRP78-1-treated HepAD38 cells. The values were normalized with GAPDH mRNA levels (loading control) and expressed as -fold changes to base-line level (at time point 0 h), which was set as 1. Data are expressed as mean ± S.D. (n = 3; *, p < 0.01, siGRP78-1 versus siSARS at the same time point).
Down-regulation of GRP78 in Postlamivudine Treatment Liver Biopsies
To confirm whether GRP78 overexpression was triggered in HBV-infected liver tissues, GRP78 immunoreactivity was examined in 19 paired pre- and postlamivudine treatment liver biopsies of CHB patients by immunohistochemical staining. All selected patients have been demonstrated to have a remarkable reduction of HBV DNA in serum after receiving lamivudine monotherapy in our previous study (12). The serum HBV DNA levels (log10 copies/ml) in patients before and after lamivudine treatment are shown in Fig. 6A. As illustrated, a significant drop in serum HBV viral load was observed in the post-treatment group when compared with the pretreatment group (pretreatment serum HBV load, 8.12 ± 1.19 log10 copies/ml; post-treatment serum HBV load, 5.23 ± 2.25 log10 copies/ml; p < 0.001). The paraffin-embedded liver biopsies of these lamivudine-sensitive patients were then processed and immunostained with anti-GRP78 antibodies.
Fig. 6.

GRP78 is down-regulated in postlamivudine treatment liver biopsies. A, serum HBV DNA levels of 19 CHB patients pretreatment (median, 8.47 log10 copies/ml; range, 6–9.37 log10 copies/ml) and post-treatment (median, 6.18 log10 copies/ml; range, 2–8.33 log10 copies/ml; p < 0.001) with lamivudine. B, GRP78 staining scores of liver biopsies from 19 CHB patients pretreatment (median, 2.5; range, 2–4) and post-treatment (median, 2.5; range, 1–3.5; p = 0.019) with lamivudine. The box plots display the median (bold middle line), the 25th and 75th percentiles (box margins), and the minimum and maximum values (whiskers). Outlying values are expressed as circles, and p values are indicated. C1–C3, representative microphotographs of GRP78 immunochemical staining in a pair of liver biopsies before (C1) and after (C2) lamivudine treatment. C3 is the negative control without primary antibody (magnification, ×200).
In the present study, all liver sections showed diffuse positive staining for GRP78. In general, 52.6% (10 of 19) of cases showed decreased staining in post-treatment biopsies, 31.6% (6 of 19) presented equal staining, and 15.8% (3 of 19) exhibited increased staining. In addition the GRP78 staining scores were significantly lower in the post-treatment group than those of the pretreatment group (Fig. 6B; pretreatment GRP78 scores, 2.68 ± 0.61; post-treatment GRP78 scores, 2.34 ± 0.60; p = 0.019). As shown in Fig. 6, a uniform moderate-to-intense staining of GRP78 was noted in the prelamivudine treatment biopsy (Fig. 6C1) in contrast to the weak staining observed in the postlamivudine treatment sample (Fig. 6C2). Moreover the GRP78 staining displayed a general cytoplasmic distribution in hepatocytes with partial enrichment in the perinuclear region. On the contrary, no GRP78 signal was detected in the negative control where primary antibodies were omitted (Fig. 6C3).
GRP78 Inhibits HBV Replication through IFN-β-dependent Pathway in HepG2 Cells
The mRNA levels of GRP78, IFN-β1, OAS1, OAS2, and RNase L were all significantly up-regulated in the pGRP78-transfected HepG2 cells when compared with that in the control (i.e. cells transfected with pEGFP). However, no significant changes were observed for IFN-α1, ISG15, Mx1, OAS3, OASL, and PKR (Fig.7A).
Fig. 7.

Effects of GRP78 overexpression on IFNs and IFN-inducible gene mRNA expression and IFN stimulation on GRP78 expression in HepG2 cells. A, mRNA expression levels of GRP78, IFNs (IFN-α1 and IFN-β1), and IFN-inducible genes (ISG15, Mx1, OAS1, OAS2, OAS3, OASL, RNase L, and PKR measured by real time RT-PCR. B1, dose-dependent effect of IFN-β1a on the GRP78 expression in HepG2 cells. Total RNA was isolated from HepG2 cells 8 h after the treatment with varying concentrations of IFN-β1a (0, 1, 10, 100, and 1000 units/ml), and real time RT-PCR was performed to measure GRP78 expression. B2, time course change of the mRNA expression of GRP78 after IFN-β1a treatment. Total RNA was extracted from HepG2 cells treated with 1000 units/ml IFN-β1a at the indicated incubation times (0, 2, 4, 6, 8, 10, and 12 h) and used for real time RT-PCR analysis. The expression levels of GRP78, IFNs, and IFN-inducible genes were normalized to GAPDH mRNA level and are expressed as -fold changes to corresponding controls. Data are expressed as mean ± S.D. (n = 3; *, p < 0.05; **, p < 0.01). C1, time-dependent elevation of GRP78 protein expression induced by IFN-β1a (1000 units/ml) (n = 3). C2, GRP78 protein expression in response to IFN-αA (1000 units/ml) and IFN-β1a (1000 units/ml) treatment, respectively, for 24 h (n = 3).
To investigate whether there was a feedback regulation of GRP78 by IFNs, the expression level of GRP78 in both IFN-αA-treated and IFN-β1a-treated HepG2 cells was examined. Our results showed that the mRNA expression of GRP78 increased positively with an increase of concentration of IFN-β1a (Fig. 7B1). In addition IFN-β1a treatment induced a time-dependent up-regulation of GRP78 transcripts in HepG2 cells with a peak level noted at 10 h post-treatment (Fig. 7B2). Consistent with real time PCR results, time-dependent stimulation of GRP78 protein expression by IFN-β1a was also observed in HepG2 cells using Western blotting (Fig. 7C1). In contrast, no obvious change of GRP78 protein level was observed after IFN-αA treatment (Fig.7C2).
DISCUSSION
In the present study, we revealed the changes of the proteomic profile of hepatocytes upon HBV replication using an inducible HBV-producing system. By using 2-DE combined with MALDI-TOF/TOF MS and MS/MS analysis, 23 differentially expressed proteins were identified. Among them, 16 proteins were up-regulated and seven were down-regulated by HBV replication. Particularly GRP78 was revealed as an intracellular anti-HBV factor using the gain- and loss-of-function studies, which suggested a new defense against HBV in hepatocytes. To our knowledge, this is the first report on a natural intracellular anti-HBV mechanism in hepatocytes other than apolipoprotein B mRNA-editing enzyme catalytic-polypeptide (APOBEC) proteins.
Although in the past decades considerable efforts have been made in describing the molecular biology of HBV, the host responses to HBV infection at various stages are poorly defined. Previous studies have focused on the impact of HBV replication on the host gene and protein expression at the terminal HCC stage (14–17). In this study, we used HepAD38 cells to demonstrate the host early response to HBV replication. This system would ultimately eliminate the potential artificial observations caused by the difference of genetic backgrounds. Concordant with previous findings (7, 8, 18–20), the differentially expressed proteins identified by the present study also participated in various functional aspects including oxidoreduction, metabolism, protein folding and transport, cell growth, transcription, and signal transduction. This indicates that HBV infection is a multifactorial disease in which HBV replication perturbs hepatic biochemical balance and signal transduction pathways. Among the identified proteins, heterogeneous nuclear ribonucleoprotein K (HNRPK) was shown to be increased by 2-fold in the HBV-replicating HepAD38 cells. Such a finding was not surprising because HNRPK was shown to play crucial roles in the replication of HBV and other DNA/RNA viruses as a host supportive protein (21–26). The up-regulation of HNRPK in HepAD38 cells when tetracycline was withdrawn would be a consequence of the host response initiated by HBV to facilitate viral replication. In addition, several B-type HCC-associated proteins, such as superoxide dismutase 1, enolase 1, aldehyde dehydrogenase, and proliferating cell nuclear antigen (PCNA) (14, 15), were also identified in our study. This suggests that these proteins might be carrying out crucial roles in HCC tumorigenesis.
In this study, GRP78 is one of the proteins that showed significant changes upon HBV replication. It is best known as an endoplasmic reticulum (ER) chaperone and a central monitor of ER stress. It plays an essential role in a wide variety of cellular functions including protein folding and assembly, degradation of misfolded proteins, Ca2+ binding, and the activation of the unfolded protein response (UPR) to relieve ER stress and thus to protect the cell from apoptosis. Recently the functional connection between the ER stress response and HBV infection has been reported. It was suggested that the response of GRP78 promoter and the changes in GRP78 levels upon HBV infection were viral genotype/subgenotype-dependent (27, 28). In the present study, GRP78 expression was demonstrated to be stimulated by HBV replication in HepAD38 cells and transient HBV-producing HepG2 cells. Contrary to HBV induction, GRP78 expression in HepAD38 cells was gradually attenuated in a time-dependent manner at the onset of HBV inhibition by introduction of tetracycline. We noticed that the mRNA of GRP78 increased to a high level at 48 h; thereafter the HBV titers did not increase after 72 h in HepAD38 cells. The delayed inhibition of HBV replication indicated that the accumulation of GRP78 protein was needed (Fig. 5A). We also noticed that the naturally elevated GRP78 by HBV reduced the ratio of HBV replication but could not completely inhibit HBV replication. This could explain why HBV infection often causes chronic infection in children, whereas acute infection occurs in adults. Other mechanisms, e.g. the mature immune responses, serve as additional important forces that would synergize the antiviral effects in adults.
The up-regulation of GRP78 upon HBV replication may be explained by the activation of UPR that enhanced the synthesis and translation of ER chaperones in ER stress (29) and the direct activation of GRP78 promoter by HBV proteins (30). To test this hypothesis, we checked whether the UPR signaling pathways, including the inositol-requiring enzyme 1-, the protein kinase R-like ER kinase-, and the activating transcription factor 6-mediated signal transduction, were activated by HBV replication. As shown in supplemental Fig. S25, the inositol-requiring enzyme 1 downstream effector X-box-binding protein 1 was slightly activated as indicated by a faint spliced RT-PCR product (supplemental Fig. S25A). However, we detected obvious activating transcription factor 6 cleavage, significant elevation of protein kinase R-like ER kinase, and phosphorylated protein kinase R-like ER kinase. And the levels of both eukaryotic translation initiation factor 2α and phosphorylated eukaryotic translation initiation factor 2α (the downstream effectors of protein kinase R-like ER kinase) were also significantly increased. Furthermore the examination of paired pre- and postlamivudine treatment patient liver biopsy specimens and the quantification of serum HBV DNA revealed a statistically significant up-regulation in GRP78 expression in pretreatment biopsies that was concomitant with the high HBV loads in sera. These findings further confirmed the inducible effects of HBV replication on GRP78 expression observed in the non-tetracycline-treated HepAD38 and pHBV-transfected HepG2 cells. Considering that GRP78 plays important roles in protein folding and transport (31–33), we hypothesized that GRP78 may be a host-responsive factor that supports HBV replication, virion packaging, and/or secretion. To test this hypothesis, siRNA targeting GRP78 was used in pHBV-transfected HepG2 cells, and core-associated HBV DNA in both the cytoplasm and culture medium was quantified. To our surprise, the down-regulation of GRP78 could eventually lead to the augmentation of both intracellular and extracellular HBV viral loads. To further demonstrate the functional significance of GRP78 in HBV replication, GRP78 was artificially overexpressed in pHBV-transfected HepG2 cells. As expected, both intracellular and extracellular HBV virions were greatly reduced in the presence of high levels of GRP78, demonstrating that GRP78 functions as an endogenous anti-HBV factor.
Interferons are a family of antiviral cytokines that can be triggered by innate immunity in response to viral infection. They are secreted by lymphocytes, bind to the receptors in target cell membranes, and trigger the intracellular antiviral responses. In this study, we checked whether IFN-triggered antiviral signaling pathways were activated by GRP78 overexpression in HepG2 cells. As shown in Fig. 7A, elevated mRNA levels of IFN-β1, OAS1, OAS2, and RNase L were observed, suggesting an induction of IFN-β1 as well as the activation of the IFN-β1-regulated OAS/RNase L signaling pathway during GRP78-induced HBV inhibition. However, three other effector pathways of the type I IFN-mediated antiviral response, i.e. the ISG15 ubiquitin-like pathway, the Mx GTPase pathway, and the protein kinase R pathway, were less likely to be activated as demonstrated by minimal changes in the mRNA levels of related genes. Recent studies have shown that GRP78 is implicated in IFN-γ folding (34), induction (35), and immune responses (36, 37), yet the underlying mechanisms of how IFN-β induction was initiated in GRP78-overexpressing HepG2 cells have yet to be elucidated. In addition, we also checked whether GRP78 and IFN-β1 could form an antiviral activation loop in response to HBV replication. Our data demonstrated that IFN-β1a induced GRP78 overexpression in both dose- and time-dependent manners in HepG2 cells. As proposed in Fig. 8, GRP78 and IFN-β1 form a positive feedback loop where mutual activation of GRP78 and IFN-β1 occurs. Once autocrine or paracrine IFN-β binds to IFN receptors, the signaling cascades are initiated, and the IFN-stimulated genes (e.g. OAS1 and OAS2) are then induced. Thereafter, the downstream antiviral effector RNase L is specifically activated, and HBV suppression is resulted. Conversely IFN-α was unlikely to be involved in GRP78-induced HBV suppression because no interactive effect was found between their changes in expression level. Taken together, our data suggest that the IFN-β1-regulated OAS/RNase L pathway contributes to the anti-HBV effect of GRP78 in the HepG2 cells.
Fig. 8.
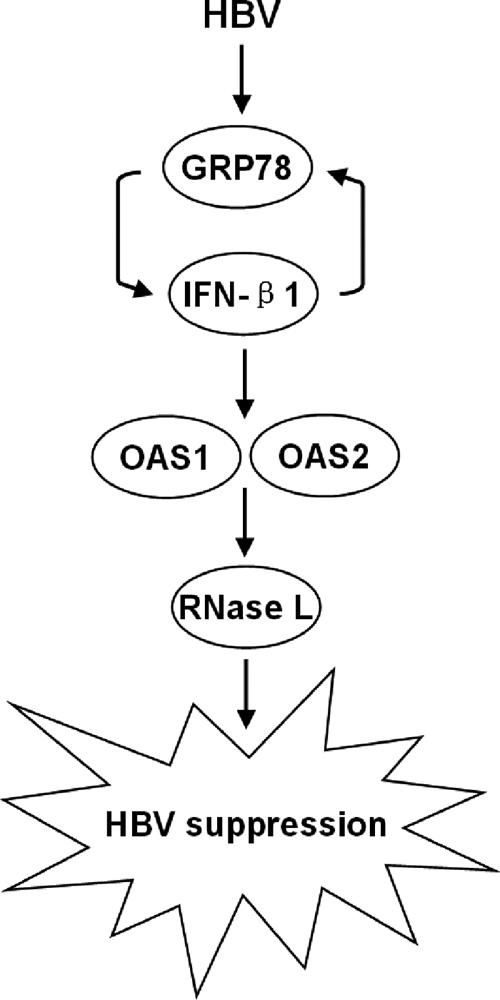
Proposed mechanisms for the anti-HBV activity of GRP78 in HepG2 cells. The mutual activation of GRP78 and IFN-β1 may compose a positive feedback loop that amplifies signal by inducing OAS1 and OAS2 overexpression. The antiviral effector RNase L is then activated, thereby suppressing HBV replication.
Viruses make full use of the cellular machinery to facilitate their reproduction. On the other hand, infected host cells exert an antiviral response to cope with the viral persistent replication. The balance of these two opposite forces determines human health upon viral infection. The present study demonstrates for the first time that GRP78 functions as an endogenous anti-HBV factor, which works via the IFN-β-mediated signaling pathway in hepatocytes. Further studies will be necessary to characterize the antiviral process of GRP78, to decipher the seemingly paradoxical roles of GRP78 in HBV pathogenesis, and to describe the functional correlation between the remaining HBV response factors identified in our study and HBV infection. Such information will refine our knowledge of the combined virus-host network and provide us an opportunity to develop novel anti-HBV drugs based on host response that may overcome the resistance to the current nucleotide analogues caused by fast mutagenesis of virus.
Supplementary Material
Footnotes
* This work was supported by a direct grant from the Chinese University of Hong Kong and Research Grant Council of Hong Kong (Grant CUHK4428/06M to M.-L. H.).
 The on-line version of this article (available at http://www.mcponline.org) contains supplemental Figs. S1–S25.
1 The abbreviations used are:
- HBV
- hepatitis B virus
- GRP78
- glucose-regulated protein 78
- IFN
- interferon
- OAS
- 2′ ,5′-oligoadenylate synthetase
- CHB
- chronic hepatitis B
- HCC
- hepatocellular carcinoma
- 2-DE
- two-dimensional gel electrophoresis
- siRNA
- small interfering RNA
- SARS
- severe acute respiratory syndrome
- HBsAg
- hepatitis B surface antigen
- HBeAg
- hepatitis B e antigen
- ISG15
- IFN-stimulated protein of 15 kDa
- Mx
- myxovirus resistance
- OASL
- OAS-like
- GAPDH
- glyceraldehyde-3-phosphate dehydrogenase
- HNRPK
- heterogeneous nuclear ribonucleoprotein K
- PCNA
- proliferating cell nuclear antigen
- ER
- endoplasmic reticulum
- UPR
- unfolded protein response
- EGFP
- enhanced green fluorescent protein
- S/N
- signal/noise
- NCBI
- National Center for Biotechnology Information
- Tet
- tetracycline
REFERENCES
- 1.Lai C. L., Ratziu V., Yuen M. F., Poynard T. (2003) Viral hepatitis B. Lancet 362, 2089–2094 [DOI] [PubMed] [Google Scholar]
- 2.Parkin D. M., Bray F., Ferlay J., Pisani P. (2001) Estimating the world cancer burden: Globocan 2000. Int. J. Cancer 94, 153–156 [DOI] [PubMed] [Google Scholar]
- 3.Custer B., Sullivan S. D., Hazlet T. K., Iloeje U., Veenstra D. L., Kowdley K. V. (2004) Global epidemiology of hepatitis B virus. J. Clin. Gastroenterol 38, S158–168 [DOI] [PubMed] [Google Scholar]
- 4.Pisani P., Parkin D. M., Bray F., Ferlay J. (1999) Estimates of the worldwide mortality from 25 cancers in 1990. Int. J. Cancer 83, 18–29 [DOI] [PubMed] [Google Scholar]
- 5.Ladner S. K., Otto M. J., Barker C. S., Zaifert K., Wang G. H., Guo J. T., Seeger C., King R. W. (1997) Inducible expression of human hepatitis B virus (HBV) in stably transfected hepatoblastoma cells: a novel system for screening potential inhibitors of HBV replication. Antimicrob. Agents Chemother 41, 1715–1720 [DOI] [PMC free article] [PubMed] [Google Scholar]
- 6.Sells M. A., Chen M. L., Acs G. (1987) Production of hepatitis B virus particles in Hep G2 cells transfected with cloned hepatitis B virus DNA. Proc. Natl. Acad. Sci. U.S.A 84, 1005–1009 [DOI] [PMC free article] [PubMed] [Google Scholar]
- 7.Liu K., Qian L., Wang J., Li W., Deng X., Chen X., Sun W., Wei H., Qian X., Jiang Y., He F. (2009) Two-dimensional blue native/SDS-PAGE analysis reveals heat shock protein chaperone machinery involved in hepatitis B virus production in HepG2.2.15 cells. Mol. Cell. Proteomics 8, 495–505 [DOI] [PMC free article] [PubMed] [Google Scholar]
- 8.Tong A., Wu L., Lin Q., Lau Q. C., Zhao X., Li J., Chen P., Chen L., Tang H., Huang C., Wei Y. Q. (2008) Proteomic analysis of cellular protein alterations using a hepatitis B virus-producing cellular model. Proteomics 8, 2012–2023 [DOI] [PubMed] [Google Scholar]
- 9.Chen Y., Du D., Wu J., Chan C. P., Tan Y., Kung H. F., He M. L. (2003) Inhibition of hepatitis B virus replication by stably expressed shRNA. Biochem. Biophys. Res. Commun 311, 398–404 [DOI] [PubMed] [Google Scholar]
- 10.He M. L., Zheng B. J., Chen Y., Wong K. L., Huang J. D., Lin M. C., Peng Y., Yuen K. Y., Sung J. J., Kung H. F. (2006) Kinetics and synergistic effects of siRNAs targeting structural and replicase genes of SARS-associated coronavirus. FEBS Lett 580, 2414–2420 [DOI] [PMC free article] [PubMed] [Google Scholar]
- 11.He M. L., Zheng B., Peng Y., Peiris J. S., Poon L. L., Yuen K. Y., Lin M. C., Kung H. F., Guan Y. (2003) Inhibition of SARS-associated coronavirus infection and replication by RNA interference. JAMA 290, 2665–2666 [DOI] [PubMed] [Google Scholar]
- 12.Chan H. L., Leung N. W., Hui A. Y., Wong V. W., Liew C. T., Chim A. M., Chan F. K., Hung L. C., Lee Y. T., Tam J. S., Lam C. W., Sung J. J. (2005) A randomized, controlled trial of combination therapy for chronic hepatitis B: comparing pegylated interferon-alpha2b and lamivudine with lamivudine alone. Ann. Intern. Med 142, 240–250 [DOI] [PubMed] [Google Scholar]
- 13.Chen Y., Lin M. C., Wang H., Chan C. Y., Jiang L., Ngai S. M., Yu J., He M. L., Shaw P. C., Yew D. T., Sung J. J., Kung H. F. (2007) Proteomic analysis of EZH2 downstream target proteins in hepatocellular carcinoma. Proteomics 7, 3097–3104 [DOI] [PubMed] [Google Scholar]
- 14.Sun W., Xing B., Sun Y., Du X., Lu M., Hao C., Lu Z., Mi W., Wu S., Wei H., Gao X., Zhu Y., Jiang Y., Qian X., He F. (2007) Proteome analysis of hepatocellular carcinoma by two-dimensional difference gel electrophoresis: novel protein markers in hepatocellular carcinoma tissues. Mol. Cell. Proteomics 6, 1798–1808 [DOI] [PubMed] [Google Scholar]
- 15.Li C., Tan Y. X., Zhou H., Ding S. J., Li S. J., Ma D. J., Man X. B., Hong Y., Zhang L., Li L., Xia Q. C., Wu J. R., Wang H. Y., Zeng R. (2005) Proteomic analysis of hepatitis B virus-associated hepatocellular carcinoma: identification of potential tumor markers. Proteomics 5, 1125–1139 [DOI] [PubMed] [Google Scholar]
- 16.Kim M. Y., Park E., Park J. H., Park D. H., Moon W. S., Cho B. H., Shin H. S., Kim D. G. (2001) Expression profile of nine novel genes differentially expressed in hepatitis B virus-associated hepatocellular carcinomas. Oncogene 20, 4568–4575 [DOI] [PubMed] [Google Scholar]
- 17.Okabe H., Satoh S., Kato T., Kitahara O., Yanagawa R., Yamaoka Y., Tsunoda T., Furukawa Y., Nakamura Y. (2001) Genome-wide analysis of gene expression in human hepatocellular carcinomas using cDNA microarray: identification of genes involved in viral carcinogenesis and tumor progression. Cancer Res 61, 2129–2137 [PubMed] [Google Scholar]
- 18.Yang F., Yan S., He Y., Wang F., Song S., Guo Y., Zhou Q., Wang Y., Lin Z., Yang Y., Zhang W., Sun S. (2008) Expression of hepatitis B virus proteins in transgenic mice alters lipid metabolism and induces oxidative stress in the liver. J. Hepatol 48, 12–19 [DOI] [PubMed] [Google Scholar]
- 19.Severi T., Ying C., Vermeesch J. R., Cassiman D., Cnops L., Verslype C., Fevery J., Arckens L., Neyts J., van Pelt J. F. (2006) Hepatitis B virus replication causes oxidative stress in HepAD38 liver cells. Mol. Cell. Biochem 290, 79–85 [DOI] [PubMed] [Google Scholar]
- 20.Hajjou M., Norel R., Carver R., Marion P., Cullen J., Rogler L. E., Rogler C. E. (2005) cDNA microarray analysis of HBV transgenic mouse liver identifies genes in lipid biosynthetic and growth control pathways affected by HBV. J. Med. Virol 77, 57–65 [DOI] [PubMed] [Google Scholar]
- 21.Zhang W., Zhang X., Tian C., Wang T., Sarkis P. T., Fang Y., Zheng S., Yu X. F., Xu R. (2008) Cytidine deaminase APOBEC3B interacts with heterogeneous nuclear ribonucleoprotein K and suppresses hepatitis B virus expression. Cell. Microbiol 10, 112–121 [DOI] [PubMed] [Google Scholar]
- 22.Ng L. F., Chan M., Chan S. H., Cheng P. C., Leung E. H., Chen W. N., Ren E. C. (2005) Host heterogeneous ribonucleoprotein K (hnRNP K) as a potential target to suppress hepatitis B virus replication. PLoS Med 2, e163. [DOI] [PMC free article] [PubMed] [Google Scholar]
- 23.Lin J. Y., Li M. L., Huang P. N., Chien K. Y., Horng J. T., Shih S. R. (2008) Heterogeneous nuclear ribonuclear protein K interacts with the enterovirus 71 5′ untranslated region and participates in virus replication. J. Gen. Virol 89, 2540–2549 [DOI] [PubMed] [Google Scholar]
- 24.Wolf D., Witte V., Clark P., Blume K., Lichtenheld M. G., Baur A. S. (2008) HIV Nef enhances Tat-mediated viral transcription through a hnRNP-K-nucleated signaling complex. Cell Host Microbe 4, 398–408 [DOI] [PubMed] [Google Scholar]
- 25.Burnham A. J., Gong L., Hardy R. W. (2007) Heterogeneous nuclear ribonuclear protein K interacts with Sindbis virus nonstructural proteins and viral subgenomic mRNA. Virology 367, 212–221 [DOI] [PubMed] [Google Scholar]
- 26.Hsieh T. Y., Matsumoto M., Chou H. C., Schneider R., Hwang S. B., Lee A. S., Lai M. M. (1998) Hepatitis C virus core protein interacts with heterogeneous nuclear ribonucleoprotein K. J. Biol. Chem 273, 17651–17659 [DOI] [PubMed] [Google Scholar]
- 27.Sugiyama M., Tanaka Y., Kato T., Orito E., Ito K., Acharya S. K., Gish R. G., Kramvis A., Shimada T., Izumi N., Kaito M., Miyakawa Y., Mizokami M. (2006) Influence of hepatitis B virus genotypes on the intra- and extracellular expression of viral DNA and antigens. Hepatology 44, 915–924 [DOI] [PubMed] [Google Scholar]
- 28.Chua P. K., Wang R. Y., Lin M. H., Masuda T., Suk F. M., Shih C. (2005) Reduced secretion of virions and hepatitis B virus (HBV) surface antigen of a naturally occurring HBV variant correlates with the accumulation of the small S envelope protein in the endoplasmic reticulum and Golgi apparatus. J. Virol 79, 13483–13496 [DOI] [PMC free article] [PubMed] [Google Scholar]
- 29.Ni M., Lee A. S. (2007) ER chaperones in mammalian development and human diseases. FEBS Lett 581, 3641–3651 [DOI] [PMC free article] [PubMed] [Google Scholar]
- 30.Xu Z., Jensen G., Yen T. S. (1997) Activation of hepatitis B virus S promoter by the viral large surface protein via induction of stress in the endoplasmic reticulum. J. Virol 71, 7387–7392 [DOI] [PMC free article] [PubMed] [Google Scholar]
- 31.Awe K., Lambert C., Prange R. (2008) Mammalian BiP controls posttranslational ER translocation of the hepatitis B virus large envelope protein. FEBS Lett 582, 3179–3184 [DOI] [PubMed] [Google Scholar]
- 32.Cho D. Y., Yang G. H., Ryu C. J., Hong H. J. (2003) Molecular chaperone GRP78/BiP interacts with the large surface protein of hepatitis B virus in vitro and in vivo. J. Virol 77, 2784–2788 [DOI] [PMC free article] [PubMed] [Google Scholar]
- 33.Doms R. W., Lamb R. A., Rose J. K., Helenius A. (1993) Folding and assembly of viral membrane proteins. Virology 193, 545–562 [DOI] [PubMed] [Google Scholar]
- 34.Vandenbroeck K., Martens E., Alloza I. (2006) Multi-chaperone complexes regulate the folding of interferon-gamma in the endoplasmic reticulum. Cytokine 33, 264–273 [DOI] [PubMed] [Google Scholar]
- 35.Brownlie R. J., Myers L. K., Wooley P. H., Corrigall V. M., Bodman-Smith M. D., Panayi G. S., Thompson S. J. (2006) Treatment of murine collagen-induced arthritis by the stress protein BiP via interleukin-4-producing regulatory T cells: a novel function for an ancient protein. Arthritis Rheum 54, 854–863 [DOI] [PubMed] [Google Scholar]
- 36.Hegde N. R., Chevalier M. S., Wisner T. W., Denton M. C., Shire K., Frappier L., Johnson D. C. (2006) The role of BiP in endoplasmic reticulum-associated degradation of major histocompatibility complex class I heavy chain induced by cytomegalovirus proteins. J. Biol. Chem 281, 20910–20919 [DOI] [PubMed] [Google Scholar]
- 37.Triantafilou M., Fradelizi D., Triantafilou K. (2001) Major histocompatibility class one molecule associates with glucose regulated protein (GRP) 78 on the cell surface. Hum. Immunol 62, 764–770 [DOI] [PubMed] [Google Scholar]
Associated Data
This section collects any data citations, data availability statements, or supplementary materials included in this article.