

Abstract
To better understand individual differences in sensation seeking and its components, including boredom susceptibility and experience seeking, we examined brain responses of high and low sensation seekers during repeated visual experience. Individuals scoring in the top and bottom quartiles from a college-aged population on the Brief Sensation-Seeking Scale (BSSS) participated in an event-related potentials (ERPs) experiment. Line drawings of common objects were randomly intermixed and presented 1–3 times. Sixty-four channel ERP responses were recorded while participants classified items as “man-made” or “not man-made” in a repetition priming task. The two groups showed different ERP responses at frontal electrode sites after seeing a visual stimulus for 400–800 ms. The frontal late positive components (LPC) showed different habituation of ERP responses to new and studied repeated objects between high and low sensation seekers. Source localization analysis (LORETA) indicated that during visual stimulus adaptation the left ventral pre-frontal cortex showed lack of frontal involvement among high sensation seekers. Furthermore, frontal LPC latencies during repeated visual exposure correlated with boredom susceptibility and experience seeking subscales. The distinct profiles of brain responses to repeated visual experience in high and low sensation seekers provide evidence that individual differences in neural adaptation can be linked to personality dimensions.
Keywords: sensation seeking, repetition effect, EEG/ERP, priming, LORETA, LPC
1. Introduction
Novel experiences, such as traveling to new places, tasting new food, and experiencing new music and art, are highly rewarding to some individuals. In contrast, repeated experiences, such as listening to a favorite song and watching the same movie multiple times, are rewarding to others. Sensation seeking is a personality trait defined as the tendency to seek varied, novel and complex sensations and new experiences (e.g. Zuckerman et al., 1974; 1978; Cloninger et al., 1991; Bardo et al., 1996; Roberti, 2004). Some, but not all, of these new experiences involve risky behavior, such as sexual experimentation, skydiving, and illegal drug use. Consequently, high sensation seekers have been found to have an increased health risk. In terms of cognitive processes, high sensation seekers tend to be proficient at divided attention tasks, particularly those involving new experiences; but, they are less proficient in sustained attention and become easily bored with repeated experience (Zuckerman, 1994; 2005; Brocke et al., 1999).
Recent work has begun to explore the neural correlates of sensation seeking. Several studies have used event-related potentials (ERPs), which are voltage changes recorded on the scalp elicited by brain activity in response to specific events. Mean amplitude of ERP late positive components (LPC)—positive brain potentials occurring about 300–900 ms after presentation of a stimulus—has been linked to attention and recognition of new and previously seen stimuli (Kok, 2001). Previous studies have focused on the relationship between the personality trait of sensation, including novelty, seeking and amplitude of ERP late positive components (e.g. Cloninger et al., 1991) but with varying results. For instance, Hansenne et al. (1999) reported that novelty seeking was positively correlated with LPC amplitude. In contrast Wang and Wang (2001) reported a negative correlation between auditory passive LPC amplitude and sensation seeking, as defined by Zuckerman (1994). In another study, which used an “odd-ball” task, skydivers, who tend to be high sensation seekers, were found to have larger frontal LPC amplitude to non-targets than the control group (Pierson et al., 1999). A recent study also reported that schizophrenic patients with high sensation seeking scores have larger memory-related LPC components (Guillem et al., 2005). A recent investigation by Fjell et al. (2007) suggests that ERP adaptation may be more relevant than absolute ERP amplitude to traits of sensation seeking. The authors found that ERPs of men who participated in extreme sports (frontal P3a or “novelty-P3”) habituated more rapidly than in other groups. There were no differences between the groups in overall P3 or LPC amplitude. Additionally, previous studies have also reported delayed LPC among impulsive high sensation seekers (Wang and Wang, 2001; Pascalis et al., 2004). These studies demonstrate sensation seeking is associated with LPC, but the specifics of the relationship vary as a function of the study context.
In the present study, we sought to provide a more detailed characterization of LPC responses to repeated visual experience as a function of sensation-seeking status. Here we used a modified version of a repetition or adaptation task to examine individual differences in brain responses to repeated experience. Though the neural basis of repetition effects is still under debate (see a review by Grill-Spector et al., 2006), a large body of literature has examined effects of repetition of visual objects using single-cell recording in primates (see a review by Desimone, 1996), and in humans, ERP (e.g. Rugg and Nagy, 1987; Bentin & McCarthy, 1994; Guo et al., 2007), fMRI (e.g. Jiang et al., 2000; Henson, 2003; Yi and Chun, 2005; Mecklinger, 2006), and multimodal imaging (Gonsalves et al., 2005) methods. The changes in the firing properties, or numbers of neurons, activated during repeated presentation of stimuli allow us to differentiate visual stimuli that are previously encountered from new, or unfamiliar objects (Wiggs and Martin, 1998). Neural responses to repeated visual items can be altered by normal aging (e.g. Lawson et al., 2007), mental disorders such as Alzheimer’s’ disease (Olichney et al., 2006), schizophrenia with thought disorders (Matsumoto et al., 2005), and chronic alcoholism (Zhang et al., 1997). Many cognitive and personality dimensions including boredom (Matthews and Desmond, 1998; Thiffault and Jacques Bergeron, 2003), visual attention (Yi and Chun, 2005), emotion (Bentley et al., 2003), and judgment of self and others (Jenkins et al., 2008) can also impact the magnitude and timing of brain responses to repeated stimuli.
High and low sensation seekers differ in visual attention, arousal, and boredom involved with repeated experience (Zuckerman, 1994; 2005). While high and low sensation seekers repeatedly classified visual objects as either man-made or not man-made, we recorded their ERP responses. We hypothesized that differential brain responses to repeated experience, specifically the magnitude and latency of LPC’s, would vary among high and low sensation seekers. Although most previous ERP research has treated sensation seeking as a unitary construct, it is actually a multi-dimensional trait (Zuckerman, 1994; Miller et al., 2007). Consequently, in order to further investigate the neural basis underlying the differences between high and low sensation seekers, we also examined the relationship between brain potentials and participant scores on Form V Sensation Seeking Scale. This scale includes four subscales (reflecting four personality components) of sensation seeking: thrill and adventure seeking, experience seeking, disinhibition, and boredom susceptibility (Zuckerman et al., 1978).
2. Methods
2.1. Participants
Potential volunteers were recruited from flyers, class announcements, and word of mouth, as well as advertisements placed in the University of Kentucky campus and community newspapers in Lexington, Kentucky. Volunteers were first directed to a web site where they provided general health and demographic information and completed the 8-item Brief Sensation Seeking Scale (BSSS)(Hoyle et al., 2002). Those reporting good health and who were in the upper (score >32 for both males and females) or lower (score < 27 for males and < 25 for females) quartiles of college-aged population scores on the BSSS (based on data from Harrington et al., 2003) were contacted by telephone and asked to complete a brief phone interview to verify the information provided during the web survey. From the initial group of potential volunteers, a total of 40 participants (ages 18 to 25) were accepted for inclusion. Subjects attended an interview/medical screening session and completed medical and psychological questionnaires. These questionnaires included locally-developed health and personal history questionnaires, a 17-item drug use questionnaire derived from the Addiction Severity Index (McLellan et al., 1992), the computerized Edinburgh Handedness Inventory (Oldfield, 1971), and the Michigan Alcoholism Screening Test (Selzer et al., 1975). Volunteers also took an eye exam using the MIS Pocket Vision Guide. Exclusion criteria included: (1) any major medical conditions, including neurological (e.g. stroke or seizures) and psychiatric (e.g. depression, schizophrenia, panic disorder) disorders, (2) prior closed head injury or concussion, (3) current use of medications that affect the central nervous system, (4) current or past diagnosis of a learning disability, and (5) left-handedness.
Each subject also completed the Sensation Seeking Scale Form V (SSS Form V) (Zuckerman et al., 1978). Each of the four subscales—experience seeking (ES), thrill seeking (TAS), disinhibition (DIS), and boredom susceptibility (BS)—contained 10 items in which participants were asked to choose which of two options were most descriptive of themselves. The factor structure, internal consistency, convergent validity, and reliability of the SSS Form V and the subscales have been previously established (Roberti et al., 2003; Zuckerman, 2005).
In addition to the medical questionnaire, urine samples were collected to enable independent tests of drug use (cocaine, marijuana, amphetamines, benzodiazepines, opioids etc.) and pregnancy during the medical screening and prior to the data collection session. No evidence of drug use or pregnancy was detected in any participant. Participants received financial compensation, including payments for the medical screening ($25) and the completed session ($40), along with a bonus ($40) for completing the study and abstaining from drug use for the duration of the study. Data from two participants from the low sensation seeking group and four participants from the high sensation seeking group were dropped from the study due to excessive EEG movement artifact.
2.2. Visual stimuli and task
Pictures used as experimental stimuli consisted of line drawings of common objects developed by Snodgrass and Vanderwart (1980). Stimuli were displayed on a computer screen approximately 65 cm from the participants, and the visual angle was approximately 7 degrees. Object size was 8 cm by 6 cm, displayed in front of a black background.
There were two phases to the experiment, as indicated in Figure 1. Participants initially studied a series of 100 pictures displayed for 4 seconds each on a computer screen. They were asked to intentionally encode (memorize) each picture object (Fig 1a). All of the participants were tested immediately after the study phase. Subjects identified as “new” or “old” randomly presented test pictures (half studied and half new). All subjects reached a recognition accuracy of 95–100%. Following the study phase, participants were fitted with the 64-channel Quick-Cap (Neuromedical Supplies) used for electroencephalogram (EEG) recording. Next, the participants completed the test phase of the experiment: the classification of repeated pictures.
Figure 1.

Examples of the visual presentations of the repeated new and studied objects during the learning (1a) and testing (1b) phases of the visual adaptation task. Participants were asked to respond to each object as “man-made” or “not man-made” by pressing a corresponding keyboard button.
During the classification task, participants were presented with pictures of 140 common objects, 70 were studied in the first phase of the experiment and 70 were new (see Figure 1). Immediate repetition (1–3 times) of both studied and new objects were inter-mixed. For each trial, a fixation cross was also presented to allow participants an opportunity to blink (see Figure 1b). Participants were asked to categorize each object as “man-made” or “not man-made” by pressing a key on the keyboard. Key assignment was counterbalanced across participants. Each object stimulus was presented for 1000 ms and the inter-stimulus interval (ISI) lasted between 1100–1900 ms (M = 1500 ms). Fixations were presented for 1500 ms. The task was completed in about 35 minutes.
2.3 ERP recordings
EEGs were recorded from 64 scalp sites using Ag/AgCL electrodes embedded in an elastic cap at locations designed to cover the scalp. Two additional channels were used for monitoring horizontal and vertical eye movements. An electrode placed between Cz and CPz served as a reference. ERP responses were later re-referenced offline to the average of the right and left mastoid potentials. Electrode impedances did not exceed 5 Ώ. EEG signals were filtered with a bandpass of 0.05~40 Hz and sampled at a rate of 500 Hz. Average ERPs were formed offline from all trials and were free of ocular and movement artifacts (>±75μV). Each averaging epoch lasted 900 ms with an additional 100 ms recorded prior to stimulus onset to allow for baseline correction.
2.4 Statistical analyses
Behavioral effects included mean response times (RTs) for correct responses. ERPs were averaged across correct responses elicited by each condition during the test phase of the task. ERP mean peak latency data were gathered for LPC (latency of the highest positive amplitude 300–800 ms) (Picton et al., 2000). The present report focuses on the ERP LPC mean amplitude data gathered at time segments 400–600, 600–800, and 800–900 ms post-stimulus onset for each condition. Due to space limitations, results of the frontal negative-going FN400 related to ‘old-new’ effect will be reported elsewhere. To examine group effects in relation to repetition and study type, mixed four-way analyses of variance (ANOVA) were conducted for each dependent variable (i.e., RTs, each ERP latency and amplitude measure). For each sensation seeking group (low and high sensation seekers) we evaluated object type (new, studied), repetition (first, second, and third presentation), and electrode sites (FPz, Fz, FCz, Cz, CPz, Pz, POz, Oz; for ERP analyses). The significance level was set at 0.05, and Bonferroni correction for pairwise comparisons was used when appropriate. Greenhouse-Geisser corrections were reported with all effects having two or more degrees of freedom in the numerator.
2.5 Source analyses
In order to localize the source of the ERP responses, supplemental analyses were conducted for all ERP waves. We used the sLORETA method (standard low resolution electromagnetic tomography, via Curry v5.0) for localizing electrical activity in the brain using a Laplacian model term that measures the second derivative of source strengths (Anderer et al., 1998). Current density reconstructions (CDRs) assume simultaneous activity at a large number of possible source locations. Prior results have shown that LORETA produces blurred but accurate localizations of point sources in other visual processing paradigms (e.g. Pascual-Marqui et al., 2002; Guo et al., 2007; Jiang et al., 2008). The procedure used a realistic volume conductor model derived from a boundary element method with skin (10 mm), skull (9 mm), and brain (7 mm) layers, using conductivities of 0.3300, 0.0042, and 0.3300 μV, respectively.
3. Results
3.1. Behavioral results
Response time data revealed an expected main effect of repetition, F(2,64) = 245.18, P < 0.001. Reaction time for all participants decreased from the initial presentation of an object to its second and third presentations. An interaction between prior learning and repetition was also significant, F (2, 64) = 5.13, P = 0.01. Reaction times for studied objects decreased steadily with each repeated presentation. (Figure 2).
Figure 2.

High (solid line) and low (dashed line) sensation seekers’ reaction times for new and studied objects as a function of stimulus presentation. The left panel presents performances with new objects, while the right panel presents performances for studied objects. The largest group difference is found for new objects presented for the first time. The results also show that high sensation seekers respond faster towards these items than low sensation seekers. (Error bars represent standard error).
3.2. ERP results
3.2.1. LPC latency
Figure 3 presents ERP responses to new and studied objects in both high and low sensation seekers as a function of time following stimulus presentation. For LPC peak latency, a main effect of Group, F(1,32) = 5.162, P < 0.05, and an interaction between Group and Electrode, F(7,224) = 7.68, P < 0.001, were found. Peak LPC latencies were shorter for low (M = 502.89 ms) than high (M = 533.11 ms) sensation seekers, but only at frontal sites (i.e., FPz, Fz, FCz).
Figure 3.
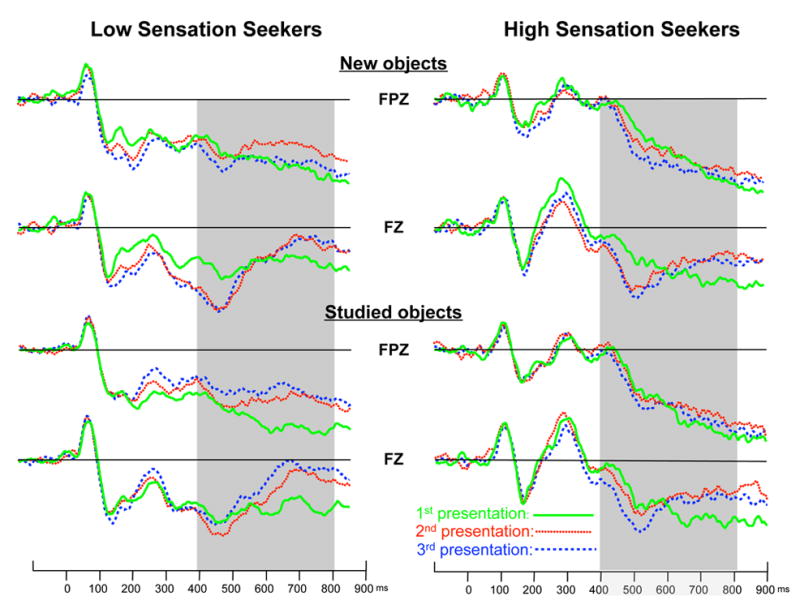
ERP responses to new and studied objects in both high and low sensation seekers as a function of electrode placement, time following stimulus presentation, and stimulus repetition. The ERP responses (LPC) reduced with repetition of a stimulus among the low sensation seekers, i.e. a clear adaptation process in LSS, but remained constant or no adaptation among the high sensation seeking group.
3.2.2. LPC adaptation
ANOVAs were conducted to test the mean amplitude at 400–600, 600–800, and 800–900 ms intervals. The 4-way interactions between group, study type, repetition, and electrode were significant only for the intervals of 400–600 [F (14,448) = 2.41, P < 0.05] and 600–800 ms [F (14,448) = 2.45, P < 0.05]. Simple effects analyses revealed the same effects for both time intervals. At frontal sites, low sensation seekers had larger LPC responses for studied than new objects during the initial presentation, no amplitude difference between studied and new objects during the second presentation, and larger positive amplitude for new than studied objects during the third presentation. In contrast, LPC responses did not vary across the three presentations for high sensation seekers or across the object type (see Figure 3). These data demonstrate that high and low sensation seekers show different LPC responses to new and old repeated objects. That is, low sensation seekers are more sensitive to repetition of previously seen objects.
3.2.3. Correlations and regressions
Differences between high and low sensation seekers may relate to one or more components of the multidimensional sensation seeking personality trait. To explore this issue, we examined the relationship between ERP LPC components and scores on the four subscales of the SSS Form V.
Since we found group differences in frontal electrode sites with repetition, it was assumed that the adaptation process of all presentations rather than the first presentation was a better indicator of experience seeking or response to boredom. Thus we examined the correlations between SSS subscale scores and LPC latency and amplitudes of all repetitions in the Fz, FPz and FCz. The overall LPC mean amplitudes, however, did not correlate with any of the subscales. Interestingly, we found a significant correlation of LPC latency (pooled repetitions) of frontal electrodes and the boredom susceptibility score. Table 1 indicates that frontal LPC latency of all repetitions (Fz, FCz, and FPz) was significantly correlated with the experience seeking (ES) and boredom susceptibility (BS) scales. The overall LPC mean amplitudes, however, did not correlate with any of the subscales. Table 1 provides Pearson correlations between frontal LPC responses/LPC latencies and scores of each of the four subscales (Table 1), as well as providing beta weights from a simultaneous regression which controls for the overlap among subscales.
Table 1.
Pearson Correlations (n=34)
| Relations between SSS subscales and LPC Latency (300–800 ms) | ||||||
|---|---|---|---|---|---|---|
| FPz_all | Fz_all | FCz_all | ||||
| r | β | r | β | r | β | |
| Experience Seeking | 0.404* | 0.356† | 0.385* | 0.213 | 0.200 | 0.066 |
| Thrill & Adventure Seeking | 0.039 | −0.204 | 0.278 | 0.061 | 0.211 | 0.094 |
| Boredom Susceptability | 0.318 | 0.226 | 0.610** | 0.563* | 0.435* | 0.431* |
| Disinhibition | 0.230 | 0.090 | 0.255 | −0.110 | 0.145 | −0.119 |
Significant at the 0.07 level;
significant at the 0.05 level;
significant at the 0.01 level (2-tailed).
For each site (FPz, Fz, and FCz), the first column presents zero-order correlations and the second column presents standardized regression coefficients from a simultaneous analysis.
The correlations obtained from Pearson correlations, which assumes normal distribution of the testing scores, at levels of P < 0.05 and P < 0.01 remained significant even by using the more conservative Spearman correlation, which does not assume normal distribution of the testing scores.
In order to further examine the predictive specificity of the subscales, three simultaneous regressions were conducted. LPC latency of FPz, Fz, and FCz, collapsed across stimuli, was regressed onto the four subscales of the SSS. Proportions of variance accounted for in the LPC latency were substantial; R2s equaled 0.23, 0.41, and 0.20 for sites FPz, Fz, and FCz respectively. For site FPz, experience seeking (ES) was the only scale significantly related to LPC latency. The standardized coefficient for experience seeking was moderate in size and 1.5 times larger than the next largest coefficient; ES accounted for an additional 10% of the variance above and beyond the other subscales (semi-partial r = 0.317). For site Fz, boredom susceptibility (BS) was the only significant predictor with a large effect size, more than 2.5 times larger than the next highest effect size. BS accounted for an additional 17% of the variance above and beyond the other three subscales (semi-partial r = 0.488). For site FCz, BS was again the sole predictor of LPC latency with a moderate to large effect size, which was more than 3.5 times larger than next highest coefficient; BS accounted for an additional 14% of the variance above and beyond the other subscales (semi-partial r = 0.373).
3.2.4. Lack of prefrontal involvement in high sensation seekers
To localize the source of LPC responses of low and high sensation seeking, an intracranial source analysis was calculated for the time point with the maximal signal strength as estimated by mean global field power. The LORETA method yields images of standardized current density associated with EEG responses. The source localization used the 444–500ms window because the current distribution peaked at this range. In contrast, ERP amplitude analysis used voltage of ERP responses as measure. Nevertheless, the localization of 444–500 ms falls in the range of LPC. The source localization analysis (LORETA) indicated that during the adaptation to visual stimuli, both groups showed posterior activation in the visual cortices. This LPC activation occurred predominantly in the right hemisphere, particularly in the right temporal and parietal cortices. Interestingly, low sensation seekers also revealed a frontal source in the right pre-frontal cortex that is absent in high sensation seekers (Figure 5).
Figure 5.
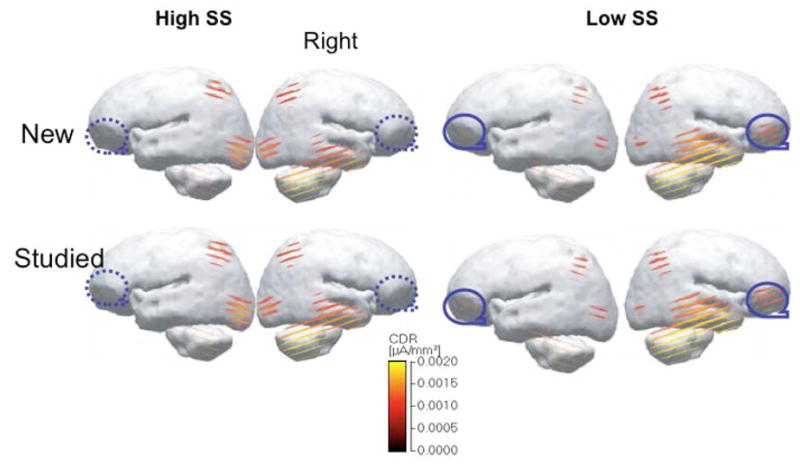
Frontal activity of low (LSS) and high (HSS) sensation seekers during repeated visual experience (see circled area). Images are low-resolution current density reconstructions (CDRs) based on the LORETA model using a color scale for CDRs as a source of designated time points from 444–500 ms, which revealed the largest group differences in ERP adaptation.
4. Discussion
To examine neural correlates of the repeated presentation of new and previously studied visual items as a function of sensation seeking status, we measured behavioral and ERP responses during repeated visual stimulus exposure among high and low sensation seekers, as defined by self-reported responses on a validated sensation seeking personality scale. Frontal LPC is related to repetition of visual stimuli or ‘new stimuli’ in both recognition memory tasks and in implicit familiarity tasks (e.g., Rugg, 1990; Paller, 2001; Curran and Friedman, 2004; Gold et al., 2005; Paller et al., 2007; Rugg and Curran, 2007; Guo et al, 2007). The LPC has been found to habituate rather quickly (Friedman and Simpson, 1994), particularly among high sensation seekers (Fjell et al., 2007). Results from the present study demonstrated that frontal LPC effects were not solely task-related; rather, these neural effects were observed in the context of non-task related adaptation in both high and low sensation seeking groups. When the new and studied visual stimuli were presented repeatedly, ERPs of high sensation seekers were less sensitive to repetition than those of low sensation seekers, perhaps reflecting more rapid adaptation to repeated images among high sensation seekers.
To explore the basis of this difference, we further analyzed correlations between ERPs and scores on sensation seeking subscales. Among subscales (i.e., experience seeking, thrill and adventure seeking, boredom susceptibility, and disinhibition) the most significant correlation was found between latency of frontal LPC and boredom susceptibility (BS, figure 4). High BS scores reflect a person’s tendency to be bored quickly. Based on these self-reports, repeated experience is not their natural tendency. On the other hand, low sensation seeking individuals tend to enjoy repetitions of a familiar experience. They feel that “there are some movies I enjoy seeing a second or even third time,” and “I enjoy spending time in the familiar surroundings of home.” Self-report scores on the boredom susceptibility subscale were a good predictor of frontal ERP response latency. Individuals who scored high on boredom susceptibility (easily bored) showed delayed frontal LPC responses during repeated visual exposure. It is noteworthy that scores on the thrill and adventure seeking (TAS) subscale did not correlate with visual adaptation. Miller et al. (2007) recently found that TAS was the best indicator of a more narrowly defined sensation seeking construct. However, ES, DIS, and BS are more complex, representing blends of multiple impulsivity-related traits—lack of premeditation, narrow sensation seeking, and urgency (a negative affect-related domain). It should be noted that recent results have also suggested a relationship between components of sensation seeking and brain structure (Martin et al., 2007). Pascalis et al. (2004) reported that high impulsivity subjects, compared to those with low impulsivity, showed longer LPC latencies, which is consistent with the current results that individuals who are seeking new experience and easily bored have delayed LPC latency at frontal sites. Similarly, Joseph et al. (2008) also reported longer delays in fMRI responses to emotional visual images among high sensation seekers compared to the low sensation seekers in the mid-frontal region.
Figure 4.

Frontal LPC (mean latencies) as a function of boredom susceptibility in high and low sensation seekers and the associated correlation coefficient (r = 0.61; P < 0.01).
The LORETA source localization revealed that only the low sensation seekers engaged the frontal cortex during visual adaptation. Because the LORETA inverse source solutions are located on the surface of a glass brain, the depth of the true sources is not uniquely defined. We suspect that the brain regions involved are the orbital frontal and anterior cingulate. In the recent investigation of fMRI responses to emotional images, Joseph et al. (2008) reported that low sensation seekers showed greater activation to high arousal stimuli in brain regions involved in emotional regulation, i.e. medial orbitofrontal and anterior cingulate cortices. These regions have also been associated with reward, evaluation of good and bad, and emotional decision making (Bechara, 2005). Furthermore, primate studies have provided evidence that neuronal activity in the orbitofrontal cortex (OFC) reflect the importance of reward information in different contexts and time periods (Simmons &Richmond, 2007). Alternatively, it is also possible that the frontal responses reflect the inhibitory process or frontal regulation during the classification task. Increased ERPs among low sensation seekers might be linked to the stronger effort to suppress the distraction by new objects. High-sensation seekers, on the other hand, did not demonstrate frontal region activation during adaptation.
To summarize, the frontal LPC showed distinct ERP response profiles with the repetition of a stimulus among the low and high sensation seeker groups. Furthermore, frontal LPC latency and mean ERP responses during repeated visual exposure were highly correlated with personality scores, most significantly with boredom susceptibility. Interestingly, source localization analysis (LORETA) indicated that during the adaptation of visual stimuli the left frontal cortex showed the strongest activation in low sensation seekers. We provide evidence that the individual differences in boredom susceptibility and experience seeking is strongly linked to the brain responses during adaptation to repeated visual exposure.
At the methodological level, the current results support the idea that adaptation of ERP responses, in comparison to absolute ERP amplitude, can be a better indicator of response to repeated experience. Frontal LPC latency was found to be strongly associated with boredom susceptibility. Correlation results indicated that close to 40% of the variance in scores on the boredom susceptibility subscale could be accounted for by ERP responses from frontal electrodes. This result provides support for a neurobiological basis of boredom susceptibility. Finally, our LORETA result of enhanced activation in left prefrontal cortex among low sensation seekers associated with repeated presentation of studied items may reflect functional differences associated with adaptation of previously seen stimuli in these individuals. The present results provide additional evidence that individual differences in response to repeated visual stimuli may have a biological basis that is associated with the personality dimensions of sensation seeking.
Acknowledgments
Parts of the results were presented at 15th annual meeting of Society of Prevention Research.
This research was sponsored by the National Institutes of Health P50 DA05312 and AG00986.
We thank T. Vagnini and K. Bylica for their assistance in data collection; M. Bardo, R.L. Donohew, H. Nolan, and A. Schoenfeld for their helpful comments.
Footnotes
Publisher's Disclaimer: This is a PDF file of an unedited manuscript that has been accepted for publication. As a service to our customers we are providing this early version of the manuscript. The manuscript will undergo copyediting, typesetting, and review of the resulting proof before it is published in its final citable form. Please note that during the production process errors may be discovered which could affect the content, and all legal disclaimers that apply to the journal pertain.
References
- Anderer P, Pascual-Marqui RD, Semlitsch HV, Saletu B. Differential effects of normal aging on sources of standard N1, target N1 and target P300 auditory event-related brain potentials revealed by low resolution electromagnetic tomography (LORETA) Evoked Potentials-Electroencephalography and Clinical Neurophysiology. 1998;108:160–174. doi: 10.1016/s0168-5597(97)00080-4. [DOI] [PubMed] [Google Scholar]
- Bardo MT, Donohew RL, Harrington NG. Psychobiology of novelty seeking and drug seeking behavior. Behavioural Brain Research. 1996;77:23–43. doi: 10.1016/0166-4328(95)00203-0. [DOI] [PubMed] [Google Scholar]
- Bentin S, McCarthy G. The effects of immediate stimulus repetition on reaction time and event-related potentials in tasks of different complexity. Journal of Experimental Psychology—Learning, Memory, and Cognition. 1994;20:130–149. [Google Scholar]
- Bentley P, Vuilleumier P, Thiel CM, Driver J, Dolan RJ. Effects of attention and emotion on repetition priming and their modulation by cholinergic enhancement. Journal of Neurophysiology. 2003;90:1171–1181. doi: 10.1152/jn.00776.2002. [DOI] [PubMed] [Google Scholar]
- Bechara A. Decision making, impulse control and loss of willpower to resist drugs: a neurocognitive perspective. Nature Neuroscience. 2005;8:1458–1463. doi: 10.1038/nn1584. [DOI] [PubMed] [Google Scholar]
- Brocke B, Beauducel A, Tasche K. Biopsychological bases and behavioral correlates of sensation seeking: characteristics in the intensity dependence of auditory evoked potentials. Personality and Individual Differences. 1999;26:1103–1123. [Google Scholar]
- Cloninger CR, Przybeck TR, Svrakic DM. The tridimensional personality questionnaire: U.S. normative data. Psychology Reports. 1991;69:1047–1057. doi: 10.2466/pr0.1991.69.3.1047. [DOI] [PubMed] [Google Scholar]
- Curran T, Friedman WJ. ERP old/new effects at different retention intervals in recency discrimination tasks. Cognitive Brain Research. 2004;18:107–120. doi: 10.1016/j.cogbrainres.2003.09.006. [DOI] [PubMed] [Google Scholar]
- Desimone R. Neural mechanisms for visual memory and their role in attention. The Proceedings of the National Academy of Sciences USA. 1996;93:13494–13499. doi: 10.1073/pnas.93.24.13494. [DOI] [PMC free article] [PubMed] [Google Scholar]
- Fjell AM, Aker M, Bang KH, Bardal J, Frogner H, Gangas OS, Otnes A, Sonderland NM, Wisloff AK, Walhovd KB. Habituation of P3a and P3b brain potentials in men engaged in extreme sports. Biological Psychology. 2007;75:87–94. doi: 10.1016/j.biopsycho.2006.12.004. [DOI] [PubMed] [Google Scholar]
- Friedman D, Simpson GV. ERP amplitude and scalp distribution to target and novel events: effects of temporal order in young, middle aged and older adults. Cognitive Brain Research. 1994;2:49–63. doi: 10.1016/0926-6410(94)90020-5. [DOI] [PubMed] [Google Scholar]
- Gold BT, Balota DA, Kirchhoff BA, Buckner RL. Common and dissociable activation patterns associated with controlled semantic and phonological processing: Evidence from fMRI adaptation. Cerebral Cortex. 2005;15:1438–1450. doi: 10.1093/cercor/bhi024. [DOI] [PubMed] [Google Scholar]
- Gonsalves BD, Kahn I, Curran T, Norman KA, Wagner AD. Memory strength and repetition suppression: multimodal imaging of medial temporal cortical contributions to recognition. Neuron. 2005;47:751–761. doi: 10.1016/j.neuron.2005.07.013. [DOI] [PubMed] [Google Scholar]
- Grill-Spector K, Henson R, Martin A. Repetition and the brain: Neural models of stimulus-specific effects. Trends in Cognitive Sciences. 2006;10:14–23. doi: 10.1016/j.tics.2005.11.006. [DOI] [PubMed] [Google Scholar]
- Guillem F, Pampoulova T, Stip E, Todorov C, Lalonde P. Are there common mechanisms in sensation seeking and reality distortion in schizophrenia? A study using memory event-related potentials. Psychiatry Research. 2005;135:11–33. doi: 10.1016/j.psychres.2004.11.008. [DOI] [PubMed] [Google Scholar]
- Guo CY, Lawson A, Jiang Y. Two distinct neural mechanisms of repetition priming. Neuroscience. 2007;149:747–759. doi: 10.1016/j.neuroscience.2007.07.060. [DOI] [PMC free article] [PubMed] [Google Scholar]
- Hansenne M. P300 and personality: an investigation with the Cloninger’s model. Biological Psychology. 1999;50:143–155. doi: 10.1016/s0301-0511(99)00008-3. [DOI] [PubMed] [Google Scholar]
- Harrington NG, Lane DR, Donohew L, Zimmerman RS, Norling GR, An JH, Cheah WH, McClure L, Buckingham T, Garofalo E, Bevins CC. Persuasive strategies for effective anti-drug messages. Communication Monographs. 2003;70:16–38. [Google Scholar]
- Henson R. Neuroimaging studies of priming. Progress in Neurobiology. 2003;70:53–81. doi: 10.1016/s0301-0082(03)00086-8. [DOI] [PubMed] [Google Scholar]
- Hoyle RH, Stephenson MT, Palmgreen P, Lorch EP, Donohew RL. Reliability and validity of a brief measure of sensation seeking. Personality and Individual Differences. 2002;32:401–414. [Google Scholar]
- Jenkins AC, Macrae CN, Mitchell JP. Repetition suppression of ventromedial prefrontal activity during judgments of self and others. Proceedings of the National Academy of Sciences of the United States of America. 2008;105:4507–4512. doi: 10.1073/pnas.0708785105. [DOI] [PMC free article] [PubMed] [Google Scholar]
- Jiang Y, Haxby JV, Martin A, Ungerleider LG, Parasuraman R. Complementary neural mechanisms for tracking items in human working memory. Science. 2000;287:643–646. doi: 10.1126/science.287.5453.643. [DOI] [PubMed] [Google Scholar]
- Jiang Y, Nönnig N, Hopf JM, Düzel E, Heinze HJ, Schoenfeld MA. Spatial-temporal analysis of binding 3D shape perception. Journal of Cognitive Neuroscience. 2008;20:553–562. doi: 10.1162/jocn.2008.20050. [DOI] [PMC free article] [PubMed] [Google Scholar]
- Joseph J, Liu X, Jiang Y, Lynam D, Kelly TH. Enhanced emotional reactivity in high sensation seekers: Evidence from functional magnetic resonance imaging. 2008 manuscript under review. [Google Scholar]
- Kok A. On the utility of P3 amplitude as a measure of processing capacity. Psychophysiology. 2001;38:557–577. doi: 10.1017/s0048577201990559. [DOI] [PubMed] [Google Scholar]
- Lawson AL, Guo C, Jiang Y. Age effects on brain activity during repetition priming of targets and distracters. Neuropsychologia. 2007;45:1223–1231. doi: 10.1016/j.neuropsychologia.2006.10.014. [DOI] [PMC free article] [PubMed] [Google Scholar]
- Martin SB, Covell DJ, Joseph JE, Chebrolu H, Smith CD, Kelly T, Jiang Y, Gold BT. Human novelty seeking correlates with hippocampus volume: convergent evidence from manual tracing and voxel-based morphometry. Neuropsychologia. 2007;45:2874–2881. doi: 10.1016/j.neuropsychologia.2007.05.009. [DOI] [PMC free article] [PubMed] [Google Scholar]
- Matsumoto K, Yamazaki H, Nakamura M, Sakai H, Miura N, Kato T, Miwa S, Ueno T, Saito H, Matsuoka H. Reduced word-repetition effect in the event-related potentials of thought-disordered patients with schizophrenia. Psychiatry Research. 2005;134:225–231. doi: 10.1016/j.psychres.2004.03.013. [DOI] [PubMed] [Google Scholar]
- Matthews G, Desmond PA. Personality and multiple dimensions of task-induced fatigue: a study of simulated driving. Personality and Individual Differences. 1998;25:443–458. [Google Scholar]
- Mecklinger A. Electrophysiological Measures of Familiarity Memory. Clinical EEG and Neuroscience. 2006;37:292–299. doi: 10.1177/155005940603700406. [DOI] [PubMed] [Google Scholar]
- McLellan AT, Kushner H, Metzger D, Peters R, Smith I, Grisson G, Pettinati H, Argeriou M. The fifth edition of the Addiction Severity Index: Cautions, additions and normative data. Journal of Substance Abuse Treatment. 1992;9:461–480. doi: 10.1016/0740-5472(92)90062-s. [DOI] [PubMed] [Google Scholar]
- Miller DJ, Lynam D, Kelley TH, Bardo MT. The Multifaceted Nature of Impulsive Sensation-Seeking: Differential Relations with Personality, Deviance, and Laboratory Tasks. 2007 under review. [Google Scholar]
- Oldfield RC. The assessment and analysis of handedness: The Edinburgh Inventory. Neuropsychologia. 1971;9:97–113. doi: 10.1016/0028-3932(71)90067-4. [DOI] [PubMed] [Google Scholar]
- Olichney JM, Iragui VJ, Salmon DP, Riggins BR, Morris SK, Kutas M. Absent event-related potentials (ERP) word repetition effects in mild Alzheimer’s disease. Clinical Neurophysiology. 2006;117:1319–30. doi: 10.1016/j.clinph.2006.02.022. [DOI] [PMC free article] [PubMed] [Google Scholar]
- Paller KA. Neurocognitive foundations of human memory. In: Medin DL, editor. The Psychology of Learning and Motivation. Vol. 40. Academic Press; San Diego: 2001. [Google Scholar]
- Paller AK, Voss LJ, Boehm GS. Validating neural correlates of familiarity. Trends in Cognitive Sciences. 2007;11:243–250. doi: 10.1016/j.tics.2007.04.002. [DOI] [PubMed] [Google Scholar]
- Pascalis V, De Strippoli E, Riccardi P, Vergari F. Personality, event-related potential (ERP) and heart rate (HR) in emotional word processing. Personality and Individual Differences. 2004;36:873–891. [Google Scholar]
- Pascual-Marqui RD, Esslen M, Kochi K, Lehmann D. Functional imaging with low resolution brain electromagnetic tomography (LORETA): review, new comparisons, and new validation. Japanese Journal of Clinical Neurophysiology. 2002;30:81–94. [PubMed] [Google Scholar]
- Picton WT, Bentin S, Berg P, Donchin E, Hillyard AS, Johnson R, Jr, Miller AG, Ritter W, Ruchkin SD, Rugg DM, Taylor JM. Guidelines for using human event-related potentials to study cognition: recording standards and publication criteria. Psychophysiology. 2000;37:127–152. [PubMed] [Google Scholar]
- Pierson A, Houezecm JL, Fossaert A, Dubal S, Jouvent R. Frontal reactivity and sensation seeking an ERP study in skydivers. Progressions in Neuro-Psychopharmacology and Biological Psychiatry. 1999;23:447–463. doi: 10.1016/s0278-5846(99)00008-1. [DOI] [PubMed] [Google Scholar]
- Roberti JW. A review of behavioral and biological correlates of sensation seeking. Journal of Research in Personality. 2004;38:256–279. [Google Scholar]
- Roberti JW, Storch EA, Bravata E. Further psychometric support for the sensation seeking scale—Form V. Journal of Personality Assessment. 2003;81:291–292. doi: 10.1207/S15327752JPA8103_12. [DOI] [PubMed] [Google Scholar]
- Rugg MD. Event-related brain potentials dissociate repetition effects of high- and low-frequency words. Memory and Cognition. 1990;18:367–379. doi: 10.3758/bf03197126. [DOI] [PubMed] [Google Scholar]
- Rugg MD, Nagy ME. Lexical contribution to nonword-repetition effects: Evidence from event-related potentials. Memory and Cognition. 1987;15:473–481. doi: 10.3758/bf03198381. [DOI] [PubMed] [Google Scholar]
- Rugg MD, Curran T. Event-related potentials and recognition memory. Trends in Cognitive Sciences. 2007;11:251–257. doi: 10.1016/j.tics.2007.04.004. [DOI] [PubMed] [Google Scholar]
- Selzer ML, Vinokur A, Van Rooijen L. A self-administered Short Michigan Alcoholism Screening Test (SMAST) Journal of Studies on Alcohol. 1975;36:117–126. doi: 10.15288/jsa.1975.36.117. [DOI] [PubMed] [Google Scholar]
- Simmons JM, Richmond BJ. Dynamic Changes in Representations of Preceding and Upcoming Reward in Monkey Orbitofrontal Cortex. Cerebral Cortex. 2007;18:93–103. doi: 10.1093/cercor/bhm034. [DOI] [PubMed] [Google Scholar]
- Snodgrass JG, Vanderwart M. A standardized set of 260 pictures: Norms for name agreement, image agreement, familiarity, and visual complexity. Journal of Experimental Psychology: Human Learning and Memory. 1980;6:174–215. doi: 10.1037//0278-7393.6.2.174. [DOI] [PubMed] [Google Scholar]
- Thiffault P, Bergeron J. Fatigue and individual difference in monotonous simulated driving. Personality and Individual Differences. 2003;34:159–176. [Google Scholar]
- Wang W, Wang YH. Sensation seeking correlates of passive auditory P3 to a single stimulus. Neuropsychologia. 2001;39:1188–1193. doi: 10.1016/s0028-3932(01)00051-3. [DOI] [PubMed] [Google Scholar]
- Wiggs CL, Martin A. Properties and mechanisms of perceptual priming. Current Opinion in Neurobiology. 1998;8:227–233. doi: 10.1016/s0959-4388(98)80144-x. [DOI] [PubMed] [Google Scholar]
- Yi DJ, Chun MM. Attentional modulation of learning-related repetition attenuation effects in human parahippocampal cortex. Journal of Neuroscience. 2005;25:3593–3600. doi: 10.1523/JNEUROSCI.4677-04.2005. [DOI] [PMC free article] [PubMed] [Google Scholar]
- Zhang XL, Begleiter H, Porjesz B. Do chronic alcoholics have intact implicit memory? An ERP study. Electroencephalography and Clinical Neurophysiology. 1997;103:457–473. doi: 10.1016/s0013-4694(97)00044-8. [DOI] [PubMed] [Google Scholar]
- Zuckerman M. Behavioral expressions and biosocial bases of sensation seeking. Cambridge University Press; Cambridge, Massachusetts: 1994. [Google Scholar]
- Zuckerman M. Psychobiology of personality. Cambridge University Press; Cambridge, Massachusetts: 2005. [Google Scholar]
- Zuckerman M, Murtaugh TT, Siegel J. Sensation seeking and cortical augmenting reducing. Psychophysiology. 1974;11:535–42. doi: 10.1111/j.1469-8986.1974.tb01109.x. [DOI] [PubMed] [Google Scholar]
- Zuckerman M, Eysenck SB, Eysenck HJ. Sensation seeking in England and America: cross-cultural, age, and sex comparisons. Journal of Consulting and Clinical Psychology. 1978;46:139–149. doi: 10.1037//0022-006x.46.1.139. [DOI] [PubMed] [Google Scholar]