

Abstract
Background
Mortality among patients with heart failure (HF) is high. Though individual biomarkers have been investigated to determine their value in mortality risk prediction, the role of a multimarker strategy requires further evaluation.
Methods and Results
Olmsted County residents presenting with HF from July 2004 to September 2007 were recruited to undergo biomarker measurement. We investigated whether addition of C-reactive protein (CRP), B-type natriuretic peptide (BNP), and troponin T (TnT) to a model including established risk indicators improved 1-year mortality risk prediction using the c statistic, integrated discrimination improvement (IDI), and net reclassification improvement (NRI). Among 593 participants, the mean age was 76.4 years and 48% were men. After 1 year follow-up, 122 (20.6%) participants had died. Patients with CRP (<11.8mg/L), BNP (<350pg/mL), and TnT (≤0.01ng/mL) below the median had low 1-year mortality (3.3%), while those with two or three biomarkers above the median had markedly increased mortality (30.8% and 35.5%, respectively). The addition of two or more biomarkers to the model offered greater improvement in 1-year mortality risk prediction than use of a single biomarker. The combination of CRP and BNP resulted in an increase in the c statistic from 0.757 to 0.810 (p<0.001), an IDI gain of 7.1% (p<0.001), and a NRI of 22.1% (p<0.001). Use of all three biomarkers offered no incremental gain (IDI gain 0.7% vs. CRP+BNP, p=0.065).
Conclusions
Biomarkers improved 1-year mortality risk prediction beyond established indicators. The use of a two-biomarker combination was superior to a single biomarker in risk prediction, though addition of a third biomarker conferred no added benefit.
Keywords: epidemiology, heart failure, prognosis, inflammation, community
Clinical Significance.
Heart failure (HF) portends a high mortality. The ability to accurately risk stratify HF patients is important to aggressively treat patients at highest risk and improve their outcomes. Elevated biomarker levels have been associated with increased mortality in HF, and have been of particular interest for risk prediction. We investigated whether a multimarker strategy incorporating C-reactive protein (CRP), B-type natriuretic peptide (BNP), and troponin T (TnT) would improve mortality risk prediction beyond traditional risk indicators in a large community cohort of HF patients. As the number of elevated biomarkers per patient increased, so did the observed 1-year mortality rate. The use of a two-biomarker combination to aid in mortality risk prediction was better than a single biomarker, but the use of a third biomarker conferred no additional benefit. The combination of CRP and BNP was associated with the greatest improvement in risk prediction of the two-biomarker combinations. Measurement of selected biomarkers in patients with HF improved the ability to risk stratify these patients, and effective strategies are needed to improve outcomes among HF patients at highest risk of death.
Introduction
According to the ACC/AHA 2008 update, an estimated 5.3 million Americans are currently living with heart failure (HF)1. Despite advances in HF treatment, mortality remains high, with estimated 5-year mortality rates of nearly 50% in the community2,3. This persistently high mortality underscores the importance of risk stratification in HF. While clinical characteristics have historically been investigated to predict mortality risk in HF4, they fail to fully estimate an individual’s prognosis. Recently, elevated biomarker levels, including C-reactive protein (CRP), B-type natriuretic peptide (BNP), and troponins, have been reported individually to be associated with an increased risk of death in HF patients5-15. Indeed CRP, BNP, and troponins, which reflect distinct patho-physiological mechanisms, i.e. inflammation, cardiac stress, and myocyte injury, may improve mortality prediction in HF beyond traditional risk indicators. Incorporation of a multimarker strategy to aid in risk prediction in HF may enhance the ability to accurately identify patients at high mortality risk, information which could be of critical use in clinical decision-making for both patients and providers.
The methodological requirements for cardiovascular risk prediction using biomarkers have undergone several new developments, as outlined in the recent American Heart Association (AHA) Scientific Statement16. It is now recognized that reporting a statistically significant association of a new biomarker with an outcome is not enough to demonstrate its value in risk prediction16,17. In addition, it has been recently suggested that the c statistic, determined from receiver-operating characteristic (ROC) analyses, “may not be optimal in assessing models that predict future risk”18, and should not be the sole determinant of clinical utility19. Novel measures of predictive ability, including use of reclassification tables and the integrated discrimination improvement (IDI), have been proposed to evaluate biomarker utility in risk prediction17. While individual biomarkers should be assessed using these novel methods, use of a multimarker strategy would likely result in greater improvement in risk prediction.
The critical importance of the evaluation of a set of markers in a prospective cohort of HF patients to determine their role in risk prediction has been recently underscored20. The present study aims to address these important gaps in knowledge by examining the distribution of CRP, BNP, and troponin T (TnT), their association with 1-year mortality, and the incremental and complementary benefits in 1-year mortality risk prediction conferred by a multi-marker approach. To optimize the applicability of our results, we will do so in a community cohort using novel statistical methods.
Methods
Study design
This is a population-based study conducted in Olmsted County in southeastern Minnesota (2006 U.S. Census population 137521, 90% Caucasian, 50% female). This type of research is possible in Olmsted County as all providers, including Mayo Clinic, have maintained extensively indexed medical records. Through the Rochester Epidemiology Project, a centralized record linkage system, all medical records are retrievable such that medical information on events is complete and easily searchable for persons living in the county 21.
Patient Population
To identify potential HF cases, natural language processing of the electronic medical record text is utilized. After a clinical visit, documentation is transcribed and appears in the record within 24 hours, making prompt ascertainment of newly diagnosed HF cases possible. Records of potential cases are reviewed by trained abstractors to collect data and verify HF cases using Framingham criteria22. Patients are contacted to obtain consent for study participation, which involves Doppler echocardiography and obtaining venous blood samples. Hospitalized patients are contacted in the hospital, and patients recruited from a clinical setting are contacted at their next clinic visit for consent, enrollment and data collection. All patients provided written authorization to participate in the study, which was approved by the Mayo Clinic Institutional Review Board.
Data Collection
Echocardiography
All echocardiograms were obtained and analyzed at Mayo Clinic Echocardiography laboratory according to the American Society of Echocardiography guidelines23. Left ventricular ejection fraction (EF) was measured using M-mode, quantitative, and semi-quantitative methods as previously described and validated24 with excellent correlation between methods. Though EF was dichotomized (reduced <50%, preserved ≥50%25) for descriptive purposes, it was examined as a continuous variable in all analyses. Diastolic function was assessed by an approach which integrates Doppler measurements of the mitral inflow and Doppler tissue imaging of the mitral annulus using the medial annulus velocity, a method similar to that used in the Olmsted County general population26. In the study, diastolic function was dichotomized as grade 3 or 4 (moderate or severe diastolic dysfunction) vs. normal/mild diastolic dysfunction/indeterminate.
Biomarker Measurements
Serum samples obtained from patients at the time of HF diagnosis were stored at -70C until laboratory testing was performed. Patients enrolled in the inpatient setting had biomarkers collected as soon as possible after admission. CRP was measured using a latex-enhanced immunoturbidimetric assay on a Hitachi 912 automated analyzer (Hitachi Ltd, Fukushima, Japan) and Diasorin reagents (Stillwater, Minnesota). BNP was measured by a 2-site immunoenzymatic sandwich assay on the DxI 800 automated immunoassay system (Beckman Instruments, Chaska, MN). TnT was measured using a sandwich electrochemiluminescence immunoassay on the Elecsys 2010 (Roche Diagnostic Corp, Indianapolis, IN). Tests were performed by blinded laboratory personnel in the Immunochemical Core Laboratory of Mayo Clinic.
Additional Patient Data
Baseline patient characteristics were obtained by nurse abstractors from the medical record. Prior myocardial infarction was defined by standardized criteria, which have been previously described and validated27. Physician’s diagnosis was used to document history of coronary artery disease (CAD), malignancy, hyperlipidemia, diabetes, and atrial fibrillation/flutter. Hypertension was defined as systolic blood pressure >140mmHg, diastolic blood pressure >90mmHg, or use of anti-hypertensive medications28. Smoking status was classified as ‘ever’ or ‘never’. Patient height and weight at HF diagnosis were used to calculate body mass index (BMI). Creatinine at HF diagnosis was collected and creatinine clearance was calculated using the Cockcroft-Gault equation29. New York Heart Association (NYHA) functional class was assessed using standard definitions. Medication use was defined according to physician documentation.
Mortality Follow-up
Follow-up took place through passive surveillance of the medical records. The ascertainment of death included death certificates filed in Olmsted County, obituary notices and electronic files of death certificates obtained from the State of Minnesota Department of Vital and Health Statistics, and use of the National Death Index21.
Statistical Analysis
Subjects were divided by median CRP(<11.8mg/L, ≥11.8mg/L), BNP (<350pg/mL, ≥350pg/mL), and TnT (≤0.01ng/mL, >0.01ng/mL). Baseline characteristics are reported as frequency or mean with standard deviation. Associations between baseline characteristics and biomarkers (dichotomized at the median) were analyzed using t tests for continuous variables and χ2 tests for categorical variables. All biomarkers followed a skewed distribution, and were log transformed when used as continuous variables. Data were >95% complete for all variables.
The incremental and complementary value of CRP, BNP, and TnT in predicting 1-year mortality was assessed by multiple methods. First, a 1-year mortality risk prediction model incorporating established risk factors was determined using logistic regression analysis. Potential predictors were chosen based on prior literature. Variables were included in the final base model if they were significant univariate predictors of 1-year mortality in the present study and included age, BMI, creatinine clearance, NYHA functional class, serum sodium <135mmol/L, and SBP. As we were limited by our sample size and one-year mortality rate as to the number of predictors that could be included, sensitivity analyses including additional baseline variables, did not improve the predictive ability of the base model (change in c statistic <0.005 for each variable). The resultant 1-year mortality risk prediction model served as the base model for further analyses. Next, we plotted ROC curves using models before and after the addition of biomarkers. The c statistic, a measure of area under the ROC curve, was calculated before and after the addition of biomarkers and significance determined by methods previously described30. Then, the IDI, a novel method for evaluating improvement in risk discrimination (a measure of how well a model separates those dead at 1 year from those alive) proposed by Pencina et al17, was assessed. The IDI measures the change in the difference in the mean predicted probabilities of death between those dead and alive at 1 year after inclusion of biomarkers in the model (a greater difference reflects a better model). Finally, the improvement in risk classification was assessed using event-specific reclassification tables 17. Predicted probabilities for 1-year mortality for each patient were determined using the base model. Patients were reclassified according to the 1-year predicted probabilities of death (<10%, 10 to <30%, ≥30%) after addition of biomarkers to the model. The net reclassification improvement (NRI) was determined by assessing net improvement in risk classification (higher predicted risk in subjects dead at 1 year, lower predicted risk in subjects alive at 1 year). A p value <0.05 was used as the level of significance. Analyses were performed using SAS 9.1 (SAS Institute Inc., Cary, NC). The authors had full access to the data and take responsibility for its integrity. All authors have read and agree to the manuscript as written.
Results
Patient Population
598 patients with HF were enrolled from July 2004 through September 2007, reflecting a 71% consent rate. Follow-up was complete through March 2009. Five patients were excluded as all biomarkers could not be measured, resulting in 593 participants included in analysis. The mean age of participants was 76 years, 284 (47.9%) were male, and 302 (53.5%) had preserved EF. 417 (70.3%) patients were enrolled as inpatients, with the remainder enrolled in the outpatient setting. Those who consented to the study were slightly younger than non-participants (mean 76 vs. 80 years, p<0.001). No differences in sex or the proportion enrolled as inpatients were observed among participants vs. non-participants.
Biomarker Levels
CRP ranged from 0.28 to 459mg/L with a median value of 11.8 mg/L (25th -75th percentile 3.7-50.6mg/L). BNP ranged from 5.5 to 6434.0pg/mL with a median value of 350.0pg/mL (25th-75th percentile 174.0-647.0pg/mL). TnT ranged from <0.01 to 8.6ng/mL with a median value of 0.01ng/mL (25th-75th percentile 0.01-0.05ng/mL). Persons with higher CRP, BNP, and TnT were more likely to have certain baseline characteristics, as shown in Table 1. Participants enrolled in the inpatient setting had higher biomarker levels than those enrolled as outpatients.
Table 1.
Baseline Characteristics
| Overall (n=593) |
CRP <11.8mg/L (n=296) |
CRP ≥11.8mg/L (n=297) |
BNP <350 pg/mL (n=299) |
BNP ≥350 pg/mL (n=294) |
TnT ≤0.01ng/mL (n=319) |
TnT >0.01ng/mL (n=274) |
|
|---|---|---|---|---|---|---|---|
| Age (years) | 76.4 (12.8) | 75.8 (13.3) | 77.0 (12.2) | 74.6 (13.1) | 78.2 (12.3)‡ | 75.7 (13.1) | 77.1 (12.4) |
| Male | 284 (47.9) | 141 (47.6) | 143 (48.1) | 140 (46.8) | 144 (49.0) | 134 (42.0) | 150 (54.7)† |
| Inpatient at Enrollment | 417 (70.3) | 158 (53.4) | 259 (87.2)‡ | 197 (65.9) | 220 (74.8)* | 198 (62.1) | 219 (79.9)‡ |
| Hypertension | 470 (79.3) | 231 (78.0) | 239 (80.5) | 235 (78.6) | 235 (79.9) | 249 (78.1) | 221 (80.7) |
| Hyperlipidemia | 403 (68.0) | 203 (68.6) | 200 (67.3) | 207 (69.2) | 196 (66.7) | 212 (66.5) | 191 (69.7) |
| Current smoker | 54 (9.1) | 27 (9.2) | 27 (9.1) | 28 (9.4) | 26 (8.9) | 28 (8.8) | 26 (9.5) |
| Diabetes | 186 (31.4) | 99 (33.4) | 87 (29.3) | 104 (34.8) | 82 (27.9) | 89 (27.9) | 97 (35.4)* |
| Coronary disease | 324 (54.6) | 168 (56.8) | 156 (52.5) | 162 (54.2) | 162 (55.1) | 171 (53.6) | 153 (55.8) |
| Myocardial infarction | 148 (25.9) | 73 (25.6) | 75 (26.2) | 66 (22.8) | 82 (29.2) | 73 (23.2) | 75 (29.3) |
| Atrial fibrillation | 181 (30.5) | 90 (30.4) | 91 (30.6) | 93 (31.1) | 88 (29.9) | 107 (33.5) | 74 (27.0) |
| History of Malignancy | 191 (32.3) | 80 (27.1) | 111 (37.4)† | 101 (33.8) | 90 (30.7) | 92 (28.8) | 99 (36.3) |
| Body mass index (kg/m2) | 30.2 (7.7) | 30.2 (8.0) | 30.3 (7.3) | 32.5 (8.3) | 27.9 (6.2)‡ | 30.2 (7.5) | 30.3 (7.9) |
| Creatinine clearance (ml/min) | 59.7 (33.9) | 60.9 (32.1) | 58.6 (35.6) | 69.5 (37.1) | 49.8 (27.0)‡ | 64.3 (32.0) | 54.5 (35.3)‡ |
| Sodium <135 mmol/L | 76 (12.8) | 23 (7.8) | 53 (17.8)† | 29 (9.7) | 47 (16.0)* | 37 (11.6) | 39 (14.2) |
| SBP (mm Hg) | 140.0 (31.8) | 138.8 (30.2) | 141.2 (33.3) | 142.0 (31.7) | 137.9 (31.8) | 141.1 (32.1) | 138.7 (31.4) |
| NYHA Functional Class III or IV | 421 (71.0) | 198 (66.9) | 223 (75.1)* | 196 (65.6) | 225 (76.5)† | 219 (68.7) | 202 (73.7) |
| Echocardiographic Characteristics | |||||||
| Ejection fraction (%) | 48.7 (16.4) | 46.3 (16.4) | 51.1 (16.2)‡ | 53.7 (14.1) | 43.5 (17.1)‡ | 50.3 (16.0) | 46.8 (16.8)* |
| Diastolic dysfunction Class 3/4 | 428 (75.8) | 213 (75.5) | 215 (76.0) | 216 (75.0) | 212 (76.5) | 227 (74.9) | 201 (76.7) |
| Medications Prior to Heart Failure Diagnosis | |||||||
| Beta blocker | 386 (65.1) | 194 (65.5) | 192 (64.6) | 197 (65.9) | 189 (64.3) | 221 (69.3) | 165 (60.2)* |
| ACE/ARB | 347 (58.5) | 181 (61.5) | 165 (55.6) | 175 (58.5) | 172 (58.5) | 195 (61.1) | 152 (55.5) |
| Statin | 302 (50.9) | 168 (56.8) | 134 (45.1)† | 152 (50.8) | 150 (51.0) | 163 (51.1) | 139 (50.7) |
Age, body mass index, hemoglobin, creatinine clearance, systolic blood pressure, and ejection fraction are given as mean (standard deviation).
All other values are given as frequency (%).
ACE= Angiotensin converting enzyme inhibitor; ARB= angiotensin II receptor blocker; BNP= B-type natriuretic peptide; CRP= C-reactive protein; NYHA= New York Heart Association; SBP= systolic blood pressure; TnT= troponin T
p<0.05 compared with patients with biomarker below the median
p<0.01 compared with patients with biomarker below the median
p<0.001 compared with patients with biomarker below the median
Biomarkers and Mortality
After 1 year, 122 (20.6%) patients had died. A graded increase in 1-year mortality was observed according to the number of biomarkers above the median overall, among those with preserved and reduced EF, and among those enrolled as inpatients and outpatients (Figure 1). Overall, patients with either two or three biomarkers above the median experienced a marked increase in mortality (30.8% and 35.5%, respectively) compared with patients with all biomarkers below the median (3.3%, p<0.001 for both comparisons). When one biomarker was above the median patients had intermediate 1-year mortality (13.6%). Factors related to 1-year mortality in the present study were included in a model with established risk factors (Base model, Table 2). Higher CRP, BNP, and TnT were independently associated with an increased risk of death when added to the base model. Sensitivity analyses conducted among those enrolled as inpatients yielded similar results.
Figure 1. Observed 1-year Mortality by Median Biomarker Level.
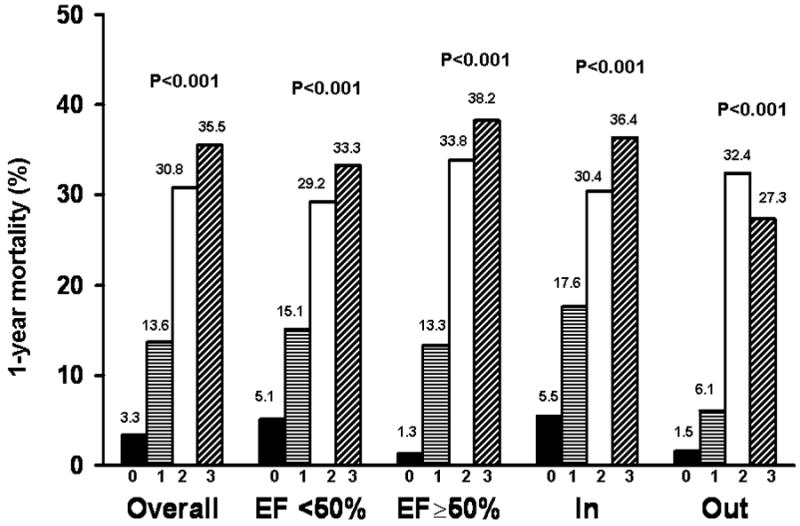
1-year mortality rates according to the number of biomarkers above the median level (0, 1, 2, 3) are shown overall, by ejection fraction, and by inpatient (In)/ outpatient (Out) status at enrollment.
Table 2.
Predictors of Mortality
| Univariate | Multivariate | |||||
|---|---|---|---|---|---|---|
| Variable | Odds ratio | 95% CI | P value | Odds ratio | 95% CI | P value |
| * Age (yrs) | 1.07 | 1.05-1.10 | <0.001 | 1.06 | 1.03-1.09 | <0.001 |
| * Body mass index (kg/m2) | 0.95 | 0.92-0.98 | <0.001 | 1.00 | 0.96-1.04 | 0.883 |
| * Creatinine clearance(ml/min) | 0.98 | 0.97-0.98 | <0.001 | 0.99 | 0.98-1.00 | 0.073 |
| NYHA Class 3 | 2.40 | 1.46-3.40 | <0.001 | 2.86 | 1.57-5.38 | <0.001 |
| NYHA Class 4 | 3.28 | 1.97-5.98 | 4.02 | 2.21-7.59 | ||
| Serum sodium <135 mmol/L | 2.12 | 1.24-3.57 | 0.007 | 1.77 | 0.98-3.15 | 0.058 |
| * SBP (mm Hg) | 0.99 | 0.99-1.00 | 0.033 | 0.99 | 0.98-1.00 | 0.010 |
| † Biomarkers entered as continuous predictors into model including established risk factors | ||||||
| CRP (mg/L) | 1.61 | 1.31-2.00 | <0.001 | 1.54 | 1.21-1.97 | <0.001 |
| BNP (pg/mL) | 2.26 | 1.77-2.93 | <0.001 | 1.92 | 1.42-2.63 | <0.001 |
| TnT (ng/mL) | 1.49 | 1.25-1.79 | <0.001 | 1.29 | 1.03-1.62 | 0.029 |
Odds ratios for continuous variables are given per 1-unit increase for age, body mass index, creatinine clearance, and SBP.
Biomarkers added to the base model (age, body mass index, creatinine clearance, New York Heart Association functional class, serum sodium <135, SBP) as continuous predictors (log transformed). Odds ratios and confidence intervals are expressed per standard deviation increase.
NYHA= New York Heart Association; CRP= C-reactive protein; BNP= B-type natriuretic peptide; SBP= systolic blood pressure; TnT= troponin T
Evaluating the Impact of Biomarkers on Risk Prediction Using Novel Methods
The value of each biomarker alone and in combination for risk prediction was assessed using several complementary methods. The c statistics for CRP, BNP, and TnT individually were 0.636, 0.698, and 0.652, respectively (p<0.001 for each). BNP had the highest c statistic of any single predictor evaluated, including age. The c statistic for the base model was 0.757.
Incremental Prognostic Value of a Single Biomarker
Addition of each biomarker individually to the base model resulted in a significant increase in the c statistic, IDI and NRI (Table 3), indicating that each biomarker offered value in predicting 1-year mortality beyond traditional prognostic factors.
Table 3.
Incremental Prognostic Value of Biomarkers: Summary of Findings
| Receiver Operating Characteristic Curve Analysis | Integrated Discrimination Improvement | Event-Specific Reclassification | ||||
|---|---|---|---|---|---|---|
| Model + Marker c statistic | * P value | IDI (%) | P value | NRI (%) | P value | |
| CRP | 0.782 | 0.012 | 2.8% | <0.001 | 10.7% | 0.030 |
| BNP | 0.789 | 0.005 | 4.3% | <0.001 | 16.2% | 0.003 |
| TnT | 0.780 | 0.023 | 3.2% | <0.001 | 11.5% | 0.006 |
| CRP + BNP | 0.810 | <0.001 | 7.1% | <0.001 | 22.1% | <0.001 |
| CRP+TnT | 0.797 | 0.001 | 4.7% | <0.001 | 16.5% | <0.001 |
| BNP+TnT | 0.799 | 0.002 | 6.0% | <0.001 | 18.4% | 0.001 |
| CRP+BNP+TnT | 0.815 | <0.001 | 7.8% | <0.001 | 26.9% | <0.001 |
P value compared with the model including established risk factors (age, body mass index, creatinine clearance, New York Heart Association functional class, serum sodium <135, and SBP) that has a c statistic of 0.757
IDI= integrated discrimination improvement;NRI= Net Reclassification Improvement; CRP= C-reactive protein; BNP= B-type natriuretic peptide; TnT= troponin T
Incremental Prognostic Value of Two or More Biomarkers
There was complementary prognostic value gained by adding combinations of biomarkers to the model. The best two-biomarker combination was CRP+BNP, which increased the c statistic from 0.757 to 0.810, increased the IDI by 7.1%, and improved risk classification for 22.1% of individuals (Tables 3 and 4). This offered a significant improvement over any of the single-biomarker models (IDI gain 2.8%, p<0.001, compared with base model +BNP). These data suggest that use of two biomarkers offer an increase in prognostic value over use of a single biomarker in 1-year mortality risk prediction, and the combination of CRP and BNP offered the greatest increase in risk discrimination.
Table 4.
Reclassification of Participants by 1-Year Mortality Status Using Model with CRP and BNP
| a Model with Established Risk Factors | a Model with Established Risk Factors, CRP and BNP | ||
|---|---|---|---|
| Frequency | <10% Risk | 10-30% Risk | ≥30% Risk |
| Participants dead at 1 year (n=122) | |||
| <10% Risk | 7 | 3 | 0 |
| 10-30% Risk | 4 | 25 | 22 |
| ≥30% Risk | 0 | 8 | 53 |
| Participants alive at 1 year (n=471) | |||
| <10% Risk | 151 | 19 | 0 |
| 10-30% Risk | 67 | 109 | 35 |
| ≥30% Risk | 5 | 36 | 49 |
Established risk factors include age, body mass index, creatinine clearance, New York Heart Association functional class, serum sodium <135, and SBP
CRP= C-reactive protein; BNP= B-type natriuretic peptide
The addition of a third biomarker to the model resulted in non-significant gains in risk discrimination and reclassification, including an increase in the c statistic to 0.815 (versus 0.809 for CRP+BNP), an improvement in risk classification for an additional 4.8% of individuals, and an additional 0.7% gain in the IDI (IDI 7.8% for all 3 biomarkers versus 7.1% for CRP+BNP, p=0.065).
Discussion
In this community cohort of HF patients with a wide range of EF and HF severity, higher levels of CRP, BNP, and TnT were associated with a large increase in mortality. While each biomarker provided individual incremental benefit in mortality risk prediction, combining biomarkers offered the greatest improvement in risk prediction above established risk factors. These findings provide novel data in support of the robust benefit of a multimarker strategy applied to community HF patients to predict death.
There is a strong rationale for risk prediction in HF. HF is a disease with an overall poor prognosis, with an observed 1-year mortality of 21% in the present study and an estimated 5-year mortality near 50% in prior community studies2,3. However, an individual’s mortality risk may vary substantially from average values, and use of prognostic variables to more accurately assess risk has been of recent interest. By more accurately identifying individuals at highest mortality risk, clinicians may be more effective at counseling patients, enabling them to make better informed decisions regarding use of medications and invasive procedures. In addition, closer monitoring of hospitalized patients and frequent outpatient follow-up may be possible. Risk assessment in a community population offers clear advantages over trial populations, as clinical trial participants are frequently younger with fewer comorbidities, and thus observed mortality may differ markedly from the general HF population. This underscores the importance of relying on community cohorts, such as the one reported on herein, to assess the ability of potential prognostic factors to enhance mortality risk prediction.
With the development of novel biomarkers, there has been interest in their use for risk prediction4,20. While an individual biomarker may aid in determining risk, use of a multimarker strategy is likely to provide greater benefit4. For example, a recent investigation aimed at predicting death among elderly patients free of cardiovascular disease found that no individual biomarker increased the c statistic when added separately to a model, but the combination of all biomarkers markedly increased the c statistic31. Though studies have reported on the prognostic value of individual biomarkers in HF, they often failed to report on their incremental value above established risk indicators, thereby obscuring their true prognostic significance. In addition, multimarker strategies in HF risk prediction are currently lacking.
Recently, substantial attention has been focused on the importance of following rigorous methodological steps in risk prediction analyses16-19,32. It is now recognized that reporting a statistically significant association of a new biomarker with the outcome is not enough to demonstrate its value in risk prediction17. While studies often report on the c statistic derived from ROC analyses, contemporary reports have highlighted the need for methods to establish utility in risk prediction that extend beyond the ROC curve18,19,32. The c statistic is less sensitive than other global measures of model fit, and does not capture an individual’s predicted risk which is ultimately important in determining clinical utility18. Newer methods, including use of reclassification tables and further methods of discrimination have been proposed17, and offer useful information regarding a biomarkers’ utility in risk prediction. These novel methods were evaluated in the present study.
CRP, BNP, and TnT have been reported to be associated with increased mortality in HF5,7-13 and are of interest in mortality risk prediction. CRP, a marker of inflammation, is produced in the liver in response to an inflammatory stimulus33. Inflammation clearly plays a key role in the pathogenesis of HF34. CRP has been demonstrated to be elevated in a large portion of HF patients compared with controls35 and in patients with both preserved and reduced EF7,35. BNP, one of three major natriuretic peptides, is released from the heart in response to pressure and volume overload, and acts to promote vasodilatation, natriuresis, and diuresis36,37. Elevated BNP levels have been used to diagnose HF38,39 and as a guide to therapy in established HF patients40. Finally, TnT, a marker of cardiomyocyte injury, has been reported to be detectable in a large portion of HF patients14, and elevations have been associated with an increased risk of death in both ambulatory15 and hospitalized HF patients13. Based on these data, we hypothesized that use of a multimarker strategy incorporating CRP, BNP, and TnT, biomarkers reflecting inflammation, cardiac stress, and myocyte injury in HF, may provide complementary benefit in risk prediction.
Herein, higher levels of CRP, BNP, and TnT are associated with a large increase in 1-year mortality in community HF patients. Patients with two or three biomarkers above the median value had markedly high 1-year mortality of 30.8% and 35.5%, respectively. In addition, CRP, BNP, and TnT were strong predictors of 1-year mortality. BNP had the highest c statistic (0.698) of any single predictor evaluated in the study, including age and NYHA functional class. The present findings also extend previous reports5-13 by underscoring that these biomarkers have added prognostic value above established risk indicators. Furthermore, the combined use of two or more biomarkers offers greater incremental value in risk prediction. The two-marker strategies including CRP and BNP performed slightly better than the other two-marker combinations by all methods evaluated. Use of the three-biomarker combination of CRP, BNP, and TnT did not offer significant incremental value in 1-year mortality risk prediction compared with the two-biomarker combination of CRP and BNP.
Limitations, Strengths, and Clinical Implications
Potential limitations should be acknowledged to aid in data interpretation. The present study had a relatively small number of deaths, limiting the number of predictors that could be included in the base model. However, the assessment of multiple biomarkers simultaneously in a large cohort of patients is a strength as it has been lacking from prior reports. Both inpatients and outpatients with HF were enrolled in our study to represent the comprehensive experience of a community by including the entire spectrum of HF as it presented in a geographically-defined population. While sample size issues precluded stratified analyses among outpatients alone, a stepwise increase in mortality according to the number of biomarkers elevated was observed in both inpatients and outpatients. It will be of interest to validate our findings in another cohort, particularly as our study population was primarily Caucasian.
The present study includes the application of rigorous methodology consistent with AHA recommendations16 to determine the incremental prognostic value of CRP, BNP and TnT in HF. The convergence of the results obtained by each risk prediction method assessed provides robust documentation of the incremental value of the multimarker strategy evaluated. As this cohort includes community patients with HF with both preserved and reduced EF, and a wide range of HF severity, the present results have, by design, a broad applicability and underscore the potential value of CRP, BNP and TnT to predict death in a wide variety of HF patients.
Conclusions
Higher levels of CRP, BNP, and TnT are strong, independent predictors of mortality in community HF patients. While each biomarker provides incremental prognostic value above established risk factors, the combined use of two or more biomarkers confers substantial improvement in the ability to predict death as assessed by several complementary risk prediction approaches. In particular, the two-biomarker combination of CRP and BNP was associated with the greatest increase in mortality risk prediction, and further inclusion of a third biomarker, TnT, did not confer significant incremental prognostic value. These results provide a strong rationale for the implementation of such a multimarker strategy in HF.
Acknowledgments
We would like to thank the following individuals for their support in data collection for the study: Ellen Koepsell RN and Kay Traverse RN. This study was funded by grants from the National Institute of Health and American Heart Association.
Funding Sources: The present study was supported by an NIH RO1 grant (HL 72405, Dr. Roger), an NIH Ruth L. Kirschstein National Research Service Award (T32 HL07111-31A1, Dr. Dunlay) and an American Heart Association Postdoctoral Fellowship Award (Dr. Dunlay)
Footnotes
Disclosures: None
Abstract presented as: A Multimarker Strategy for Risk Prediction in Heart Failure: Application of Novel Methods in a Community Cohort. American Heart Association 2008 Scientific Sessions, Elizabeth-Barrett Connor Award Finalist, Oral Presentation November 9, 2008. New Orleans, LA.
References
- 1.Association AH, editor. Heart Disease and Stroke Statistics 2008 Update. 2008. [Google Scholar]
- 2.Roger VL, Weston SA, Redfield MM, Hellermann-Homan JP, Killian J, Yawn BP, Jacobsen SJ. Trends in heart failure incidence and survival in a community-based population. Jama. 2004;292:344–50. doi: 10.1001/jama.292.3.344. [DOI] [PubMed] [Google Scholar]
- 3.Levy D, Kenchaiah S, Larson MG, Benjamin EJ, Kupka MJ, Ho KK, Murabito JM, Vasan RS. Long-term trends in the incidence of and survival with heart failure. N Engl J Med. 2002;347:1397–402. doi: 10.1056/NEJMoa020265. [DOI] [PubMed] [Google Scholar]
- 4.Fonarow GC. Epidemiology and risk stratification in acute heart failure. Am Heart J. 2008;155:200–7. doi: 10.1016/j.ahj.2006.10.043. [DOI] [PubMed] [Google Scholar]
- 5.Mueller C, Laule-Kilian K, Christ A, Brunner-La Rocca HP, Perruchoud AP. Inflammation and long-term mortality in acute congestive heart failure. Am Heart J. 2006;151:845–50. doi: 10.1016/j.ahj.2005.06.046. [DOI] [PubMed] [Google Scholar]
- 6.Windram JD, Loh PH, Rigby AS, Hanning I, Clark AL, Cleland JG. Relationship of high-sensitivity C-reactive protein to prognosis and other prognostic markers in outpatients with heart failure. Am Heart J. 2007;153:1048–55. doi: 10.1016/j.ahj.2007.03.044. [DOI] [PubMed] [Google Scholar]
- 7.Chirinos JA, Zambrano JP, Chakko S, Schob A, Veerani A, Perez GO, Mendez AJ. Usefulness of C-reactive protein as an independent predictor of death in patients with ischemic cardiomyopathy. Am J Cardiol. 2005;95:88–90. doi: 10.1016/j.amjcard.2004.08.065. [DOI] [PubMed] [Google Scholar]
- 8.Anand IS, Latini R, Florea VG, Kuskowski MA, Rector T, Masson S, Signorini S, Mocarelli P, Hester A, Glazer R, Cohn JN. C-reactive protein in heart failure: prognostic value and the effect of valsartan. Circulation. 2005;112:1428–34. doi: 10.1161/CIRCULATIONAHA.104.508465. [DOI] [PubMed] [Google Scholar]
- 9.Fonarow GC, Peacock WF, Phillips CO, Givertz MM, Lopatin M. Admission B-type natriuretic peptide levels and in-hospital mortality in acute decompensated heart failure. J Am Coll Cardiol. 2007;49:1943–50. doi: 10.1016/j.jacc.2007.02.037. [DOI] [PubMed] [Google Scholar]
- 10.Doust JA, Pietrzak E, Dobson A, Glasziou P. How well does B-type natriuretic peptide predict death and cardiac events in patients with heart failure: systematic review. Bmj. 2005;330:625. doi: 10.1136/bmj.330.7492.625. [DOI] [PMC free article] [PubMed] [Google Scholar]
- 11.Bettencourt P, Ferreira A, Dias P, Pimenta J, Frioes F, Martins L, Cerqueira-Gomes M. Predictors of prognosis in patients with stable mild to moderate heart failure. J Card Fail. 2000;6:306–13. doi: 10.1054/jcaf.2000.20558. [DOI] [PubMed] [Google Scholar]
- 12.You JJ, Austin PC, Alter DA, Ko DT, Tu JV. Relation between cardiac troponin I and mortality in acute decompensated heart failure. Am Heart J. 2007;153:462–70. doi: 10.1016/j.ahj.2007.01.027. [DOI] [PubMed] [Google Scholar]
- 13.Peacock WFt, De Marco T, Fonarow GC, Diercks D, Wynne J, Apple FS, Wu AH. Cardiac troponin and outcome in acute heart failure. N Engl J Med. 2008;358:2117–26. doi: 10.1056/NEJMoa0706824. [DOI] [PubMed] [Google Scholar]
- 14.Latini R, Masson S, Anand IS, Missov E, Carlson M, Vago T, Angelici L, Barlera S, Parrinello G, Maggioni AP, Tognoni G, Cohn JN. Prognostic value of very low plasma concentrations of troponin T in patients with stable chronic heart failure. Circulation. 2007;116:1242–9. doi: 10.1161/CIRCULATIONAHA.106.655076. [DOI] [PubMed] [Google Scholar]
- 15.Hudson MP, O’Connor CM, Gattis WA, Tasissa G, Hasselblad V, Holleman CM, Gaulden LH, Sedor F, Ohman EM. Implications of elevated cardiac troponin T in ambulatory patients with heart failure: a prospective analysis. Am Heart J. 2004;147:546–52. doi: 10.1016/j.ahj.2003.10.014. [DOI] [PubMed] [Google Scholar]
- 16.Hlatky MA, Greenland P, Arnett DK, Ballantyne CM, Criqui MH, Elkind MS, Go AS, Harrell FE, Jr, Howard BV, Howard VJ, Hsue PY, Kramer CM, McConnell JP, Normand SL, O’Donnell CJ, Smith SC, Jr, Wilson PW. Criteria for evaluation of novel markers of cardiovascular risk: a scientific statement from the American Heart Association. Circulation. 2009;119:2408–16. doi: 10.1161/CIRCULATIONAHA.109.192278. [DOI] [PMC free article] [PubMed] [Google Scholar]
- 17.Pencina MJ, D’Agostino RB, Sr, D’Agostino RB, Jr, Vasan RS. Evaluating the added predictive ability of a new marker: from area under the ROC curve to reclassification and beyond. Stat Med. 2008;27:157–72. doi: 10.1002/sim.2929. discussion 207-12. [DOI] [PubMed] [Google Scholar]
- 18.Cook NR. Use and misuse of the receiver operating characteristic curve in risk prediction. Circulation. 2007;115:928–35. doi: 10.1161/CIRCULATIONAHA.106.672402. [DOI] [PubMed] [Google Scholar]
- 19.Cook NR. Comments on ’Evaluating the added predictive ability of a new marker: From area under the ROC curve to reclassification and beyond’. In: Pencina MJ, et al., editors. Stat Med. Vol. 27. 2008. pp. 191–5. [DOI] [PubMed] [Google Scholar]
- 20.Braunwald E. Biomarkers in heart failure. N Engl J Med. 2008;358:2148–59. doi: 10.1056/NEJMra0800239. [DOI] [PubMed] [Google Scholar]
- 21.Melton LJ., 3rd History of the Rochester Epidemiology Project. Mayo Clin Proc. 1996;71:266–74. doi: 10.4065/71.3.266. [DOI] [PubMed] [Google Scholar]
- 22.Ho KK, Anderson KM, Kannel WB, Grossman W, Levy D. Survival after the onset of congestive heart failure in Framingham Heart Study subjects. Circulation. 1993;88:107–15. doi: 10.1161/01.cir.88.1.107. [DOI] [PubMed] [Google Scholar]
- 23.Lang RM, Bierig M, Devereux RB, Flachskampf FA, Foster E, Pellikka PA, Picard MH, Roman MJ, Seward J, Shanewise JS, Solomon SD, Spencer KT, Sutton MS, Stewart WJ. Recommendations for chamber quantification: a report from the American Society of Echocardiography’s Guidelines and Standards Committee and the Chamber Quantification Writing Group, developed in conjunction with the European Association of Echocardiography, a branch of the European Society of Cardiology. J Am Soc Echocardiogr. 2005;18:1440–63. doi: 10.1016/j.echo.2005.10.005. [DOI] [PubMed] [Google Scholar]
- 24.Amico AF, Lichtenberg GS, Reisner SA, Stone CK, Schwartz RG, Meltzer RS. Superiority of visual versus computerized echocardiographic estimation of radionuclide left ventricular ejection fraction. Am Heart J. 1989;118:1259–65. doi: 10.1016/0002-8703(89)90018-5. [DOI] [PubMed] [Google Scholar]
- 25.Owan TE, Hodge DO, Herges RM, Jacobsen SJ, Roger VL, Redfield MM. Trends in prevalence and outcome of heart failure with preserved ejection fraction. N Engl J Med. 2006;355:251–9. doi: 10.1056/NEJMoa052256. [DOI] [PubMed] [Google Scholar]
- 26.Redfield MM, Jacobsen SJ, Burnett JC, Jr, Mahoney DW, Bailey KR, Rodeheffer RJ. Burden of systolic and diastolic ventricular dysfunction in the community: appreciating the scope of the heart failure epidemic. Jama. 2003;289:194–202. doi: 10.1001/jama.289.2.194. [DOI] [PubMed] [Google Scholar]
- 27.Roger VL, Killian J, Henkel M, Weston SA, Goraya TY, Yawn BP, Kottke TE, Frye RL, Jacobsen SJ. Coronary disease surveillance in Olmsted County objectives and methodology. J Clin Epidemiol. 2002;55:593–601. doi: 10.1016/s0895-4356(02)00390-6. [DOI] [PubMed] [Google Scholar]
- 28.Chobanian AV, Bakris GL, Black HR, Cushman WC, Green LA, Izzo JL, Jr, Jones DW, Materson BJ, Oparil S, Wright JT, Jr, Roccella EJ. The Seventh Report of the Joint National Committee on Prevention, Detection, Evaluation, and Treatment of High Blood Pressure: the JNC 7 report. Jama. 2003;289:2560–72. doi: 10.1001/jama.289.19.2560. [DOI] [PubMed] [Google Scholar]
- 29.Cockroft DG, M H. Prediction of creatinine clearance from serum creatinine. Nephron. 1976;16:31–41. doi: 10.1159/000180580. [DOI] [PubMed] [Google Scholar]
- 30.Hanley JA, McNeil BJ. A method of comparing the areas under receiver operating characteristic curves derived from the same cases. Radiology. 1983;148:839–43. doi: 10.1148/radiology.148.3.6878708. [DOI] [PubMed] [Google Scholar]
- 31.Zethelius B, Berglund L, Sundstrom J, Ingelsson E, Basu S, Larsson A, Venge P, Arnlov J. Use of multiple biomarkers to improve the prediction of death from cardiovascular causes. N Engl J Med. 2008;358:2107–16. doi: 10.1056/NEJMoa0707064. [DOI] [PubMed] [Google Scholar]
- 32.Cook NR. Statistical evaluation of prognostic versus diagnostic models: beyond the ROC curve. Clin Chem. 2008;54:17–23. doi: 10.1373/clinchem.2007.096529. [DOI] [PubMed] [Google Scholar]
- 33.Anker SD, von Haehling S. Inflammatory mediators in chronic heart failure: an overview. Heart. 2004;90:464–70. doi: 10.1136/hrt.2002.007005. [DOI] [PMC free article] [PubMed] [Google Scholar]
- 34.Torre-Amione G. Immune activation in chronic heart failure. Am J Cardiol. 2005;95:3C–8C. doi: 10.1016/j.amjcard.2005.03.006. discussion 38C-40C. [DOI] [PubMed] [Google Scholar]
- 35.Michowitz Y, Arbel Y, Wexler D, Sheps D, Rogowski O, Shapira I, Berliner S, Keren G, George J, Roth A. Predictive value of high sensitivity CRP in patients with diastolic heart failure. Int J Cardiol. 2007 doi: 10.1016/j.ijcard.2007.02.037. [DOI] [PubMed] [Google Scholar]
- 36.Nakao K, Ogawa Y, Suga S, Imura H. Molecular biology and biochemistry of the natriuretic peptide system. II: Natriuretic peptide receptors. J Hypertens. 1992;10:1111–4. doi: 10.1097/00004872-199210000-00002. [DOI] [PubMed] [Google Scholar]
- 37.Daniels LB, Maisel AS. Natriuretic peptides. J Am Coll Cardiol. 2007;50:2357–68. doi: 10.1016/j.jacc.2007.09.021. [DOI] [PubMed] [Google Scholar]
- 38.Maisel AS, Krishnaswamy P, Nowak RM, McCord J, Hollander JE, Duc P, Omland T, Storrow AB, Abraham WT, Wu AH, Clopton P, Steg PG, Westheim A, Knudsen CW, Perez A, Kazanegra R, Herrmann HC, McCullough PA. Rapid measurement of B-type natriuretic peptide in the emergency diagnosis of heart failure. N Engl J Med. 2002;347:161–7. doi: 10.1056/NEJMoa020233. [DOI] [PubMed] [Google Scholar]
- 39.Mueller C, Scholer A, Laule-Kilian K, Martina B, Schindler C, Buser P, Pfisterer M, Perruchoud AP. Use of B-type natriuretic peptide in the evaluation and management of acute dyspnea. N Engl J Med. 2004;350:647–54. doi: 10.1056/NEJMoa031681. [DOI] [PubMed] [Google Scholar]
- 40.Jourdain P, Jondeau G, Funck F, Gueffet P, Le Helloco A, Donal E, Aupetit JF, Aumont MC, Galinier M, Eicher JC, Cohen-Solal A, Juilliere Y. Plasma brain natriuretic peptide-guided therapy to improve outcome in heart failure: the STARS-BNP Multicenter Study. J Am Coll Cardiol. 2007;49:1733–9. doi: 10.1016/j.jacc.2006.10.081. [DOI] [PubMed] [Google Scholar]