Abstract
The risk of bone fracture increases with age because of a variety of factors that include, among others, decreasing bone quantity and quality. Despite recent advances, the roles of bone microstructure and trace mineralization in the fracture process are not well understood. In this study, we utilize a combination of in-situ fracture toughness testing, digital strain mapping, and x-ray photoelectron spectroscopy techniques to characterize the near-tip strain field, fracture toughness, and chemical elements on the fracture surface of bone specimens from donors of two ages (48-year-old and 78-year-old females). We show that age-related embrittlement of bone fracture is associated with higher near-tip strains by lamellar shear and crack defection at lamellar interfaces in the young bone and their absence in the old bone. The different near-tip deformation behaviors may be associated with the presence of Si and Zn in the young bone but more Ca and P and the lack of Si and Zn in the old bone.
Keywords: cortical bone, fracture toughness, mineralization, bone quality, crack deflection
Introduction
Humans experience an age-related increase in the incidence of skeletal fractures that may be due to a variety of factors including reduced bone mineral density, impaired balance and reflexes, changes in bone geometry, porosity, architecture, and mineral and organic phases, as well as damage accumulation [1–5]. It is becoming increasingly evident that bone mass alone cannot account for changes in observed fracture risk and that measures of bone mass should be supplemented with measures of bone quality [6]. However, the mechanisms through which various measures of bone quality act to control bone mechanical properties and ultimately fracture risk are not well understood. Of particular interest is bone fracture toughness, which is a measure of the ability of bone tissue to resist initiation and propagation to failure of a crack. As a result, a mechanistic understanding of the bone quality and other factors that control crack initiation and growth process in bone tissue is important in developing a methodology for fracture prediction, particularly considering bone material and microstructural modifications resulting from pharmacological treatment, aging and disease processes.
Recent work has shown that cortical bone exhibits a resistance-curve fracture behavior that varies with age [7]. The development of microdamage and linear microcracks also changes with age and the mode of loading (tensile versus compression) [8]. Bridging of crack surfaces by uncracked ligaments occurs at several length scales, including one of a nanoscaled non-fibrous organic glue material found between mineralized collagen fibrils [9]. Despite these recent advances, the role of the bone microstructure, which is comprised of Haversian, lamellar and interstitial bone tissue, in affecting the local deformation and the fracture process is still poorly understood. In particular, it remains unclear how bone mineralization affects the crack growth process and the fracture resistance in bone. The aim of this article is to report recent results of fracture-resistance curves, crack-tip strain measurements, and the corresponding mineral content for cortical bone of two age groups that shed new light on the role of mineralization in the crack growth process and in understanding of the risk of bone fracture with aging. It should be noted that while this study is focused on cortical bone, cancellous bone is also prominently involved in many clinical fractures.
Materials and methods
Cortical bone from human femurs of two ages (48-year-old female and 78-year-old female) were studied. Throughout this paper, specimens from the 48-year-old donor will be designated as “young”, while those from the 78-year-old donor will be designated as “old”. Compact-tension specimens (n = 4 for young bone and n = 5 for old bone) were machined from the mid diaphysis. Briefly, two cuts approximately 10 mm apart were made transverse to the long axis of the femur approximately 25 mm below the lesser trochanter using a band saw while keeping the specimen wet under constant irrigation creating rings of cortical bone. The rings were then cut into quarters using the band saw. Using a mini-milling machine (Sherline, model 5400, Vista CA), specimens of dimensions of about 8.2 mm height (anatomical circumferential direction), 6.0 mm width (anatomical radial direction), and 1.96 mm thickness (anatomical longitudinal direction) were machined under constant irrigation to minimize damage due to specimen heating. The specimens were notched with a 0.5 mm thick slitting saw attached to the mini milling machine and precracked using a razor blade [10], resulting in a crack length of about 1.44 – 2.19 mm. The compact tension specimens were orientated such that the cracks propagated in the radial (R) direction normal to the loading direction in the circumferential (C) direction of the bone, which is often referred to as the C-R orientation [11]. All specimens were polished using an increasingly finer grit paper up to with a final polishing step using a 0.05 μm diamond slurry. Fracture toughness tests were conducted at ambient temperature under displacement-controlled conditions at a displacement rate of 0.001 mm/s using a custom-designed mechanical loading stage operated under a digital microscope (Keyence VHX-100, Osaka, Japan). The specimens were fully hydrated in physiological buffered saline solution prior to testing. During testing, the near-tip region of the compact-tension specimens was imaged using the digital microscope at each load step to document the cracking process, the amount of crack extension (Δa) and the crack path. After testing, the stress intensity factor (K) was computed using the standard K solutions for compact-tension specimens described in ASTM E399 [12].
The use of linear-elastic fracture mechanics for a porous material such as bone tissue can be justified on the basis of a recent analysis [13] that showed that the stress intensity factor parameter remains valid for an elastic material with voids. The stress intensity factor for a porous material is only slightly increased by the presence of porosity. The weak dependence is described by a coupling parameter that is a function of elastic properties of the unvoided materials and material constants used to describe the porosity field [13]. Unfortunately, the analysis [13] did not provide a simple relation between the stress intensity factor and the porosity level. Although the K solution for porous materials is still not fully developed, the recent analysis [13] supports the notion that applying the traditional stress intensity factor solution as described in the ASTM procedure [12] to porous materials is likely to be reasonably accurate.
Loaded and unloaded digital micrographs of the same crack-tip region were analyzed to obtain the near-tip displacement and strain fields using a digital strain mapping technique [14]. A t-test, assuming unequal variance (one-tail and two-tail) was used to compare the crack-initiation toughness, Ko, at the onset of crack growth, and the slope of the linear K vs. Δa curves for the two ages. Specimen porosity was computed from images taken at 100× total magnification using an image based methodology as described by Wang and Ni [15]. The porosity measurements included the Haversian canals, Volkmann canals, and lacunae. Osteon density was determined by counting the number of osteons per unit area of measure [16]. Using micrographs of the crack path meandering through the bone microstructure, the number of osteons exhibiting crack deflection and that of crack penetration were determined for individual specimens. The results were utilized to compute the relative frequencies of crack deflection by osteons observed in both young and old bone.
To gain insight on the mechanisms potentially related to bone quality responsible for preventing or hindering interlamellar shear in the old bone, the chemical elements present on the fracture surfaces of the young and old bone tissue were analyzed using X-ray photoelectron spectroscopy (XPS). X-ray photoelectrons spectroscopy, also known as electron spectroscopy for chemical analysis (ESCA) is a quantitative spectroscopic technique that measures the elemental composition, empirical formula, chemical state, and electronic state of the elements that exist within a material [17,18]. XPS spectra are obtained by irradiating a material with a beam of X-rays while simultaneously measuring the kinetic energy and the number of electrons that escape from the top 1 to 10 nm of the material being analyzed [17,18]. XPS analyses were performed on the fracture surfaces of the bone specimen at six different locations (n = 6) and at six different depths by varying the sputtering times. The six locations were randomly selected from the fracture surfaces of a single compact-tension specimen for each of the two ages. Since the X-ray beam sampled a circular area of 100 μm in diameter, each location was about 100 μm in diameter, and corresponded to the spot size of the X-ray beam. The spacing between two locations was about 1 mm apart. Optical microscopy was used to ensure the sampling area was not over a Haversian canal. The microstructural features (such as lamellar layers, interfaces, or sub-microned pores) within the 100 μm sampled area, unfortunately, could not be revealed using optical microscopy. XPS analysis of the surface was conducted with a PHI 5000 VersaProbe (Physical Electronics, Chanhassen, MN) equipped with an Al K-α X-ray radiation source. The X-ray takeoff angle was 45° and the spot size was about 100 μm. The survey scans were taken with an energy resolution of 1.5 eV using a source with power and current of 125 kW and 10 μA, respectively. Charge neutralization using a dual beam of low energy Ar+ ions and low energy electrons was used during data acquisition. Depth profiling was performed by sputtering using an Ar+ ion beam (5 kV beam energy, 3 μA beam current, 1 mm × 1 mm raster size) for 30 s in between each survey scan. Attempts were made to determine the sputtering depth as a function of time. For depth profiling, it was necessary to sputter for a known time and then measure the depth of the trench left behind. However, the effort was unsuccessful because the fracture surfaces were not flat and contained pores, so it was not possible to locate the bottom of the trench. A t-test assuming unequal variance was used to compare the mineral contents of the old and young bone tissues.
Results
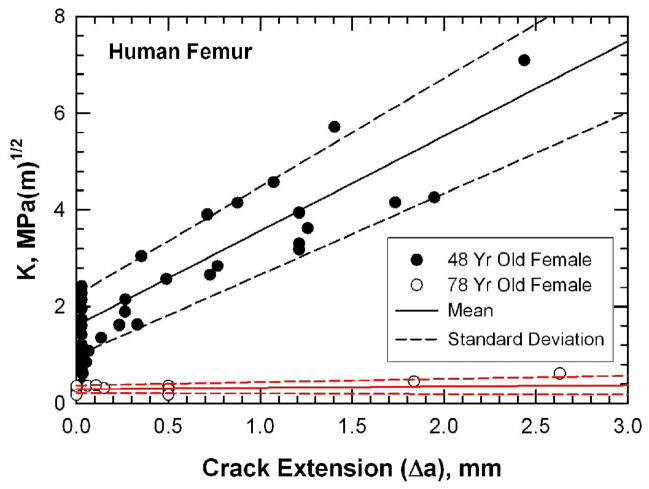
The crack-initiation toughness (Ko) and the slope of the K-Δa curve for the young and old bone are compared in Table 1. Both the Ko and the slope for the young bone are significantly higher than those of the old bone. Figure 1 compares the resistance curves for young bone (48-year-old female) and old bone (78-year-old female) in a plot of stress intensity, K, as a function of crack extension, Δa. The resistance-curve, or R-curve, is a measure of the crack-growth toughness of a material [19]. The K value at the onset of crack extension (Δa = 0) corresponds to the crack-initiation toughness, Ko. For a very brittle material, unstable fracture occurs once the K level exceeds Ko and the corresponding R-curve is flat with a zero slope. For a material exhibiting stable crack growth, the K value increases with increasing crack extensions after K exceeds Ko. The slope of the R-curve, therefore, can be viewed as a measure of the increase in material resistance against crack growth.
Table 1.
Comparison of crack-initiation toughness (Ko) at the onset of crack growth and the slope of linear K vs Δa curve for young (48-year-old) and old (78-year-old) bone. The specimen porosity is also given.
| 48-year-old female |
78-year-old female |
|||||||||
|---|---|---|---|---|---|---|---|---|---|---|
| Ko, MPa (m)1/2 |
slope, MPa (m)1/2/mm |
Porosity (%) |
Osteon Density (#/mm2) |
Crack- Deflection Osteons+ (%) |
Ko, MPa (m)1/2 |
slope, MPa (m)1/2/mm |
Porosity (%) |
Osteon Density (#/mm2) |
Crack- Deflection Osteons+ (%) |
|
| 1.07 | 1.85 | 15.23 | 4.64 | 50 | 0.34 | 0.026 | 18.51 | 4.85 | 0 | |
| 2.24 | 2.38 | 7.10 | 1.69 | 54 | 0.29 | 0 | 31.41 | 4.43 | 0 | |
| 2.05 | 1.76 | 12.98 | 3.80 | 76 | 0.18 | 0 | 21.63 | 4.32 | 0 | |
| 1.07 | 1.86 | 5.74 | 4.43 | 86 | 0.35 | 0.086 | 15.72 | 3.69 | 32 | |
| 0.4 | 0.041 | 11.39 | 4.43 | -- | ||||||
| Mean | 1.61* | 1.96* | 10.26* | 3.64 | 0.654* | 0.31* | 0.031* | 19.73* | 4.35 | 0.08* |
| (S.D.) | 0.625 | 0.283 | 4.6 | 1.35 | 0.164 | 0.083 | 0.036 | 7.53 | 0.42 | 0.167 |
This signifies a statistically significant difference (p < 0.05) between the means of the old and the young
Number of osteons exhibiting crack deflection normalized by total number of osteons along the crack path.
Figure 1.
K-resistance curves for human femur from donors of two ages (48- and 78-year-old female) tested at room temperature in air. Specimens were fully hydrated in physiologically buffered saline solution prior to testing. The mean and standard deviation of the crack-initiation toughness and the slope of the R-curves were obtained by averaging those of the individual specimens.
For the 48-year-old bone, the onset of crack growth occurs at an initiation toughness value of 1.61 ± 0.63 MPa(m)1/2. The K value increases with increasing crack extension with an average slope of 1.96 ± 0.28 MPa(m)1/2/mm. In contrast, the resistance curves for the old bone (78-year-old female) show little resistance to growth as consistent with previous studies [7,19]. The average initiation toughness is 0.31 ± 0.083 MPa(m)1/2 with a slope of about 0.031 ± 0.036 MPa(m)1/2/mm. Thus, the old bone is more susceptible to unstable brittle fracture in the C-R orientation than the young bone. The porosity of the young bone specimens was significantly lower than the old bone specimens while there was no difference in osteon numerical density, as shown in Table 1.
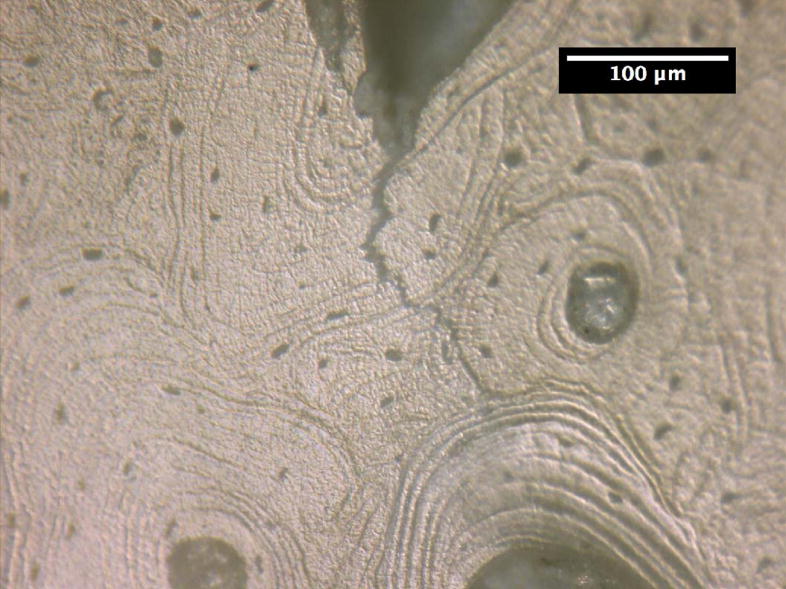
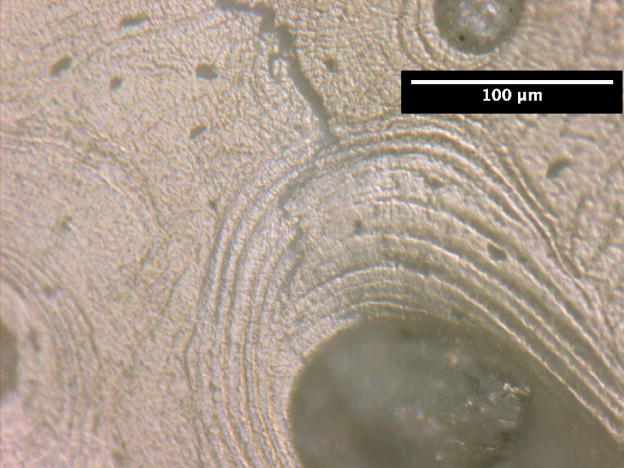
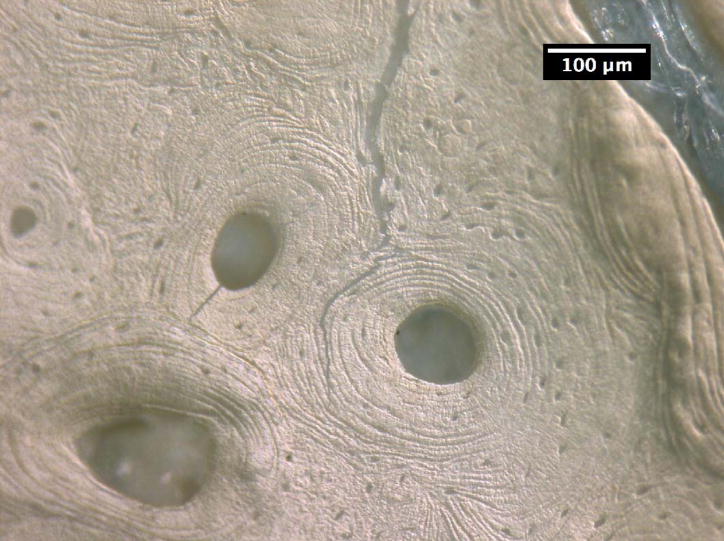
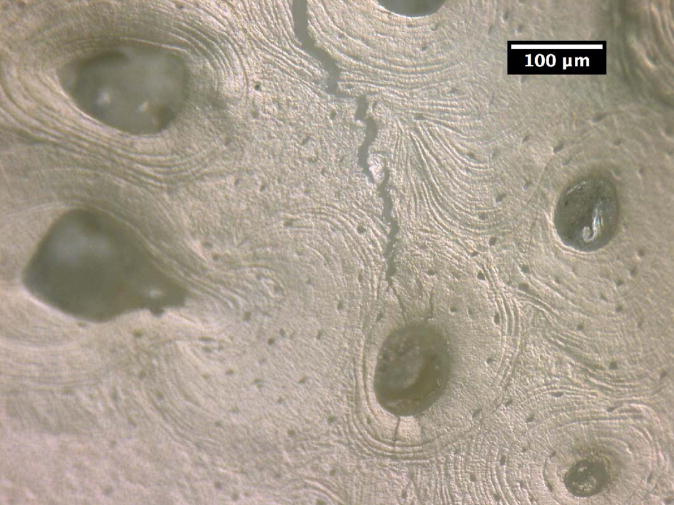
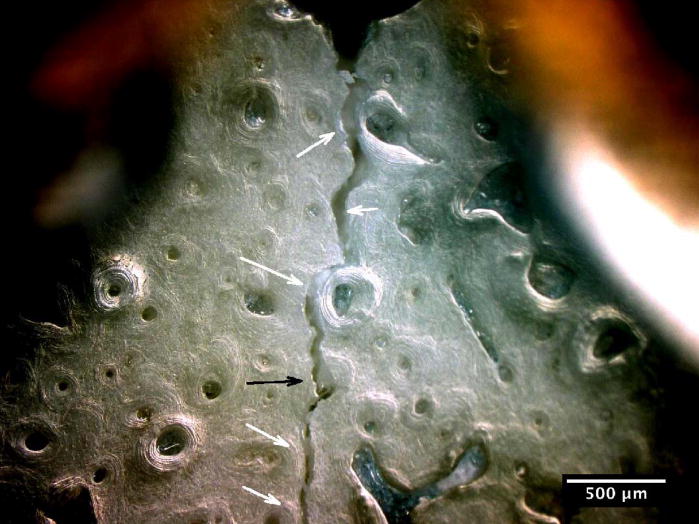
The crack growth processes in the young bone and old bone are summarized in Figures 2 and 3. In the young bone, crack extension occurs intermittently (i.e. the crack did not grow after each discrete loading step) and involves initiation of one or more microcracks connected by uncracked ligaments ahead of the main crack [7,19]. The main crack frequently arrests or deflects when it encounters an osteon, as shown in Figures 2(a) and (b), respectively. Crack extension through the several layers in an osteon is difficult and often results in a series of microcracks separated by uncracked ligaments, as illustrated in Figures 2(b). These microcracks eventually link together and the resulting crack deflects and propagates around individual osteons, producing a semi-circular crack path, Figure 2(c). However, some of the osteons are incapable of deflecting the incoming main crack, as shown in Figure 2(d) which shows the main crack penetrating through the interstitial lamellar bone and several layers within an osteon without altering its paths or producing uncracked ligaments.
Figure 2.
Crack growth mechanisms in young bone (48-year-old female): (a) crack arrest at an osteon, (b) crack growth through several lamellae layers in an osteon, (c) crack deflection around an osteon after traversing several lamellar layers within an osteon, and (d) crack penetration through interstitial lamellar bone and lamellar layers of an osteon without deflection.
Figure 3.
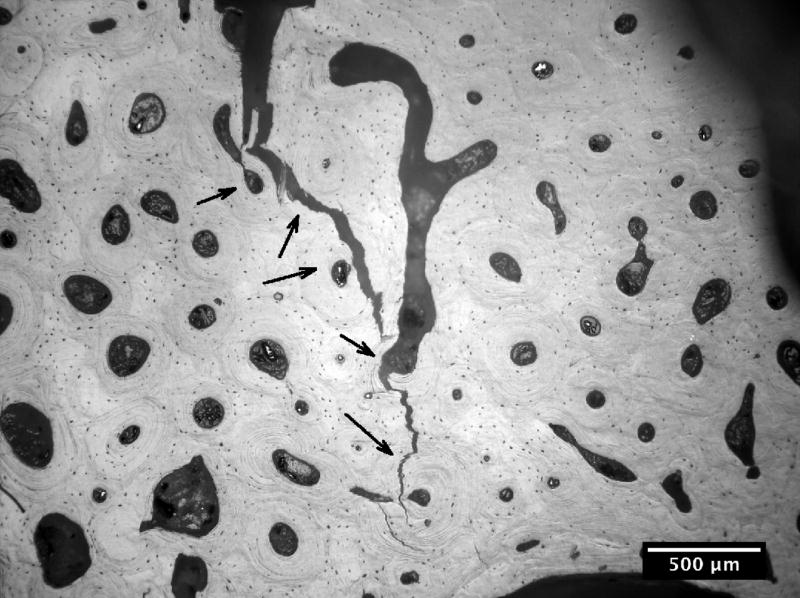
Crack path morphology in young and old bone: (a) in young bone (48-year-old female), a tortuous crack path is evident in which the crack deflects around several osteons (white arrows) and while propagating through one osteon (black arrow), and (b) in old bone (78-year-old female), the crack does not deflect around osteons but primarily propagates through osteons (black arrows).
The relative frequencies of crack deflection by osteons observed in the 48-year-old and the 78-year-old bone tissues are presented in Table 1. For young bone, 65.4% of the osteons exhibited crack deflection while only the remaining 34.6% manifested crack penetration. In contrast, only 8.3% of the osteons exhibited crack deflection while the remaining 91.7% of the osteons manifested crack penetration. Moreover, 100% crack penetration (i.e., 0% crack deflection) was observed in the osteons of the old-bone specimens that exhibited a slope of zero in the R-curve, as shown in Table 1.
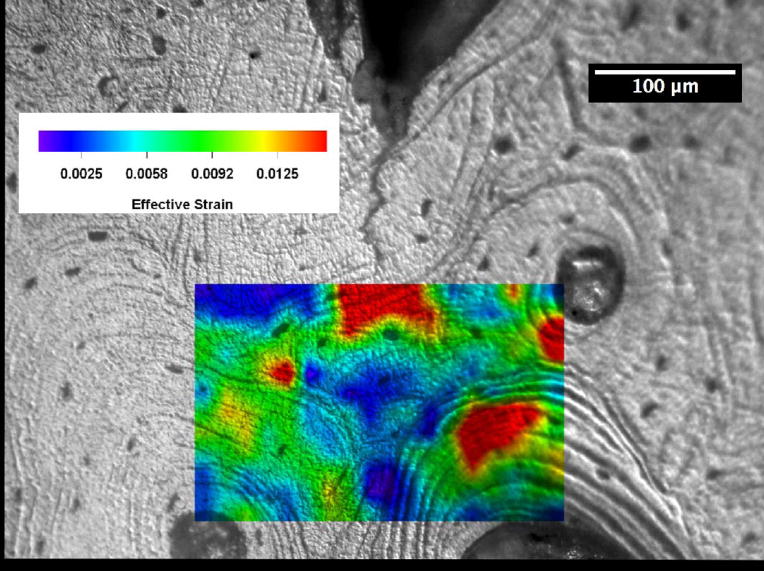
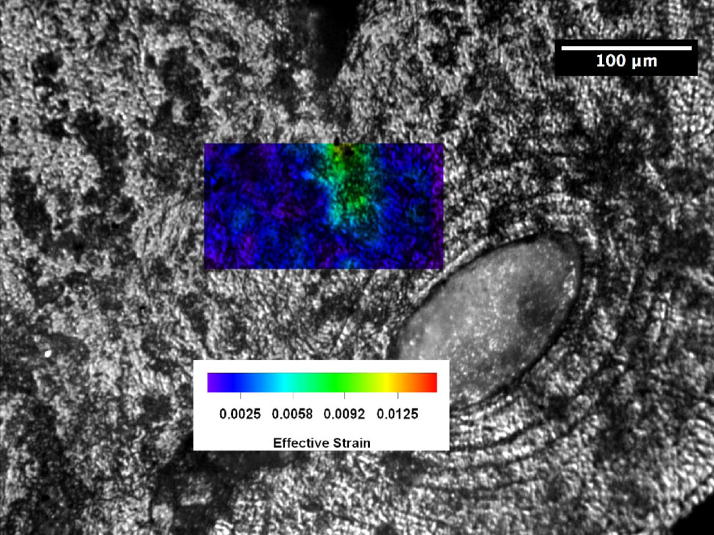
Crack-tip strain distributions were obtained for loaded cracks at various locations in the young and the old bone using a digital strain mapping technique [14]. A comparison of the near-tip effective strain distributions for cracks in the 48- and 78-year-old bone is presented in Figures 4(a) and (b) for identical specimen (macroscopic) K levels of 1 MPa(m)1/2, where effective strains are the von Mises effective strains computed on the basis of the measured strain components according to the expressions given by [14]
Figure 4.
Distributions of effective strains ahead of a crack tip in human femur at K = 1 MPa(m)1/2: (a) 48-year-old female, and (b) 78-year-old female.
| (1) |
where ε1 and ε2 are the principal strains. These principal strains were computed using the experimental measured normal strain and shear strain components at each of the grid points. The von Mises effective strain is a measure of the distortional deformation by shearing or a combination of extension and shearing. The contours for effective strains greater than 0.01 are shown in red in Figure 4. For the 48-year-old bone, a region of effective strain in excess of 0.01 exists in all three osteons located ahead of the crack tip. The bone tissue strain decreases with increasing distance ahead of the crack tip, but they appear to concentrate across the cement line boundaries or within the lamellae inside the osteons. The crack subsequently grew around the osteon on the right by following a cement line. In contrast, the effective strain in the specimen for the 78-year-old donor is comparatively low and an effective strain level of 0.01 does not occur anywhere ahead of the crack tip. Instead of fanning out from the crack tip as in the young bone, the principal strains in the old bone tend to concentrate at the crack tip.
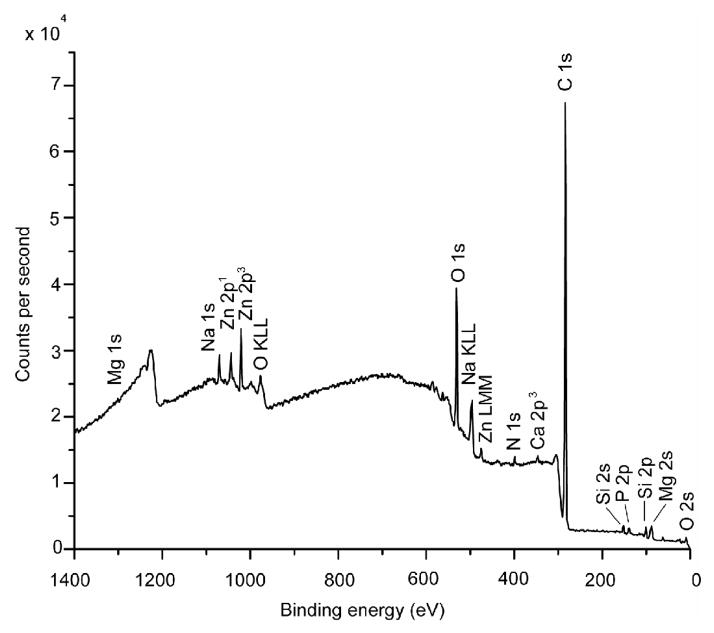
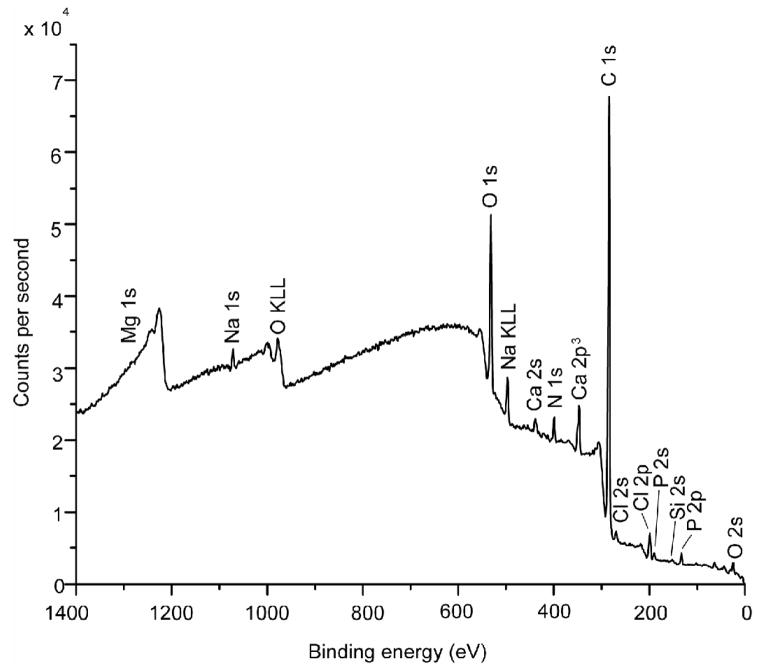
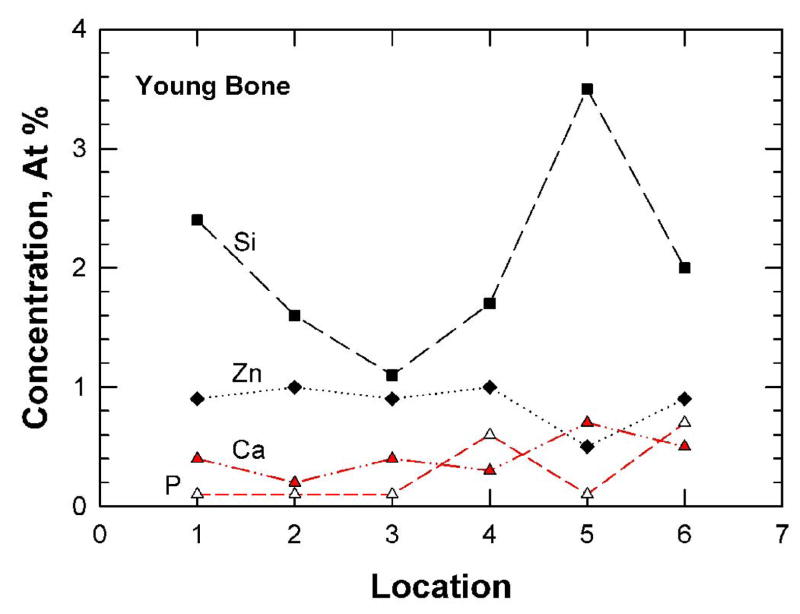
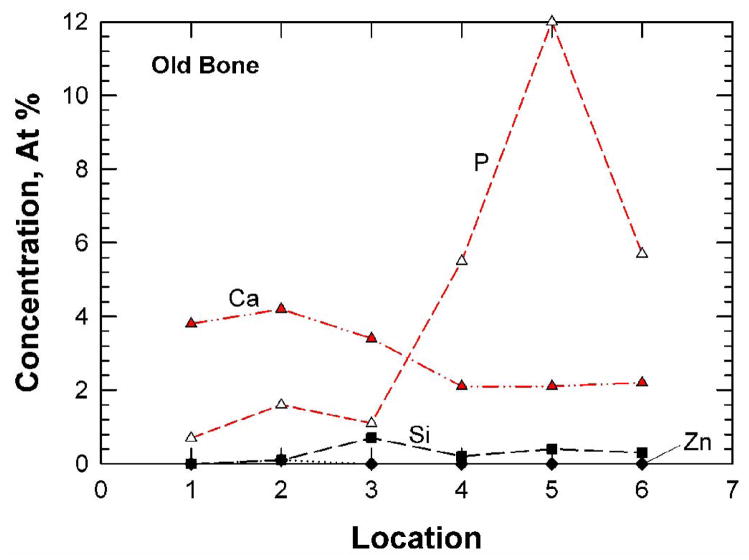
Typical XPS results for the fracture surfaces of the young (48-year-old female) bone and the old (78-year-old female) bone are presented in Figures 5(a) and (b), respectively. For both cases, carbon (> 74.0 ± 5.37 at.%) and oxygen (> 14.0±0.81 at.%) were the elements with the highest concentrations detected, presumably arising from collagen and other organic components in the bone tissue. The concentrations of Ca, P, Si, and Zn for the young and old bone at six locations are presented in Figures 6(a) and (b), respectively. These trace elements show variations in the local concentration because of an X-ray spot size of about 100 μm in diameter was used to sample six locations that were spaced 1 mm apart from each other. The young bone showed the presence of Si (2.05 ± 0.83 at.%), Zn (0.87 ± 0.19 at.%), Ca (0.42 ± 0.17 at.%), and P (0.26 ± 0.29 at.%). In contrast, the old bone exhibited less Si (0.25 ± 0.25 at.%), less Zn (0.02 ± 0.04 at.%) but more Ca (2.97 ± 0.95 at.%) and P (4.45 ± 4.35 at.%), compared to the young bone. Table 2 shows a comparison of the various mineralization levels for the young and old bone. There are significant differences in Si, Zn, Ca, and C contents (p < 0.05) between the young and old bone while there may be differences in P (p < 0.065) but no significant difference exists for the other elements.
Figure 5.
XPS survey scans performed on the fracture surfaces of young and old bone: (a) 48-year-old female, and (b) 78-year-old female.
Figure 6.
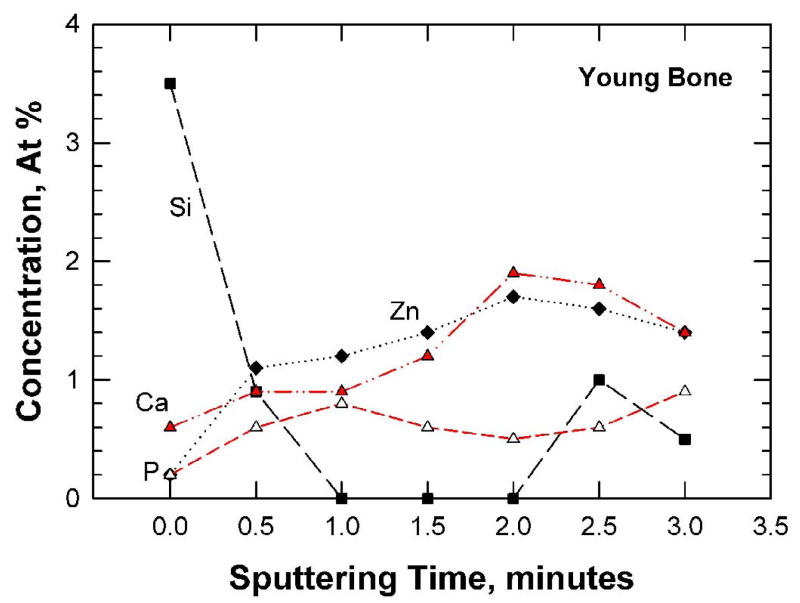
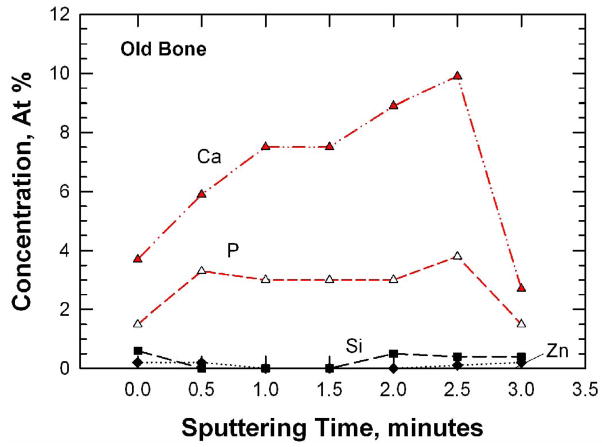
Trace-element concentrations (a and b) and depth profiles (c and d) for the fracture surfaces of young and old bone as determined by X-ray photoelectron spectroscopy: (a) and (c) 48-year-old female: (b) and (d) 78-year-old female.
Table 2.
A comparison of the mineral contents based on the XPS data performed on the fracture surfaces of young (48-year-old) and old (78-year-old) bone.
| 48-year-old female | |||||||||||
|---|---|---|---|---|---|---|---|---|---|---|---|
| Location | C | O | Si | Na | Zn | N | Ca | P | Mg | Cl | P/Ca |
| 1 | 80.9 | 13.6 | 2.4 | 1.2 | 0.9 | 0.5 | 0.4 | 0.1 | 0 | 0 | 4.00 |
| 2 | 80.3 | 13.4 | 1.6 | 1.3 | 1.0 | 1.6 | 0.2 | 0.1 | 0.3 | 0.2 | 2.00 |
| 3 | 82.1 | 13.7 | 1.1 | 1.2 | 0.9 | 0.6 | 0.4 | 0.1 | 0 | 0 | 4.00 |
| 4 | 77.8 | 15.6 | 1.7 | 0.4 | 1.0 | 2.2 | 0.3 | 0.6 | 0.3 | 0.1 | 0.50 |
| 5 | 80.8 | 13.7 | 3.5 | 0.4 | 0.5 | 0 | 0.7 | 0.1 | 0.3 | 0 | 7.00 |
| 6 | 79.9 | 14.2 | 2.0 | 0.7 | 0.9 | 0.6 | 0.5 | 0.7 | 0.5 | 0 | 0.71 |
| Average (S.D.) | 80.3* (1.43) | 14.03 (0.81) | 2.05* (0.83) | 0.87 (0.42) | 0.87* (0.19) | 0.92 (0.82) | 0.42* (0.17) | 0.28 (0.29) | 0.23 (0.20) | 0.05 (0.08) | 3.04 (2.47) |
| 78-year-old-female | |||||||||||
| Location | C | O | Si | Na | Zn | N | Ca | P | Mg | Cl | P/Ca |
| 1 | 81.7 | 12.8 | 0 | 0 | 0 | 0.8 | 3.8 | 0.7 | 0 | 0.2 | 5.43 |
| 2 | 76.8 | 14.8 | 0.1 | 0.9 | 0.1 | 1.3 | 4.2 | 1.6 | 0.1 | 0.1 | 2.63 |
| 3 | 75.6 | 15.1 | 0.7 | 0.6 | 0 | 2.8 | 3.4 | 1.1 | 0.2 | 0.5 | 3.09 |
| 4 | 72.5 | 15.2 | 0.2 | 0.8 | 0 | 2.8 | 2.1 | 5.5 | 0 | 1.0 | 0.38 |
| 5 | 65.9 | 13.8 | 0.4 | 1.6 | 0 | 1.5 | 2.1 | 12.1 | 0.1 | 2.6 | 0.17 |
| 6 | 71.4 | 17.0 | 0.3 | 1.2 | 0 | 1.2 | 2.2 | 5.7 | 0.2 | 0.9 | 0.39 |
| Average (S.D.) | 73.98* (5.37) | 14.78 (1.42) | 0.28* (0.25) | 0.85 (0.54) | 0.02* (0.04) | 1.73 (0.86) | 2.97* (0.95) | 4.45 (4.35) | 0.10 (0.09) | 0.88 (0.92) | 2.01 (2.09) |
This indicates a statistically significant difference (p < 0.05) between the means of the young and the old.
The concentrations of Si, Zn, Ca, and P are shown as a function of sputtering times in Figure 6(c) and (d) for the young and old bone, respectively. For the young bone, the concentrations of Ca, P, and Zn increase with sputtering times while that of Si decreases with increasing sputtering times. In the old bone, the concentrations of Si and Zn are consistently lower than those of Ca and P. These concentration variations are likely a reflection of the different levels of mineralization at various microstructural sites (osteon, interstitial bone, lamellar interface and cement line) in the bone tissue. The fracture specimens had not been assayed to determine the overall, bulk material content because they are still needed for local hardness, elastic modulus, and crack density measurements.
Discussion
One of the significant findings of this investigation is that the crack path in the young bone is more tortuous than that in the old bone because crack deflection by osteons is more frequent than crack penetration through osteons, Figure 3(a). A recent finite-element analysis [20] has shown that crack deflection around a single cylindrical structure like an osteon can lower the near-tip stress intensity factor and improve the fracture resistance by as much as 50% [20]. The amount of crack-deflection toughening is further increased in a series of deflection events typically observed in a tortuous crack path, as shown in Figure 3(a). These findings suggested that crack deflection by osteons may be a more potent toughening mechanism than ligament bridging since the observed ligament sizes were fairly small. For the old bone, crack growth occurred readily at low K-values because of a high porosity level. Once initiated, the crack propagated rapidly and penetrated most, if not all, osteons encountered, as shown in Figure 3(b). The lack of resistance-curve behavior in the old bone can be attributed to the inability of the osteons to deflect and arrest the main crack.
A previous theoretical analysis by He and Hutchinson [21] showed that when a crack in an elastic material 1 of elastic modulus E1 and Poisson’s ratio ν1 approaches another elastic material of elastic modulus E2 and Poisson’s ratio ν2, the crack would either deflect to propagate along the interface or penetrate into elastic material 2, depending on the ratio of Kin/Ko, where Kin is the toughness of the interface adjoining material 1 and material 2 and Ko is the crack-initiation toughness of material 2. The minimum value of Kin/Ko = 0.5 occurs at E1 = E2 and ν1 = ν2. For crack deflection to occur at an interface in an osteon, the ratio of the interface toughness, Kin, to the crack-initiation toughness of the bone, Ko, must be less than 0.5 (Kin/Ko < 0.5) [21] if one assumes identical elastic moduli and Poisson’s ratios for both materials inside and outside the osteon. Since Ko is 1.61 ± 0.61 MPa(m)1/2 for the young (48-year-old) bone, the interface toughness must be in the range of 0.81 ± 0.32 MPa(m)1/2 for crack deflection to occur in the young bone, which is in agreement with the fracture toughness (0.6 – 1.0 MPa(m)1/2) for cracking along cement lines in cortical bone of 37–41 male and female donors [22]. For the old bone, Ko is 0.31 ± 0.083 MPa(m)1/2, which leads to a Kin/Ko ratio of 2.61 for the old bone, assuming Kin remains unchanged in both the young and old bone. At this high Kin/Ko ratio, crack deflection at the interface is difficult and crack penetration into individual layers of an osteon is favored. Consequently, crack deflection by osteons, the formation of uncracked ligaments, and crack bridging all become more difficult in the old bone (78-year-old female).
The different fracture responses of the young and old bone tissues are the results of two drastically different near-tip strain fields. In the young bone, near-tip strain levels are higher and deformation appears to involve shearing along the cement lines and the lamellar interfaces, Figure 4(a). Interface shear is absent from near-tip deformation in the old bone, Figure 4(b). The transition of resistance-curve fracture behavior in the young bone (48-year-old) to a brittle fracture behavior in the old bone (78-year-old) appears to link directly to whether or not the bone tissue can accommodate increased levels of near-tip deformation as well as whether interface shear is feasible between the lamellar layers in the osteons and along the cement lines. A ductile-like behavior with resistance-curve fracture behavior results when the interlamellar shear and cement-line shear are operative. A brittle fracture behavior results when both types of interface shear are inoperative as in the old bone.
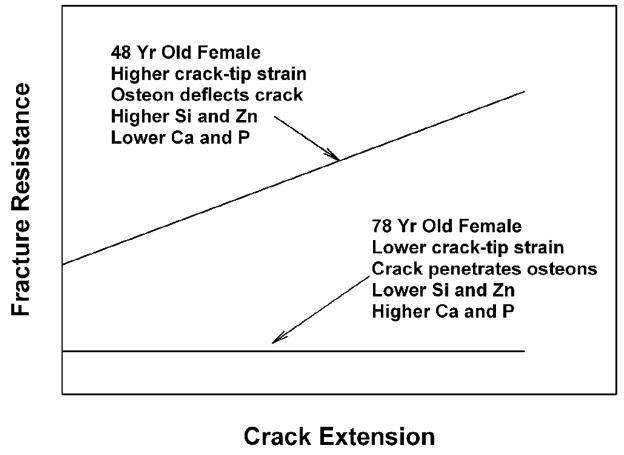
Figure 7 shows a comparison of the experimental resistance-curve, near-tip strain, crack growth mechanism, and mineral content on the fracture surfaces of cortical bone for the two ages. The 48-year-old female exhibits higher crack-tip strains, R-curve behavior, and higher fracture toughness. The crack growth mechanism is predominantly crack deflection by weak interfaces at osteons. The mineral content is higher in Si and Zn, but lower in Ca and P. In contrast, the 78-year-old female exhibits lower crack-tip strains and a lower fracture toughness without R-curve behavior. The crack grows through osteons without crack branching or deflection. The mineral contents are higher in Ca and P and lower in Si and Zn. Table 1 clearly shows that there is a higher tendency for crack deflection to occur in the young bone than in the old bone.
Figure 7.
A comparison of the experimental observations of resistance curve, crack-tip strain, crack growth mechanism, and mineral content on fracture surfaces of cortical bone for the 48- and 78-year-old female.
It is well established that the collagen network in bone degrades with increasing age, leading to significant reductions in failure strength and work to fracture of the collagen network [23]. These reductions in mechanical integrity may be associated with increases in bone matrix mineralization with age [4] and changes in both enzymatic and non-enzymatic crosslinks with age [24]. According to Nyman et al. [24], the concentrations of mature, enzymatic (hydroxylysyl-pyridinoline and lysyl-pyridinoline) crosslinks and a non-enzymatic (pentosidine) crosslink at osteonal and interstitial sites depend on both age and gender [24]. The amount of non-enzymatic crosslinking may increase and that of mature enzymatic crosslinking may decease with age [24]. These changes in the crosslink density can have significant effects on the deformation and fracture behaviors of collagens. Nanomechanical modeling has shown that unmineralized and uncrosslinked collagen fibrils are ductile and exhibit visco-elastic and visco-plastic stress-strain response [25]. The ductile fibrils can promote interlamellar shear, crack-tip blunting and the arrest of a propagating crack in bone. The collagen fibrils become stronger but more brittle when crosslinked and the brittleness increases with increasing crosslink density.
The different fracture behaviors exhibited by the young and old bone tissue may be explained on the basis of the changes of bone mineralization and degree of collagen crosslink density with age. As shown in Table 2, the higher Ca and P contents in the old bone are consistent with increased mineralization in bone with age. Silicon is required for the normal formation of collagen, glycosaminoglycan, and is involved in the formation of crosslinking between collagen and proteoglycans in the extracellular matrix in bone [26]. The higher concentrations of Si in the young bone are consistent with early investigations suggesting that Si is essential during the early stages of bone mineralization with its concentration levels decreasing significantly as the bone tissue matures and becomes more mineralized [27]. The presence of a higher Si content on the fracture surfaces of the young bone may also be a reflection of more crack deflection and interface fracture along cement-lines. Essential for bone formation and remodeling [28], Zn is present in collagen, mineral, and extracellular matrices [29]. Zn deficiency has negative effects in bone formation in animal models and is related to osteoporosis in humans [28]. The higher Zn concentration in the young bone is consistent with more active bone remodeling in the young bone. The absence of Zn in the old bone may be responsible for higher porosity and the observed low fracture toughness. Currently, it is unknown whether or not the variation of Si or Zn concentration is related to the variations of enzymatic and non-enzymatic crosslinking with age.
The absence of Si and Zn on the fracture surfaces of old bone and their presence in young bone suggests that these trace elements may play an important role in the change of bone fracture behaviors with age. The presence of one (or both) of these trace elements may promote cross-linking among collagen fibrils on both sides of the cement line or lamellar interface, reducing interlamellar shear and promoting interface fracture. The resulting crack deflection around osteons, however, leads to a tortuous crack path with uncracked ligaments in the crack wake, leading to a resistance-curve behavior and higher fracture toughness in the young (48-year-old female) bone. As mineralization further increases with age, the critical tensile strain for bone fracture decreases with increasing Ca content [30] and crack penetration through rather than around osteons becomes more dominant as the effect of Ca overwhelms that of Si or Zn. The consequence is that the crack tip would remain sharp and propagate unstably, leading to a near-tip strain field as shown in Figure 4(b) and brittle fracture with a low toughness value without R-curve behavior in the old (78-year-old female) bone.
The higher porosity levels in the old bone, as shown in Table 1, is expected to increase the local stress intensity factor at the crack tip [13]. This type of crack-tip interactions with pore should promote crack penetration through an osteon, leading to brittle fracture and lower fracture toughness compared to the young bone at a low porosity level. Unfortunately, the increase in stress intensity factor due to crack-tip interaction with pores has not been established quantitatively and cannot be quantified as a function of porosity level at this time. Finally, it should also be noted that a potential limitation of this study may be that all the experimental observations so far have been made on specimens acquired from a single donor source for each of the two ages. A larger donor base is certainly desirable, but it has been limited by availability of donors of appropriate ages.
Acknowledgments
The authors acknowledged the assistance provided by Mr. D. E. Moravits at Southwest Research Institute in performing the in-situ fracture toughness experiments and by Mr. C. Hitzman at Stanford University for assistance in the XPS measurements. C.K.C. acknowledges support from a National Science Foundation Graduate Fellowship and Stanford Graduate Fellowship. DPN and KSC acknowledge support from NIH/NIAMS P01 AR046798, NIH/NIA R21 AG029413, and NIH/NIDCR P01 DE011688.
Footnotes
Competing Financial Interests
The authors declare that they have no competing financial interests.
Publisher's Disclaimer: This is a PDF file of an unedited manuscript that has been accepted for publication. As a service to our customers we are providing this early version of the manuscript. The manuscript will undergo copyediting, typesetting, and review of the resulting proof before it is published in its final citable form. Please note that during the production process errors may be discovered which could affect the content, and all legal disclaimers that apply to the journal pertain.
References
- 1.Schaffler MB, Choi K, Milgrom C. Aging and matrix accumulation in human compact bone. Bone. 1995;17:521–525. doi: 10.1016/8756-3282(95)00370-3. [DOI] [PubMed] [Google Scholar]
- 2.Burr DB, Forwood MR, Fyhrie DP, Martin RB, Schaffler MB, Turner CH. Bone microdamage and skeletal fragility in osteoporotic and stress fractures. J Bone and Mineral Research. 1997;12:6–15. doi: 10.1359/jbmr.1997.12.1.6. [DOI] [PubMed] [Google Scholar]
- 3.Schaffler MB, Jepsen KJ. Fatigue and repair in bone. Int J of Fatigue. 2000;22:839–846. [Google Scholar]
- 4.Akkus O, Polyakova-Akkus A, Adar F, Schaffler MB. Aging of microstructural compartments in human compact bone. J Bone and Mineral Research. 2003;18(6):1012–1019. doi: 10.1359/jbmr.2003.18.6.1012. [DOI] [PubMed] [Google Scholar]
- 5.Jepsen KJ. The aging cortex: to crack or not to crack. Osteoporosis. 2003;14 (Suppl 5):S57–S66. doi: 10.1007/s00198-003-1475-3. [DOI] [PubMed] [Google Scholar]
- 6.Van der Meulen MCH, Jepsen KJ, Mikic’ B. Understanding bone strength: size isn’t everything. Bone. 2004;29(2):101–104. doi: 10.1016/s8756-3282(01)00491-4. [DOI] [PubMed] [Google Scholar]
- 7.Nalla RK, Kruzie JJ, Kinney JH, Ritchie RO. Effect of aging on the toughness of human cortical bone: evaluation by R-curves. Bone. 2004;33:240–1246. doi: 10.1016/j.bone.2004.07.016. [DOI] [PubMed] [Google Scholar]
- 8.Diab T, Condon KW, Burr DB, Vashishth D. Age-related change in the damage morphology of human cortical bone and its role in bone fragility. Bone. 2006;38:427–431. doi: 10.1016/j.bone.2005.09.002. [DOI] [PubMed] [Google Scholar]
- 9.Fantner GE, Hassenkam T, Kindt JH, Weaver JC, Birkedal H, Pechenik L, Cutroi JA, Cidade AG, Stucky GD, Morse DE, Hansma PK. Sacrificial bonds and hidden length dissipate energy as mineralized fibrils separate during bone fracture. Nature Mater. 2005;4:612–616. doi: 10.1038/nmat1428. [DOI] [PubMed] [Google Scholar]
- 10.Kruzic JJ, Kuskowski SJ, Ritchie RO. Simple and accurate fracture toughness testing methods for pyrolytic cabon/graphite composites used in heart valve prostheses. J Biomed Mater Res A. 2005;74A:461–4. doi: 10.1002/jbm.a.30380. [DOI] [PubMed] [Google Scholar]
- 11.Ritchie RO, Kinney JH, Kruzic JJ, Nalla RK. A fracture mechanics and mechanistic approach to the failure of cortical bone. Fat Fract Eng Mat Struct. 2005;28:345–371. [Google Scholar]
- 12.ASTM E399-90. Annual Book of ASTM Standards. 03.01. ASTM; West Conshohocken, PA: 1999. Standard test method for plane-strain fracture toughness of metallic materials; pp. 422–252. [Google Scholar]
- 13.Ciarletta M, Iovane G, Sumbatyan MA. On stress analysis for crack in elastic materials with voids. Int J Eng Science. 2003;41:2447–2461. [Google Scholar]
- 14.Nicolella DP, Nicholls AE, Lankford J, Davy DT. Machine vision photogrammetry: a technique for measurement of microstructural strain in cortical bone. J Biomechanics. 2001;34(1):134–139. doi: 10.1016/s0021-9290(00)00163-9. [DOI] [PubMed] [Google Scholar]
- 15.Wang X, Ni Q. Determination of cortical bone porosity and pore size distribution using a low field pulsed NMR approach. J Orthop Res. 2003;21(2):312–319. doi: 10.1016/S0736-0266(02)00157-2. [DOI] [PubMed] [Google Scholar]
- 16.Ural A, Vashishth D. Interactions between microstructural and geometrical adaptation in human cortical bone. J Orthop Res. 2006;24(7):1489–98. doi: 10.1002/jor.20159. [DOI] [PubMed] [Google Scholar]
- 17.Grant JT, Brigges D. Surface analysis by auger and x-ray photo electron spectroscopy. IM Publications; Chichester, UK: 2003. [Google Scholar]
- 18.Barr TL. Modern ESCA: The principles and practices of X-ray photo-electron spectroscopy. CRC Press; Boca Raton, FL: 1994. [Google Scholar]
- 19.Nalla RK, Kruzic JJ, Kinney JH, Ritchie RO. Mechanistic aspects of fracture and R-curve behavior in human cortical bone. Biomaterials. 2005;20:217–231. doi: 10.1016/j.biomaterials.2004.02.017. [DOI] [PubMed] [Google Scholar]
- 20.Chan KS, Lee Y-D, Nicolella DP, Furman BR, Wellinghoff S, Rawls R. Improving fracture toughness of dental nanocomposites by interface engineering and micromechanics. Eng Fract Mech. 2007;74:1857–1871. doi: 10.1016/j.engfracmech.2006.07.013. [DOI] [PMC free article] [PubMed] [Google Scholar]
- 21.He M-Y, Hutchinson JW. Crack deflection at an interface between dissimilar elastic materials. Int J Solids Structures. 1989;25:1053–1067. [Google Scholar]
- 22.Koaster KJ, Ager JW, Ritchie RO. The true toughness of human cortical bone measured with realistically short cracks. Nature Materials. 2008;7(8):672–677. doi: 10.1038/nmat2221. [DOI] [PubMed] [Google Scholar]
- 23.Wang X, Shen X, Li X, Agrawal CM. Age-related changes in the collagen network and toughness of bone. Bone. 2002;31(1):1–7. doi: 10.1016/s8756-3282(01)00697-4. [DOI] [PubMed] [Google Scholar]
- 24.Nyman JS, Roy A, Acuna RL, Gayle HJ, Reyes MJ, Tyler JH, Dean DD, Xang X. Age-related effect on the concentration of collagen crosslinks in human osteonal and interstitial bone tissue. Bone. 2006;39:1210–1217. doi: 10.1016/j.bone.2006.06.026. [DOI] [PMC free article] [PubMed] [Google Scholar]
- 25.Buehler MJ. Nanomechanics of collagen fibrils under varying cross-link densities: atomistic and continuum studies. Journal of the Mechanical Behavior of Biomedical Materials. 2008;1:59–67. doi: 10.1016/j.jmbbm.2007.04.001. [DOI] [PubMed] [Google Scholar]
- 26.Baeuerlein E, Behrens P, Epple M. Handbook of Biomineralization. Wiley-VCH; 2007. pp. 34–35. [Google Scholar]
- 27.Carlisle EM. Silicon: a possible factor in bone calcification. Science. 1970;167:279–280. doi: 10.1126/science.167.3916.279. [DOI] [PubMed] [Google Scholar]
- 28.Ilich JZ, Kerstetter JE. Management of Fractures in Severely Osteoporotic Bone: Orthopedic and Pharmacologic Strategies. Vol. 26. Springer; 2000. Nutrition and bone health; pp. 370–371. [Google Scholar]
- 29.Spadaro JA, Becker RO, Bachman CH. The distribution of trace metal ions in bone and tendon. Calcified Tissue. 1970;6:49–54. doi: 10.1007/BF02196183. [DOI] [PubMed] [Google Scholar]
- 30.Currey JD. Tensile yield in compact bone is determined by strain, post yield behavior by mineral content, J. Biomechanics. 2004;37:549–556. doi: 10.1016/j.jbiomech.2003.08.008. [DOI] [PubMed] [Google Scholar]


