

Abstract
Sodium appetite is associated with a form of behavioral plasticity in which animals experimentally depleted of sodium progressively increase their intake of hypertonic NaCl over several successive (on 2 to 4 occasions) depletion. The present experiment explored the nature of this plasticity by quantifying Fos-immunoreactivity (Fos-ir) in structures implicated in the mediation of sodium appetite and in the signaling of reward. Rats were depleted of sodium with the diuretic furosemide three times (3F), one time (2V1F) or sham depleted (i.e., vehicle treated; 3V). Rats were given sodium appetite tests for the first two treatments. The sodium appetite test was omitted after the third depletion. Fos-ir activity was quantified in the paraventricular nucleus (PVN), subfornical organ (SFO), supraoptic nucleus (SON), nucleus accumbens (NAc) shell and core, basolateral (BLA) and central amygdala (CeA), and medial prefrontal cortex (mPFC). Animals receiving repeated sodium depletions increased sodium ingestion across initial depletions. Fos-ir activity was markedly enhanced in the SFO, BLA, and shell of the NAc of 3F rats relative to 2V1F and 3V animals. These results indicate that repeated experience with sodium depletion and ingestion affect both behavioral and neural responses to sodium. Experience with sodium depletion enhances its ingestion and may have a direct impact on central structures implicated in sodium appetite and reward signaling.
Keywords: Fos-immunoreactivity, ingestive behavior, neural plasticity
1. Introduction
Sodium is a key ion in the maintenance of body fluid homeostasis. Its constancy is of critical importance in the defense of overall fluid balance and the distribution of water between intra- and extracellular fluid compartments. A significant deficit or surfeit of this ion produces robust reflex and behavioral responses that function, respectively, to defend body fluid balance and restore its status to normal. Overconsumption of sodium leads to an increase in urinary sodium excretion while a significant deficit in sodium leads to its retention and ingestion, a physiological state and pattern of behavioral responses collectively defined as sodium appetite.
Behavioral experiments have demonstrated that animals depleted of sodium multiple times show an enhancement in hypertonic saline ingestion in both acute and chronic tests (Falk, 1966; Leshem et al., 2004; Roitman et al., 2002; Sakai et al., 1987; Sakai et al., 1989). The neurobiological changes responsible for this enhancement are unknown, but it may be attributable to plasticity in sodium appetite-related or reward-related nuclei.
Several areas of the forebrain implicated in body fluid balance may be important for the enhancement of sodium appetite. The paraventricular (PVN) and supraoptic nuclei (SON), central amygdala (CeA) as well as structures that lie adjacent to the lamina terminalis, such as the subfornical organ (SFO) (Johnson and Thunhorst, 1997; Rowland et al., 1996) are important in the regulation of body fluid balance and thus may contribute to enhanced sodium intake.
Behavioral adaptations with regard to sodium intake also may result from changes in other central mechanisms. It has been suggested (Bernstein, 2003) that this behavioral plasticity is the result of changes in the motivating or rewarding properties of sodium and that the mesolimbic dopamine system, which has been shown to facilitate reward-related behaviors in general, may mediate perceived changes in the reward properties of sodium solutions (Bernstein, 2003). It is possible that structures receiving input from the mesolimbic dopamine system, which includes the nucleus accumbens (NAc), medial prefrontal cortex (mPFC), basolateral amygdala (BLA), and CeA, may play a facilitory role in the enhanced response to sodium after multiple sodium depletions.
The purpose of the present experiment was to determine if the SFO, PVN, SON and structures associated with brain motivation and reward circuits, such as the NAc (core and shell components), amygdala (basolateral and central nuclei), and mPFC demonstrate neuronal changes in the activity of the immediate early gene, c-fos, as a function of repeated sodium depletions. Rats were either sodium depleted 3 times with furosemide (3F), treated two times with vehicle and then sodium depleted with furosemide (2V1F) or were sham depleted 3 times (3V). Rats were given 1 h access to 0.3 M saline and distilled water 24 h after furosemide/vehicle treatment for the first two sodium/sham depletions. Total intakes were recorded. For the final sodium/sham depletion, rats were not given access to 0.3 M saline and water but were euthanized. Fos-immunoreactivity (Fos-ir) was quantified in the SFO, PVN, SON, NAc core and shell, CeA, BLA, and mPFC. Urine samples were also collected to assay for sodium and potassium content after each sodium/sham depletion. Body weights before and after (3 h post-furosemide/vehicle injection) as well as urine volumes acute (3 h post-furosemide/vehicle injection) and overnight (24 h post-furosemide/vehicle injection) were recorded to verify diuresis.
2. Results
2.1 Effects of repeated sodium depletions without access to 0.3 M saline during the final depletion
Animals depleted of sodium multiple times demonstrated a significant increase in 0.3 M saline consumption as demonstrated by acute (24 h post-furosemide injection) total 0.3 M saline intakes; there was significant interaction effect for acute 0.3 M saline intake [F(2,9) = 4.44, p<0.04; post-hoc comparison first sodium appetite test vs. second sodium appetite test in 3F group t(3) = 2.90, p < 0.05; Fig. 1A and 1B]. Further post-hoc analyses did not reveal significant differences in acute 0.3 M saline intakes in 2V1F or 3V groups. There was no significant interaction effect or main effect for time for water intake. 3F rats averaged 1.95 (±0.43) ml and 2.78 (±0.81) ml; 2V1F rats averaged 0.63 (±0.34) ml and 0.4 (±0.31) ml while 3V rats averaged 0.35 (±0.06) ml and 1.3 (±0.55) ml for the first and second sodium depletions, respectively. There was a significant main effect for group [F(2, 9) =30.67, p<0.0005]. Post-hoc analyses revealed a significant difference between 3F and 2V1F and 3F and 3V for acute water intake [p<0.05 for 3F vs 2V1F; p<0.05 for 3F vs 3V] with 3F rats consuming significantly more water than 2V1F and 3V groups.
Figure 1.

Total acute 0.3 M saline intake (± SEM) in rats treated with furosemide or vehicle (A). Change in acute 0.3 M saline intake (± SEM) from the first to second sodium depletion in rats treated with furosemide or vehicle (B). Acute saline intake was significantly greater in rats depleted of sodium two times (3F=3 furosemide treatments) relative to rats depleted once (2V1F=2 vehicle treatments + 1 furosemide treatment) and to sham depleted rats (3V=3 vehicle treatments).*p < 0.05.
There is a significant main effect for group and time, respectively, for body weight loss over 3 h [F(2, 9) = 68.15, p<0.0001; F(2, 9) = 1557.62, p<0.0001], acute urine volume [F(2, 9) = 214.73, p<0.0001; F(2, 9) = 972.87, p<0.0001], acute urinary sodium excretion [F(2, 9) = 8.31, p<0.003; F(2, 9) = 7.00, p<0.03], and acute urinary potassium excretion [F(2, 9) = 6.85, p<0.006] (see Table 1 for mean urine values). Significant interaction effects were obtained for body weight loss over 3 h [F(2,18) = 61.91, p < 0.0001], acute urine volume [F(2,18) = 229.90, p < 0.0001], acute urinary sodium excretion [F(2,18) = 7.63, p < 0.0005], and acute urinary potassium excretion [F(2,18) = 6.57, p < 0.0005]. Overnight urine volume was not differentially affected by the number of depletions. Post-hoc analyses did not reveal any significant differences between depletions within the 3F group. Post-hoc analyses revealed significant differences in 2V1F rats from the first and second sodium depletions compared to the third in body weight loss over 3 h, acute urine and sodium excretion values. Body weight loss over 3 h [t(3)=16.22, p < 0.001 depletion 1 vs. depletion 3; t(3)=17.12, p<0.001 depletion 2 vs. depletion 3], acute urine volume [t(3)=31.52, p < 0.0001 depletion 1 vs. depletion 3; t(3)=31.94, p < 0.0001 depletion 2 vs. depletion 3], and acute sodium excretion [t(3)=7.99, p < 0.01 depletion 1 vs. depletion 3 and t(3)=7.94, p < 0.01 depletion 2 vs. depletion 3] were significantly increased during the third depletion in 2V1F rats as compared to the first and second sodium depletions.
Table 1.
Mean (± SEM) values for urine measures
| Groups | Week | AUV (ml) | OUV (ml) | Na+ (mmol/L) | K+ (mmol/L) |
|---|---|---|---|---|---|
| 3F | 1 | 18.1±0.63 | 19.9±1.74 | 1.99±0.14 | 0.62±0.08 |
| 2 | 16.8±0.43 | 26.8±2.14 | 1.86±0.04 | 0.60±0.53 | |
| 3 | 16.9±1.20 | 29.0±0.71 | 1.94±0.17 | 0.59±0.21 | |
| 2V1F | 1 | 0.50±0.43 | 13.8±2.59 | 0.03±0.03 | 0.01±0.01 |
| 2 | 0.25±0.25 | 16.0±1.35 | 0.03±0.03 | 0.01±0.01 | |
| 3 | 19.0±0.71* | 24.3±2.17* | 2.20±0.15* | 0.60±0.20* | |
| 3V | 1 | 0.60±0.32 | 12.5±4.45 | 0.04±0.02 | 0.02±0.01 |
| 2 | 0.50±0.35 | 16.3±5.05 | 0±0 | 0±0 | |
| 3 | 0.66±0.18 | 16.3±5.05 | 0.05±0.03 | 0.02±0.02 | |
Acute (3 h post-furosemide) urine volume (AUV); Overnight (24 h post-furosemide) urine volume (OUV); Sodium (3 h post-furosemide) urinary excretion (Na+); Potassium (3 h post-furosemide) urinary excretion (K+).
Represents p < 0.05 vs. Weeks 1 and 2. 3F = 3 furosemide treatments; 2V1F = 2 vehicle treatments + 1 furosemide treatment; 3V = 3 vehicle treatments. Acute and overnight urine outputs as well as sodium and potassium excretion were not affected by multiple sodium depletions in 3F rats.
2.2 Fos-ir
Figures 2A and 2B show Fos-ir data. Sample photomicrographs of representative sections of NAc shell and SFO are presented in Figure 3. Of the regions examined, differential expression of Fos-ir was found in the BLA, the shell and core portions of the NAc (Figure 2A), PVN, and the SFO (Figure 2B). 3F animals showed significantly more Fos-ir activity in the BLA [F(2,11) = 21.05, p < 0.0001; post-hoc comparisons 3F vs. 2V1F and 3V p < 0.001] and NAc shell [F(2,11) = 24.33, p < 0.0001; post-hoc comparisons 3F vs. 2V1F p < 0.002, 3F vs. 3V p < 0.0001] as compared to the 2V1F and 3V groups. Fos-ir in the 2V1F group was not significantly greater in the NAc shell compared to the 3V group. The 3F group also showed significantly more Fos-ir expression in the NAc core [F(2,11) = 6.23, p < 0.02; post-hoc comparisons 3F vs. 3V p < 0.02] and the PVN than the 3V group [F(2,11) = 8.18, p < 0.009; post-hoc comparisons 3F vs. 3V p < 0.008, non-significant for 3F vs. 2V1F]. Animals fluid depleted with furosemide three times also displayed increased levels of Fos-ir in the SFO as compared to both the 2V1F and 3V groups while the 2V1F group showed significantly more Fos-ir than the 3V group [F(2,11) = 129.71, p < 0.0001; post-hoc comparisons 3F vs. 2V1F p < 0.001, 3F vs. 3V p < 0.0001, and 2V1F vs. 3V p < 0.0001].
Figure 2.

Mean (± SEM) Fos-immunoreactivity (Fos-ir) counts/mm2 for furosemide- and vehicle-treated rats with no access to saline and water. BLA=basolateral amygdala; CeA=central amygdala; mPFC=medial prefrontal cortex; NAc=nucleus accumbens (Figure 2A); PVN=paraventricular nucleus; SFO=subfornical organ; SON=supraoptic nucleus (Figure 2B). 3V=3 vehicle treatments; 2V1F=2 vehicle treatments + 1 furosemide treatment; 3F=3 furosemide treatments. *Significantly different compared to 3V; †compared to 2V1F.
Figure 3.
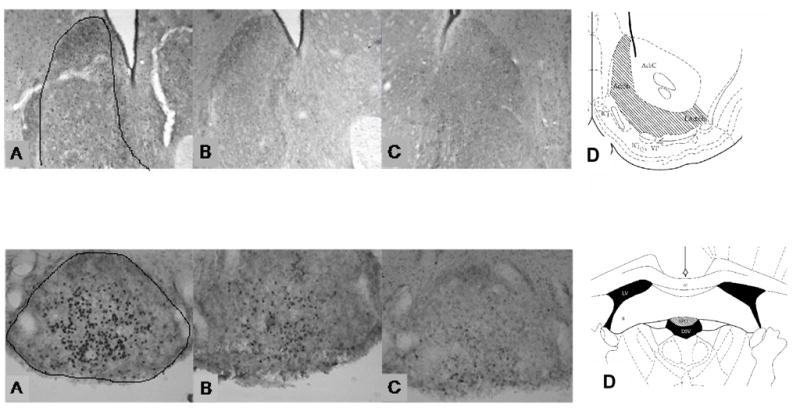
Photomicrographs of nucleus accumbens shell (first row), and subfornical organ (second row) depicting Fos-immunoreactivity. A represents rats treated with furosemide 3 times (3F); B represents rats with two vehicle treatments + 1 furosemide treatment (2V1F); C represents rats treated with vehicle 3 times (3V); D represents schematic drawings of areas counted (Paxinos and Watson, 1998), hatched bars define boundaries. First row: AcbC = nucleus accumbens, core; AcbSh = nucleus accumbens, shell; ICj = islands of Calleja; LAcbSh = nucleus accumbens, shell, lateral division; VP = ventral pallidum (bregma 1.20 mm). Second row: cc = corpus callosum; D3V = dorsal 3rd ventricle; Fi = fimbria of the hippocampus; LV = lateral ventricle; SFO = subfornical organ (bregma −1.40 mm).
Neither the CeA nor the SON showed differential Fos-ir expression while the mPFC displayed increased Fos-ir in the 3F group as compared to the 2V1F group [F(2,11) = 4.13, p<0.05; post-hoc comparison 3F vs. 2V1F, p<0.05].
3. Discussion
Previous research has established that repeated sodium depletions produce a significant increase in sodium appetite as indicated by incremental increases in hypertonic saline solution intake over the first three or four episodes of sodium depletion (Falk, 1966; Falk and Herman, 1961; Leshem et al., 2004; Roitman et al., 2002; Sakai et al., 1987; Sakai et al., 1989). The purpose of the present experiment was to investigate possible neural mechanisms underlying this behavioral plasticity. The present work supports previous findings demonstrating enhanced sodium appetite in rats with multiple sodium depletions (i.e., the increase in sodium ingestion after the second depletion as compared to the first). As anticipated, the results of the experiment show that enhanced sodium appetite is paralleled by an increase in Fos-ir in brain areas frequently associated with body fluid balance and sodium appetite. Importantly, it was also found that brain nuclei associated with motivation and reward showed increased Fos-ir activation. The observed behavioral and neural changes are not dependent on changes in sodium loss or urine output either 3 or 24 h following natriuretic/diuretic treatment as these values were not differentially affected by the number of sodium depletions. Therefore, based on the present data, experience with sodium depletion and/or sodium ingestion produces marked changes in the central nervous system and has enduring effects on behavior.
While it is possible that some peripheral change could contribute to the enhanced sodium appetite (with repeated treatments of furosemide), evidence from the present experiment as well as past studies rule out a number of likely mechanisms. As was stated previously, in the present experiment animals did not successively increase urine output with repeated sodium depletions, nor did these animals increase the amount of sodium excreted (3 h and 24 h post-furosemide treatment). Based on sodium excretion data, rats in the current study drank 50% more sodium than what would have been required to restore the deficit. This value increased to 80% during the second sodium depletion. These data suggest that this increased ingestion of sodium may reflect a change in the reward/hedonic value of sodium.
The differential pattern of Fos-ir activity in the SFO between the 3F and 2V1F groups may give insight into the nature of the neural plasticity responsible for the expression of enhanced sodium intake with repeated depletions. Because systemic physiological mechanisms (i.e., sodium and water excretion) appear to be unaffected by multiple sodium depletions, it is possible that the increased Fos-ir activity in rats that experience multiple sodium depletions may be due to changes in central mechanisms. Damage to the SFO results in attenuation of furosemide/angiotensin II-induced sodium appetite (Fitzsimons, 1998; Morris et al., 2002) and prevents the development of the enhanced daily need free sodium appetite in rats with a history of sodium depletions (Ruhf et al., 2001). In addition, it has been shown that an increase in Fos-ir expression in the central core of the SFO is correlated with an increase in circulating angiotensin II (Sunn et al., 2003), similar to the pattern of Fos-ir expression seen in the present experiment. Thus, the differential Fos-ir activity in this experiment may be a reflection of changes in angiotensin receptor binding (Charron et al., 2002). Further experiments will need to be conducted to clarify this matter.
The absence of Fos-ir in the SON corroborates a study conducted by Rowland and colleagues (1996) demonstrating that Fos-ir is not increased in sodium depleted rats that do not have access to sodium. The current data also confirm another finding of that study, namely that Fos-ir is increased in the SFO of sodium depleted rats without access to sodium.
In the present experiment, the BLA and NAc shell showed increased expression of Fos-ir in rats with a history of sodium depletions. The differential pattern of Fos-ir expression between both groups of sodium depleted rats (3F and 2V1F) is likely the result of experiencing multiple sodium depletions and given what is known about the functions of these nuclei, the current Fos-ir data may be a direct reflection of the changing motivational and reward properties of sodium deficiency and sodium repletion. Several other studies have demonstrated an increase in the motivational value of sodium when animals are depleted. Rats treated with furosemide showed enhanced operant responding to gain access to sodium chloride solutions (Krieckhaus and Wolf, 1968; Quartermain et al., 1967; Weisinger et al., 1970). In addition, breakpoint in a progressive ratio task for access to 3% NaCl is increased in rats with a history of sodium depletions (Clark and Bernstein, 2006).
Published reports have implicated the NAc shell in facilitating hedonic responses to naturally rewarding stimuli such as sucrose infusion. Using a mapping technique based on microinjection of Fos plumes, Pecina and Berridge (2005) discovered an area within the rostromedial shell of the NAc that responded to an intra-accumbens mu-opioid agonist infusion. In addition, microinfusion of the mu-opioid agonist into the rostromedial shell of the accumbens increased hedonic affective responses to intraoral infusions of sucrose. These data demonstrate that the NAc is important in facilitating hedonic responses to sucrose. Thus, similar to the Fos results of Pecina and Berridge (2005), the increased Fos-ir found in the shell of the present experiment as well as the coincident increase in saline intake indicate a shift in the reward value or palatability of sodium.
Sodium appetite arises as a behavioral response to a deficit in sodium, and it has been hypothesized (Bernstein, 2003; Clark and Bernstein, 2006) that the ingestion of salty solutions in deficient animals is rewarding. Thus, sodium deficient animals find physiological relief of this homeostatic challenge through ingestion of salty substances (Cabanac, 1971). It is not clear where the signals of this resolution to the deficit originate, but it can be speculated to be either the result of feedback from the physiological restoration of sodium balance or from the removal of an afferent neural or humoral input signaling the deficit. Regardless of its source, it has been demonstrated that ingestion can be enhanced through the experience of multiple depletions. Bernstein (2003) has suggested that the NAc may be involved in the mediation of this behavioral plasticity. The present findings identify another neural correlate, the BLA, which is a likely candidate to be included in the neural circuitry that mediates the development of enhanced sodium appetite. These same neural structures have been implicated in the processing of information coding other types of reward such as feeding and the rewarding effects of drugs of abuse (Kalivas and Nakamura, 1999; Kelley, 1999; Wise, 2002). The present data also demonstrate central changes in the SFO, a nucleus important in the maintenance of sodium balance. These findings indicate that a history of sodium deficiency is associated with changes in neural plasticity, and given what is known about the function of the brain regions implicated, the current data suggest that these neural changes may underlie the enhanced behaviors that result from multiple sodium depletions. These Fos-ir data suggest that there may be shared neural circuitry among response systems implicated in feeding, drugs of abuse, and sodium appetite (Clark and Bernstein, 2004).
4. Experimental Procedure
4.1 Animals
Twenty male Sprague-Dawley rats (Harlan, Indianapolis, IN) weighing 300–400 g were used. Rats were housed in hanging wire mesh cages and were adapted to laboratory surroundings 1 wk prior to experimentation. Animals were maintained on a 12:12 h light-dark cycle with lights on at 0600 h and off at 1800 h. Food (Purina Rat Chow, 5012; 0.28% sodium content) and tap water were available ad libitum unless otherwise noted.
4.2 Sodium depletion
Prior to testing, animals were given ad libitum access to 0.3 M saline for 5 days and baseline intakes were recorded. If average baseline saline intake exceeded 15 ml, animals were excluded from further analyses. A total of 8 rats were excluded from the present experiment. To assess the effects of repeated sodium depletions on the expression of sodium appetite and Fos-ir, animals were randomly assigned to one of three groups and were given either a) 3 treatments of the diuretic/natriuretic drug furosemide (3F), b) 2 sham vehicle treatments (isotonic saline) plus 1 furosemide treatment (2V1F), or c) 3 vehicle treatments (3V). Two subcutaneous injections of furosemide were given (10 mg/kg body weight each) or isotonic saline (10 mg/kg body weight, s.c.) spaced one hour apart and rats were placed in a metabolic cage in order to collect urine samples. Body weights immediately before and three hours after the first injection were recorded. Acute (3 h post-injection) and overnight (24 h post-injection) urine volumes were recorded and collected for sodium and potassium excretion analysis. Rats were food deprived and given access to distilled water overnight.
4.3 Sodium appetite test
Twenty-four h after the first injection, animals were given access to 0.3 M saline and distilled water for one hour and total intakes were recorded. Animals were then returned to their home cages. This procedure was repeated two more times, each spaced 1 wk apart. One week between furosemide treatments was chosen based on the work of Sakai et al., (1989) and Roitman and colleagues (2002). Also, rats typically consume enough saline during acute tests to restore body fluid homeostasis (refer to Figure 1A and Table 1). Daily intakes of 0.3 M saline and water were recorded between depletions.
Experimental Protocols
4.4 Experimental procedure
Rats were sodium depleted or sham depleted a total of three times with a sodium appetite test 24 h after each of the first two depletions. Fluids were removed at the conclusion of the test and animals remained in test cages for an additional hour. For the third and final depletion, animals were not given access to 0.3 M saline or distilled water. Rats were euthanized with a lethal dose of Nembutal (150 mg/kg, i.p.) 1 h after the conclusion of the sodium appetite test. Rats were perfused transcardially with 0.01 M phosphate buffered saline (PBS) followed by 4% paraformaldehyde.
4.5 Fos Immunohistochemistry
Brains were removed and fixed overnight with 4% paraformaldehyde before being transferred to 30% sucrose solution the following day. Brains were cut on a freezing microtome at 40 μm. All incubations were done at room temperature. The sections were soaked in a hydrogen peroxide and methanol solution and then rinsed in PBS. Tissue was then placed into a normal goat serum solution in 0.3% Triton X. The brain sections were rinsed again with PBS before being placed into a primary antibody solution (1:2000, Santa Cruz Biotechnology, sc-52, in 0.01 M PBS and 0.3% Triton X) overnight. The tissue was rinsed thoroughly with PBS and then incubated in a biotinylated goat anti-rabbit IgG secondary antibody (1:200, Vectastain, Vector Laboratories, Burlingame) in 0.01 M PBS and 0.3% Triton X for 1 h and then the sections were rinsed and soaked in PBS. The cut brains were reacted with avidin-biotin-peroxidase complex for 1 h (Vectastain). The sections were rinsed before reaction with a 0.02% diaminobenzidine solution with 30% hydrogen peroxide added prior to reaction. Immediately following staining, the reaction was stopped by rinsing with PBS. Sections were then mounted on subbed slides and coverslipped with Permount.
Quantification of Fos-ir was done using National Institutes of Health software, Image J. Images were captured at 10 × magnification using a Nikon Diaphot 300 microscope and were adjusted for background gray level and thresholded to binary values. Fos-ir positive nuclei were identified on the basis of pixel size (minimum pixel size 5 and maximum pixel size 100, 640 × 480 image size). Nuclei were identified using a stereotaxic atlas of the rat brain (Paxinos and Watson, 1998) and Fos-ir was quantified in bilateral sections from the following forebrain sites: BLA, CeA, NAc (core and shell subdivisions), PVN of the hypothalamus, mPFC, SFO, and SON. Three sections were quantified for the SFO, four sections for the BLA, CeA, SON, PVN, and six sections were quantified for the mPFC and the NAc core and shell. Fos-ir counts for each nucleus were averaged and expressed per mm2.
4.6 Statistical Analyses
Data are presented as mean ± S.E.M. Behavioral data were analyzed using a repeated two-way analysis of variance (ANOVA) with treatments (3F, 2V1F, or 3V) as the between-group factor and number of sodium depletions as the within-group factor. A Fisher’s Least Significant Difference test was used to analyze body weight loss over 3 h, acute and overnight urine volumes, sodium and potassium output, and saline and water intakes. All data were analyzed as absolute values. Fos-ir data were analyzed using a one-way ANOVA and Tukey’s Honestly Significant Differences (HSD) was used for post-hoc analysis. Significance was attained at p < 0.05.
Acknowledgments
The authors would like to thank Bob Thunhorst, Jeff Kramer, Tony Burnes, and Lynn Burnes for advice and technical assistance. The work was supported in part by grants from the National Heart, Lung, and Blood Institute HL 14388 and HL 57472, National Institute of Diabetes and Digestive and Kidney Diseases DK 66086 and Gatorade Sports Science Institute Student Grant Award.
Abbreviations
- 2V1F
2 vehicle treatments, 1 furosemide treatment
- 3V
3 vehicle treatments
- 3F
3 furosemide treatments
- BLA
basolateral amygdala
- CeA
central amygdala
- Fos-ir
Fos-immunoreactivity
- mPFC
medial prefrontal cortex
- NAc
nucleus accumbens
- PBS
phosphate buffer saline
- PVN
paraventricular nucleus
- SFO
subfornical organ
- SON
supraoptic nucleus
Footnotes
Publisher's Disclaimer: This is a PDF file of an unedited manuscript that has been accepted for publication. As a service to our customers we are providing this early version of the manuscript. The manuscript will undergo copyediting, typesetting, and review of the resulting proof before it is published in its final citable form. Please note that during the production process errors may be discovered which could affect the content, and all legal disclaimers that apply to the journal pertain.
Literature references
- Bernstein IL. Interaction between natural motivational systems and those which respond to drugs of abuse. Appetite. 2003;41:333–334. doi: 10.1016/j.appet.2003.06.001. [DOI] [PubMed] [Google Scholar]
- Cabanac M. Physiological role of pleasure. Science. 1971;173:1103–1107. doi: 10.1126/science.173.4002.1103. [DOI] [PubMed] [Google Scholar]
- Charron G, Laforest S, Gagnon C, Drolet G, Mouginot D. Acute sodium deficit triggers plasticity of the brain angiotensin type 1 receptors. FASEB J. 2002;16:610–612. doi: 10.1096/fj.01-0531fje. [DOI] [PubMed] [Google Scholar]
- Clark JJ, Bernstein IL. Reciprocal cross-sensitization between amphetamine and salt appetite. Pharmacol Biochem Behav. 2004;78:691–698. doi: 10.1016/j.pbb.2004.05.002. [DOI] [PubMed] [Google Scholar]
- Clark JJ, Bernstein IL. Sensitization of salt appetite is associated with increased “wanting” but not “liking” of a salt reward in the sodium-deplete rat. Behav Neurosci. 2006;120:206–210. doi: 10.1037/0735-7044.120.1.206. [DOI] [PubMed] [Google Scholar]
- Falk JL. Serial sodium depletion and NaCl solution intake. Physiol Behav. 1966;1:75–77. [Google Scholar]
- Falk JL, Herman TS. Specific appetite for NaCl without postingestional repletion. J Comp Physiol Psychol. 1961;54:405–408. doi: 10.1037/h0046547. [DOI] [PubMed] [Google Scholar]
- Fitzsimons JT. Angiotensin, thirst, and sodium appetite. Physiol Rev. 1998;78:583–686. doi: 10.1152/physrev.1998.78.3.583. [DOI] [PubMed] [Google Scholar]
- Johnson AK, Thunhorst RL. The neuroendocrinology of thirst and salt appetite: visceral sensory signals and mechanisms of central integration. Front Neuroendocrinol. 1997;18:292–353. doi: 10.1006/frne.1997.0153. [DOI] [PubMed] [Google Scholar]
- Kalivas PW, Nakamura M. Neural systems for behavioral activation and reward. Curr Opin Neurobiol. 1999;9:223–227. doi: 10.1016/s0959-4388(99)80031-2. [DOI] [PubMed] [Google Scholar]
- Kelley AE. Functional specificity of ventral striatal compartments in appetitive behaviors. Ann NY Acad Sci. 1999;877:71–90. doi: 10.1111/j.1749-6632.1999.tb09262.x. [DOI] [PubMed] [Google Scholar]
- Krieckhaus EE, Wolf G. Acquisition of sodium by rats: Interaction of innate mechanisms and latent learning. J Comp Physiol Psychol. 1968;65:197–201. doi: 10.1037/h0025547. [DOI] [PubMed] [Google Scholar]
- Leshem M, Kavushansky A, Devys JM, Thornton S. Enhancement revisited: the effects of multiple depletions on sodium intake in rats vary with strain, substrain, and gender. Physiol Behav. 2004;82:571–580. doi: 10.1016/j.physbeh.2004.05.003. [DOI] [PubMed] [Google Scholar]
- Morris MJ, Wilson WL, Starbuck EM, Fitts DA. Forebrain circumventricular organs mediate salt appetite induced by intravenous angiotensin II in rats. Brain Res. 2002;949:42–50. doi: 10.1016/s0006-8993(02)02963-3. [DOI] [PubMed] [Google Scholar]
- Paxinos G, Watson C. Rat Brain in Stereotaxic Coordinates. Elsevier; New York: 1998. [DOI] [PubMed] [Google Scholar]
- Pecina S, Berridge KC. Hedonic hot spot in nucleus accumbens shell: where do mu-opioids cause increased hedonic impact of sweetness? J Neurosci. 2005;25:11777–11786. doi: 10.1523/JNEUROSCI.2329-05.2005. [DOI] [PMC free article] [PubMed] [Google Scholar]
- Quartermain D, Miller NE, Wolf G. Role of experience in relationship between sodium deficiency and rate of bar pressing for salt. J Comp Physiol Psychol. 1967;63:417–420. doi: 10.1037/h0024611. [DOI] [PubMed] [Google Scholar]
- Roitman MF, Na E, Anderson G, Jones TA, Bernstein IL. Induction of a salt appetite alters dendritic morphology in nucleus accumbens and sensitizes rats to amphetamine. J Neurosci. 2002;22(1–5):RC225. doi: 10.1523/JNEUROSCI.22-11-j0001.2002. [DOI] [PMC free article] [PubMed] [Google Scholar]
- Rowland NE, Fregly MJ, Han L, Smith G. Expression of Fos in rat brain in relation to sodium appetite: furosemide and cerebroventricular renin. Brain Res. 1996;728:90–96. [PubMed] [Google Scholar]
- Ruhf AA, Starbuck EM, Fitts DA. Effects of SFO lesions on salt appetite during multiple sodium depletions. Physiol Behav. 2001;74:629–636. doi: 10.1016/s0031-9384(01)00625-4. [DOI] [PubMed] [Google Scholar]
- Sakai RR, Fine WB, Epstein AN, Frankmann SP. Salt appetite is enhanced by one prior episode of sodium depletion in the rat. Behav Neurosci. 1987;101:724–731. doi: 10.1037//0735-7044.101.5.724. [DOI] [PubMed] [Google Scholar]
- Sakai RR, Frankmann SP, Fine WB, Epstein AN. Prior episodes of sodium depletion increase the need-free sodium intake of the rat. Behav Neurosci. 1989;103:186–192. doi: 10.1037//0735-7044.103.1.186. [DOI] [PubMed] [Google Scholar]
- Sunn N, McKinley MJ, Oldfield BJ. Circulating angiotensin II activates neurones in circumventricular organs of the lamina terminalis that project to the bed nucleus of the stria terminalis. J Neuroendocrinol. 2003;15:725–731. doi: 10.1046/j.1365-2826.2003.00969.x. [DOI] [PubMed] [Google Scholar]
- Weisinger RS, Woods SC, Skorupski JD. Sodium deficiency and latent learning. Psychon Sci. 1970;19:307–308. [Google Scholar]
- Wise RA. Brain reward circuitry: insights from unsensed incentives. Neuron. 2002;36:229–240. doi: 10.1016/s0896-6273(02)00965-0. [DOI] [PubMed] [Google Scholar]