

Abstract
We have been examining the mechanism and kinetics of the interactions of a selected set of peptides with phospholipid membranes, in a quantitative manner. This set was chosen to cover a broad range of physical-chemical properties and cell specificities. Mastoparan (masL) and mastoparan X (masX) are two similar peptides from the venoms of the wasps Vespula lewisii and Vespa xanthoptera, respectively, and were chosen to complete the set. The rate constants for masX association with, and dissociation from membranes are reported here for the first time. The kinetics of dye efflux induced by both mastoparans from phospholipid vesicles were also examined and quantitatively analyzed. We find that masL and masX follow the same graded kinetic model that we previously proposed for the cell-penetrating peptide transportan 10 (tp10), but with different parameters. This comparison is relevant because tp10 is derived from masL by addition of a mostly nonpolar segment of 7 residues at the N-terminus. Tp10 is more active than the mastoparans toward phosphatidylcholine vesicles, but the mastoparans are more sensitive to the effect of anionic lipids. Furthermore, the Gibbs free energies of binding and insertion of the peptides calculated using the Wimley-White transfer scales are in good agreement with the values derived from our experimental data, and are useful for understanding peptide behavior.
During the past several years, we have been examining the mechanisms of a set of antimicrobial, cytolytic, and cell-penetrating peptides using a unified approach that includes a quantitative analysis of their function on phospholipid large unilamellar vesicles (LUVs)1. In this manner, all peptides can be directly compared, and the origin of the differences and similarities in their mechanisms better rationalized. This set of peptides includes δ-lysin (1, 2), cecropin A (3), magainin 2 (4), and the cell-penetrating peptide transportan 10 (tp10) (5, 6), all of which form amphipathic α-helices when bound to membrane surfaces. These peptides vary in length from 21–37 residues, which is enough to span the lipid bilayer if inserted perpendicularly to the membrane surface, and their net charges vary from 0 to +7 at pH 7.5. Thus, they cover a broad range of physical-chemical properties. Tp10 is a man-made, 21-residue, chimeric construct obtained by linking the 6 residues of the neuropeptide galanin, through an extra lysine residue, to the 14 residues of mastoparan from Vespula lewisii, which becomes the C-terminal segment of tp10 (7, 8). Previously, we investigated the kinetics of tp10 binding to phospholipid membranes, the kinetics of tp10-induced dye efflux from vesicles, and its mechanism of dye release (5). Tp10 causes graded release of lipid vesicle contents, and its interaction with membranes is consistent with peptide translocation across the bilayer (5), which is essential for its function (8).
To complete our set of peptides, we wanted to include one that was too short to span the bilayer. Mastoparan (masL) from Vespula lewisii was the obvious choice because it can be directly compared with tp10 regarding the effects of a relatively simple modification. However, masL does not contain a tryptophan residue, which is necessary to measure the binding kinetics by fluorescence. Therefore, in addition to masL, we decided to examine mastoparan X (masX) from Vespa xanthoptera, which is very closely related in sequence to masL (Figure 1 and Table 1). Using masX, an estimate of the binding and dissociation rates for masL can be obtained. Thus, this report completes the work designed for this set of peptides.
FIGURE 1.

Helical wheel projections of mastoparan X (masX), mastoparan (masL), and tp10. The helices are drawn in a way that the 14 C-terminal residues of tp10 are shown in the same positions as the mastoparan sequence, from which it is derived, and mastoparan X is also shown in the same orientation, for ease of comparison. The residues are shaded according to the Wimley-White whole-residue, water/octanol hydrophobicity scale (30). White residues are hydrophilic, black are cationic, and gray are hydrophobic.
Table 1.
Peptides examined and discussed.
| Peptide | Charge (pH 7) | Length | Sequence |
|---|---|---|---|
| Mastoparan (masL)a | +4 | 14 | INLKALAALAKKIL-amide |
| Mastoparan X (masX)b | +4 | 14 | INWKGIAAMAKKLL-amide |
| Tp10 | +5 | 21 | AGYLLGKINLKALAALAKKIL-amide |
| Tp10W | +5 | 21 | AGWLLGKINLKALAALAKKIL-amide |
| Tp10-7MC | +4 | 21 | AGYLLGK(−7MC)INLKALAALAKKIL-amide |
From Vespula lewisii.
From Vespa xanthoptera.
Mastoparan, first isolated from the venom of the wasp Vespula lewisii, owes the name to its function as a mast cell degranulating peptide (9, 10). It is largely unstructured in water but forms an α-helix when bound to membranes (11). Judging from published circular dichroism (CD) spectra, the structure is about 55–65% helical on lysophosphatidylcholine micelles and on phospholipid bicelles (11-13). The α-helical structure is corroborated by the periodicity of the NMR chemical shifts of the amide protons and the peptide lies parallel to the bicelle surface (12). More recently, an NMR study of masL on SDS micelles reveals an α-helix from residues 3 (or 4) to 12, thus about 70–75% helicity (13). When masL is added to phospholipid vesicles of dimyristoylphosphatidylcholine (DMPC)/dimyristoylphosphatidylglycerol (DMPG) 70:30, at a peptide-to-lipid ratio of about 1:10, two populations appear to exist, with about 90% of the peptide parallel and 10% perpendicular to the membrane (13). There is also evidence that masL causes separation of lipid domains in membranes of DMPC/DMPG 70:30 at 35°C (13).
Mastoparan X, from the venom of the wasp Vespa xanthoptera, also forms an amphipathic α-helix when associated with membranes (14), but the orientation appears to be parallel to the surface in DMPC and perpendicular in DMPC/dimyristoylphosphatidylserine 75:25 bicelles, at 40°C, as judged by high-resolution and solid-state 2H-NMR (15). It is suggested that masX may be associated with the PS, in the high-curvature region of the bicelle (15). More recently, masX was shown to lie parallel to the membrane by magic-angle spinning solid-state NMR (16), and the detailed structure obtained indicates the formation of an α-helix between residues 3–14, corresponding to about 86% helicity (17). In both masL and masX, the first few N-terminal residues are the most disorganized (13, 17). All mastoparans are amidated at the terminal carboxylic group. It appears that this C-terminal amidation helps to maintain a helical structure, since a free carboxylic version of another member of the mastoparan family shows considerably more C-terminal disorder than the amidated version (18).
Binding of masX to lipid bilayers and dye efflux induced by the peptide from lipid vesicles have been previously examined by other researchers. MasX binds weakly to POPC LUVs, with an equilibrium dissociation constant KD ≃ 250 μM (19, 20), but it binds strongly to anionic vesicles, for example of egg PC/PG 70:30, with KD ≤ 10 μM (21). Kinetics of masX binding to POPC have been examined before with the goal of separating the contributions of binding and folding as an α-helix on the membrane (22), but the apparent rate constants were not decomposed into on- and off-rate constants. MasX causes graded release from LUVs of POPC (23, 24) and egg PC/phosphatidylglycerol (PG) 70:30 (21), and several lines of evidence indicate that the peptide translocates across the membrane of the vesicles (19, 21). The kinetics of carboxyfluorescein (CF) efflux induced by masX have been analyzed, most notably by Schwarz’s group (19, 20, 23, 24), using an approach developed in the early 1990s (25, 26). The strength of that work is that it provided an analytical method to extract information on pore opening events on the membrane from CF efflux kinetics experiments. Though remarkable, it shares with other analytical approaches the inability to deal with time-dependent, reversible peptide oligomerization on the membrane, which results in non-linear effects. Furthermore, it did not accommodate incomplete dye release at infinite time, a situation that occurs very often in practice. This problem is a consequence of postulating a rate of pore formation that does not vary appreciably during the time frame of the experiment (26). A modification was later introduced to deal with this shortcoming, by operationally expressing the rate of pore formation as a multiexponential decay in time (27), but as long as this rate does not decay to zero, complete CF release always results. To avoid those difficulties, we turned instead to a numerical approach, where the mechanism is expressed as a set of differential equations, which are integrated and used to analyze the kinetics of CF efflux by a direct fit to the experimental time-dependent data. We have used this approach to understand the mechanisms of δ-lysin (1, 2), cecropin A (3), magainin 2 (4), tp10 (5), and now the mastoparans masL and masX. This approach has the advantage that it explicitly incorporates the occurrence of incomplete dye release, which appears naturally in the model as a consequence of peptide translocation across the bilayer. The concept of a cationic peptide translocating across a lipid bilayer may appear unlikely. Yet, it has been suggested by experiment in the case of masX (19, 21), and there is convincing experimental evidence that supports it for oligoarginine peptides on anionic membranes (28, 29). To further assess the likelihood of translocation, we discuss the thermodynamics of peptide binding and insertion in the membrane based on the approach of White and Wimley (30).
MATERIALS AND METHODS
Materials
Mastoparan and mastoparan X were purchased from American Peptide Co. (Sunnyvale, CA). A stock solution was prepared by dissolving lyophilized peptide in deionized water/ethyl alcohol 1:1 (v/v) (AAPER Alcohol and Chemical Co., Shelbyville, KY). Stock peptide solutions were stored at −20°C, and kept on ice during experiments. 1-Palmitoyl-2-oleoyl-sn-glycero-3-phosphocholine (POPC), 1-palmitoyl-2-oleoyl-sn-glycero-3-phosphoethanolamine 1-palmitoyl-2-oleoyl-sn-glycero-3-phosphoserine (POPS), and 1-palmitoyl-2-oleoyl-sn-glycero-3-phosphoglycerol (POPG) in chloroform solution were purchased from Avanti Polar Lipids (Alabaster, AL). 7-Methoxycoumarin-3-carboxylic acid (7MC), 8-aminonaphtalene-1,3,6-trisulfonic acid (ANTS) disodium salt, and p-xylene-bis-pyridinium bromide (DPX) were purchased from Molecular Probes/Invitrogen (Carlsbad, CA). Carboxyfluorescein (99% pure, lot A015252901) was purchased from ACROS (Morris Plains, NJ). Organic solvents (High performance Liquid Chromatography/American Chemical Society grade) were purchased from Burdick & Jackson (Muskegon, MI). Lipids and fluorophores were tested by thin-layer chromatography (TLC) and used without further purification.
Synthesis of Fluorescent Probes
The synthesis of POPE labeled with 7MC, through an amide bond to the amino group of the ethanolamine headgroup (7MC-POPE) was performed as described in detail before (3). The extinction coefficient of 7MC and 7MC-succinimidyl ester are ∊ = 20, 000 and 26, 000 M−1cm−1, respectively, in methanol (31). We determined a similar value, ∊ = 25, 000 M−1cm−1 for 7MC-POPE (in chloroform).
Preparation of Large Unilamellar Vesicles
Large unilamellar vesicles (LUVs) were prepared as previously described (1, 5). POPC and POPS were mixed in chloroform in a round-bottom flask. For vesicles containing 7MC-POPE, the probe was added to the same chloroform solution, at a concentration of 1-2 mol% of the lipid. The solvent was rapidly evaporated using a rotary evaporator (Büchi R-3000, Flawil, Switzerland) at 60-70°C. The lipid film was then placed under vacuum for 4 hours and hydrated by the addition of buffer containing 20 mM MOPS, pH 7.5, 0.1 mM EGTA, 0.02% NaN3, and 100 mM KCl, or appropriately modified as indicated below. The suspension of multilamellar vesicles was subjected to five freeze-thaw cycles to increase encapsulation of dye (CF or ANTS/DPX). The suspension was then extruded 10 × through two stacked Nuclepore polycarbonate filters of 0.1 μm pore size (Whatman, Florham, NJ), using a water-jacketed high pressure extruder from Lipex Biomembranes, Inc. (Vancouver, Canada) at room temperature. Lipid concentrations were assayed by the Bartlett phosphate method (32), modified as previously described (1).
Circular Dichroism Spectroscopy
CD spectra of masX and tp10W were recorded on a Chirascan instrument (Applied Photophysics, Leatherhead, Surrey, UK), in potassium phosphate buffer, 10 mM, pH 7.5, using a 1 mm pathlength quartz cell (Starna Cells, Atascadero, CA). The spectra were measured in the presence of POPG/POPC 50:50 LUVs, with lipid concentration of 200 μM and a peptide concentration of 5–15 μM. The percent helical content was calculated according to Luo and Baldwin (33).
Kinetics of binding to lipid vesicles
The kinetics of masX association with POPC/POPS LUVs were recorded on an Applied Photophysics SX.18MV stopped-flow fluorimeter, at room temperature (about 22°C). After mixing, the concentration of peptide was 0.5–1 μM and the lipid varied between 25 and 400 μM. Fluorescence resonance energy transfer (FRET) between the intrinsic Trp residue of masX and 7MC-POPE incorporated in the membrane (at a concentration of 1–2 mol% of the lipid) was used to monitor peptide association with, and dissociation from LUVs. Trp, excited at 280 nm, transfers energy to 7MC-POPE, which absorbs maximally at 348 nm. The emission of 7MC, with a maximum at 396 nm, was measured using a GG-385 cut-off filter (Edmund Industrial Optics, Barrington, NJ). Alternatively, binding was measured by the change in the fluorescence emission intensity of the Trp residue of masX using a WG-320 cut-off filter (Edmund Industrial Optics, Barrington, NJ). If the dissociation curves are measured over very long periods of time, other, very slow processes are detected, including photobleaching of the fluorophores and, if PS-rich vesicles are used, some vesicle fusion. Under those experimental conditions, these processes can be described by an exponential decay with a characteristic time constant of about 1000 s. Therefore, the longer-time dissociation curves were corrected by subtracting a slow trace with a time constant of 1000 s. Dissociation itself occurs at least 10 times faster than those slow processes, so the error involved in this correction is small.
ANTS/DPX assay
Steady state fluorescence measurements were performed in a SLM-Aminco 8100 spectrofluorimeter (Urbana, IL) upgraded by ISS (Champaign, IL). The ANTS/DPX assay (34-36) was performed as described before (3). ANTS was excited at 365 nm (8 nm slitwidth) and its emission was recorded at 515 nm (16 nm slitwidth). The solution encapsulated in the LUVs contained 5 mM ANTS, 8 mM DPX, 20 mM MOPS, pH 7.5, 0.1 mM EGTA, 0.02% NaN3, and 70 mM KCl. The titrating solution contained 45 mM DPX, 20 mM MOPS, pH 7.5, 0.1 mM EGTA, 0.02% NaN3, and 30 mM KCl. Following extrusion, the LUVs with encapsulated ANTS and DPX were passed through a Sephadex-G25 column to separate the dye in the external buffer from the vesicles. Typical concentrations were about 0.1–2 μM peptide and 500 μM lipid.
Carboxyfluorescein efflux experiments
LUVs for CF efflux kinetics measurements where prepared by hydration of the lipid film with 20 mM MOPS buffer, pH 7.5, containing 0.1 mM EGTA, 0.02% NaN3, and 50 mM CF, to give a final lipid concentration of 10 mM. For fluorescence measurements, the suspension was diluted to the desired lipid concentration in buffer containing 20 mM MOPS, pH 7.5, 100 mM KCl, 0.1 mM EGTA, and 0.02% NaN3, which has the same osmolarity as the CF-containing buffer. Following extrusion, CF-containing LUVs were passed through a Sephadex-G25 column to separate the dye in the external buffer from the vesicles. The kinetics of CF efflux, measured by the relief of CF self-quenching, were recorded in a Applied Photophysics SX.18MV stopped-flow fluorimeter. The excitation of CF was at 470 nm and the emission, which has a maximum at 520 nm, was recorded through a long-pass filter GG 530 (Edmund Industrial Optics). The peptide concentration was 0.5 μM in all experiments. The final fraction of CF release was determined by comparison of the fluorescence with that obtained by addition of the detergent Triton-X-100 (1%). The experiments were performed at room temperature (about 22°C).
Analysis of mastoparan binding kinetics
The kinetics of association of masX with lipid vesicles were analyzed as described before (3). Briefly, when peptide binds to the lipid vesicles, energy transfer occurs from the Trp residue to 7MC-POPE incorporated in the bilayer, resulting in an increase of the fluorescence emission of the probe as a function of time. A single exponential rising function, of the form F(t) = 1 − e−kappt, was fit to the experimental data. The apparent rate constant kapp is related to the on- and off-rate constants by kapp = kon[L] + koff. A plot of kapp against the lipid concentration [L] yields a straight line with slope kon and y-intercept koff . In the dissociation kinetics experiments, a decrease in the fluorescence of 7MC-POPC is observed as masX dissociates from the membrane surface. The fluorescence time course should follow a single exponential decay (3, 4), with an apparent rate constant that approximates koff (3), but in some cases this did not yield an acceptable fit. Rather than using a more complicated analysis, the approximate lifetime of the peptide on the membrane was obtained from the weighted average of the characteristic times of a double exponential decay, as described before (3), and koff was taken as the inverse of the lifetime.
Analysis of carboxyfluorescein efflux kinetics
The experimental data of CF efflux kinetics were analyzed with the model described in detail for tp10 (5). Briefly, in this model, the peptides bind to the membrane surface, thus generating a mass imbalance across the bilayer. This perturbation is relieved by peptide insertion into, and translocation across the bilayer, until its concentrations on both sides of the membrane are equal. To model this, the apparent rate “constant” for insertion (kins) was made to depend on the difference in the concentrations of peptide [P] bound to the outer and inner leaflets of the lipid bilayer, . Unlike kins, is a true constant. The rate constant for the dissipation of the peptide-inserted state is kdins. Efflux of CF is “catalyzed” by the peptide in the inserted state and is characterized by another rate constant, keflx. Since mastoparans, like tp10, cause graded dye release, partially empty vesicles also contribute to the fluorescence, especially at later times. Therefore, the theoretical kinetic curves of CF efflux were corrected for this effect as described in detail before (2).
The model was represented by a set of coupled, nonlinear differential equations, which were solved by numerical integration with a fifth-order Runge-Kutta method with constant step size (37). The numerical solution was fit directly to the experimental data with a simplex algorithm (37). In the analysis of carboxyfluorescein efflux, kon and koff obtained from the binding kinetics were used as fixed parameters. In case of masX, keflx was fixed at the value used for tp10, but this was not possible for masL. The other constants (, kdins, and, in the case of masL, keflx) were adjusted by a global fit to all data sets of different lipid compositions. This global fit was performed in two stages. First, a simultaneous fit to all data for each vesicle composition was performed. Then, a 30% variation was allowed on the adjustable parameters (2 for masX and 3 for masL) and the curves were fit individually. In addition, an amplitude factor (0.8–1.2) was allowed for each curve. This corrects for an experimental uncertainty of about 20% in the determination of the maximum dye release.
RESULTS
Binding of mastoparans to membranes
In order to quantitatively analyze the kinetics of dye efflux induced by mastoparans, it was necessary to determine also the binding kinetics. This is because the on- and off-rate constants (kon and koff), which describe association with, and dissociation from the membrane, are used as parameters in the analysis of dye efflux. Binding to lipid vesicles was measured by stopped-flow fluorescence using FRET from the intrinsic Trp residue of masX to a lipid fluorophore, 7MC-POPE, incorporated at 2 mol% in the membrane. In another set of experiments, the change in fluorescence emission of the Trp residue of masX was used to monitor binding. The data obtained using the Trp fluorescence alone has significantly more noise than the FRET data, as found before for cecropin A (3), but the association kinetics obtained by the two methods are identical within experimental uncertainty. The association kinetics were measured for POPC, POPS/POPC 20:80, and POPS/POPC 50:50, as a function of lipid concentration (Figure 2). As masX binds to the membrane, the fluorescence emission from 7MC-POPE increases, reflecting the increase in energy transfer from the Trp residue. The curves are well described by a single exponential function, as expected (Figure 2A,C,E). The time frames of binding are similar to those reported by others (22). A plot of the apparent rate constant against lipid concentration yields kon as the slope of the straight line and koff as the y-intercept (Figure 2B,D,F). If this intercept occurs very close to the origin, koff has a large uncertainty (panels D,F). Therefore, we also measured the dissociation rate more directly, as previously described in detail (3), by first allowing peptide to bind to vesicles labeled with 7MC-POPE (2 mol% of the lipid) and then mixing those vesicles, in the stopped-flow system, with an excess of unlabeled POPS vesicles, to which the peptide binds better. This leads to quasi-irreversible dissociation of the peptide from the donor vesicles, resulting in a decrease in energy transfer as a function of time (Figure 3). Dissociation from POPC and POPS/POPC 20:80 is rapid and the curves do not deviate appreciably from single exponential functions (panels A,B), as expected (3), but dissociation from POPS/POPC 50:50 is much slower (panel C). The apparent rate constants derived from the fits provide a reasonable estimate of koff (3). For masX binding to POPC the value of koff is about half that obtained from the association kinetics, a slight discrepancy we have found before and have tentatively attributed to peptide translocation across the bilayer during the pre-equilibration in the dissociation kinetics experiment (3, 4). The values of kon and koff obtained by both methods and the equilibrium dissociation constants (KD = koff/kon) are listed in Table 2.
FIGURE 2.

Kinetics of association of mastoparan X (masX) with vesicles of POPC (A,B), POPS/POPC 20:80 (C,D), and POPS/POPC 50:50 (E,F), at room temperature (about 22°C). The left panels show FRET from the Trp residue of the peptide to 7MC-POPE incorporated at 2 mol% in the membrane as a function of time. The signal recorded is the fluorescence emission of 7MC-POPE, which increases upon mixing of masX with lipid vesicles reflecting peptide binding. The experimental data is shown in gray (the examples shown are averages of 3–10 traces of 100 μM total lipid) and the solid black line is a one-exponential fit. The signal-to-noise ratio is larger the better the binding, as the content of PS in the vesicles increases (A<C<E). On the right panels, the apparent rate constant (kapp) is plotted against lipid concentration to yield kon from the slope and koff from the y-intercept. These points correspond to data pooled from 4 experiments using FRET or just the Trp fluorescence.
FIGURE 3.

Kinetics of dissociation of mastoparan X (masX) from vesicles of POPC (A), POPS/POPC 20:80 (B), and POPS/POPC 50:50 (C), at room temperature (about 22°C). The signal shows the decrease in FRET from the Trp of the peptide to 7MC-POPE as masX dissociates from the membrane. The experimental data is shown in gray (the examples in A and B are averages of 4–7 traces of 50 μM total lipid; in C, 1 trace is shown). The signal-to-noise ratio is larger the better the binding, as the content of PS in the vesicles increases (A<B<C). The solid black line is a single-exponential fit in A and C, and a double-exponential fit in B. The mean, apparent rate constant provides an estimate of koff. For dissociation from POPS/POPC 50:50 (C), because of the long measurement time, other, much slower processes are also detected, probably including photobleaching and vesicle fusion, which is more likely if the anionic lipid content is high. These slow processes can be well described by an exponential decay with a time constant of about 1000 s, which was subtracted from the curve shown.
Table 2.
Rate and equilibrium constants for mastoparan X binding to LUVs, at room temperature (about 22°C).
| Lipid Composition |
kon (M−1s−1) |
koffa (s−1) |
koffb (s−1) |
KDc (μM) |
|---|---|---|---|---|
| POPC | (8.0 ± 1.5) × 104 | 32 ± 3 | 16 ± 3 | 300 |
| POPS/POPC 20:80 | (7.2 ± 0.3) × 105 | 7 ± 4 | 0.35 ± 0.15 | 0.5 |
| POPS/POPC 50:50 | (1.0 ± 0.01) × 106 | < 1 | 0.015 ± 0.002 | 0.015 |
From association kinetics.
From dissociation kinetics.
Calculated using kon from association experiments and koff from dissociation experiments except for pure POPC where the average (24 ± 8 s−1) of the values from association and dissociation was used. In the case of POPC we feel confident about the koff obtained from the association kinetics, but in the mixtures the uncertainty in koff is too high, so we used only the value from the dissociation kinetics.
Binding of masL to membranes cannot be measured by fluorescence because it does not have a Trp residue. However, based on calculations of binding to a POPC membrane (Table 4), using the Wimley-White interfacial hydrophobicity scale (30), which were performed with the program Membrane Protein Explorer (MPEX) (38), we estimate that masL binds to POPC about 30 times worse than masX. This is a consequence of the lower hydrophobicity of masL and, to a lesser extent, of its lower helical content. On membranes and membrane-mimetic surfaces, masX is about 86% helical based on the NMR structure (17). Our CD measurements (not shown) yield about 72% helical content on POPG/POPC 50:50 LUVs, but the NMR data is probably more accurate. MasL is only about 70% helical, taking into account several estimates (11-13). We assume that the weaker binding reflects faster dissociation, keeping the association rate constant, an assumption based on our observation that, for most cationic peptides, binding increases with the anionic lipid content of the membrane mainly because of a decrease in the off-rate, with relatively little change in the on-rate (3, 4, 6). This yields an off-rate constant of masL from POPS/POPC 50:50 of koff = 0.45 s−1, 30 times larger than what we determined for masX (koff = 0.015 s−1). Other forces have shorter ranges than the electrostatic field and, since the two mastoparans have the same charge, only small differences in their kon are to be expected. In any case, if the opposite assumption were made, that the weaker binding of masL was a consequence of a smaller kon, the dye efflux kinetics analysis would only be minimally affected.
Table 4.
Gibbs free energy of peptide binding and insertion into POPC bilayers at 25°C.
| Peptide | KDa |
b (kcal/mol) |
(kcal/mol) |
helicity % |
(kcal/mol) |
(kcal/mol) |
|---|---|---|---|---|---|---|
| Mastoparan X (masX) | 300 μM | −7.2 | −6.9 | 86 | 8.7 | 15.6 |
| −6.1 | 72 | 8.7 | 14.8 | |||
| Mastoparan (masL) | ~ 1 mMc | −4.9 | 70 | 8.3 | 13.2 | |
| tp10W | 140 μM | −7.6 | −7.5 | 60d | 9.3 | 17.1 |
| tp10 | −6.9 | 10.7 | 17.6 | |||
| tp10-7MCe | 20 μM | −8.7 | −8.8 | 7.2 | 16.0 |
KD is expressed in terms of lipid, not vesicle, concentration. There are approximately 105 lipids per LUV.
, where the −2.4 kcal/mol is the so-called cratic correction, which we use for consistency with the calculations of White and Wimley (30).
Estimated by adding 2 kcal/mol to of masX, which is the difference between the values for the two mastoparans.
There are no helicity measurements on tp10 and most of its variants. We expected a value of about 60%, based on 53% for transportan (53), the parent peptide from which tp10 is derived (by a deletion of the 6 N-terminal residues), and 70% for mastoparan (11-13), which provides the 14 C-terminal residues of tp10. We have now measured the CD spectrum of tp10W on LUVs of POPG/POPC 50:50, 200 μM (not shown) and calculated the helical content (33) to be about 60%, which is the value used here for all tp10 variants.
The ΔGo calculated for tp10-7MC are only rough estimates based on replacing Lys-7 by Tyr to mimic the aromatic coumarin (6). With this replacement the calculated matches the experimental value of . Replacement by Trp would yield .
Mastoparans cause graded release from LUVs
The ANTS/DPX requenching assay (34-36) was used to determine whether masL causes graded or all-or-none release from vesicles. In the ANTS/DPX assay, a fluorophore (ANTS) and a quencher (DPX) are initially co-encapsulated in the vesicles. Addition of the peptide causes release of both. The fluorescence from ANTS released to the outside is re-quenched by additional DPX, so that the fluorescence originating from the inside of the vesicles is obtained. Because it is a bimolecular process, quenching decreases as DPX leaks out, and the fluorescence from the inside increases. In graded release, some time after addition of peptide, most vesicles in the population have released some of their contents. This yields a rising curve in the ANTS/DPX assay. In all-or-none release, the population consists of vesicles that either released essentially all their contents or released none. This yields a horizontal line because the fluorescence from the inside of intact vesicles remains constant. The result obtained clearly shows that masL causes graded release (Figure 4). Graded release of contents from POPS/POPC 20:80 LUVs is observed for tp10 (5) and, from pure POPC (23, 24), for masX and polystes mastoparan (from Polystes jadwigae). Determining whether release is graded or all-or-none is essential for choosing the appropriate kinetic model to analyze the carboxyfluorescein efflux data.
FIGURE 4.
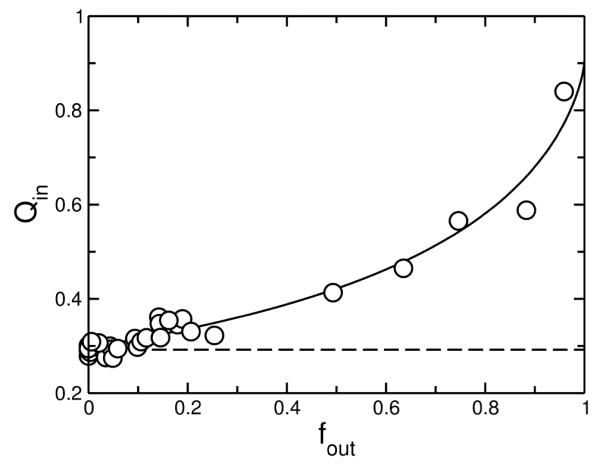
ANTS/DPX assay demonstrating that mastoparan (masL) induces graded dye release from POPS/POPC 50:50 LUVs. The quenching function inside the vesicles (Qin) is plotted against the ANTS fraction released. The data are pooled from two independent experiments. The dashed horizontal line represents the result expected for all-or-none release and the solid line represents a fit of the equation for graded release (36) to the data points. The experiments were performed at room temperature (about 22°C).
Efflux kinetics: experiment and theory
MasL induces essentially no CF release from POPC or POPS/POPC 20:80, using 0.5 μM peptide and 30–200 μM lipid (not shown). Under the same conditions, masX induces about 10% release in 1 hour from POPC vesicles (not shown) but significantly higher CF release from POPS/POPC 20:80 vesicles (Figure 5A, gray traces). When the anionic lipid content is increased to 50 mol% (POPS/POPC 50:50) the rate and extent of CF efflux induced by both peptides are even larger and comparable (Figs. 6 and 7, gray traces). Since mastoparans, like tp10, cause graded release of vesicle contents, we used the same kinetic model developed for tp10 (5) to analyze the experimental rates of CF efflux induced by masL and masX. The mathematical details of the model were previously described (5). This kinetic model was translated into a set of coupled differential equations (5), which was solved numerically and directly fit to the experimental data. The fits obtained, which are shown as black lines in Figs. 5, 6, and 7, represent a good approximation to the data. Systematic deviations occur in Figures 6 and 7, particularly at low peptide-to-lipid ratios, suggesting that some additional detail is missing from the model. However, we should note that those fits are very constrained. The idea was not so much to obtain the best possible determination of the parameters, but rather to see if the model as a whole could describe the data. Thus, kon and koff for masX were held fixed at the values independently determined from the binding and dissociation kinetics experiments. For masX, keflx was fixed at the value previously used for tp10 (5), leaving only two parameters, and kdins, to be determined from the fits. When keflx is sufficiently large, there is a strong correlation with kdins because the shorter the lifetime of the pore, the less efflux occurs (1-3, 5). In those cases it is possible to fix keflx at a sufficiently large value during the fitting procedure. Since we wanted to compare efflux induced by mastoparans and tp10, keflx for masX was held at the same value used for tp10 (5). However, for masL, keflx could not be set at the value for tp10, and a value about 50 times smaller was necessary. The small efflux rate produces efflux curves that are slightly sigmoidal, with a short lag that is visible in the experimental traces (Figure 7). (The curves for masX (Figure 6) do not have this feature.) It is worth stressing that the kinetic model used is exactly the same and can fit efflux caused by both peptides (Figs. 6 and 7), which shows that the shape of the curves can be misleading in ascertaining (dis)similarities of mechanisms. For masL, kon was set to the same value as for masX, and koff was set as 30×koff of masX, as explained above. The lack of a direct measurement of the on- and off-rate constants is a weakness in the masL fits. Fortunately, in POPS/POPC 50:50, mastoparan binding occurs on a time scale that is so much faster than efflux that the uncertainty in the off-rate constants has little impact on the fit parameters obtained for the efflux process. The insertion rate constants () of masX and masL are comparable, but masL remains inserted longer, so that more dye leaks out per insertion event. The two effects largely compensate each other, so that the overall e ciencies of masX and masL toward POPS/POPC 50:50 vesicles are similar and efflux occurs within the same time frame (Figs. 6 and 7).
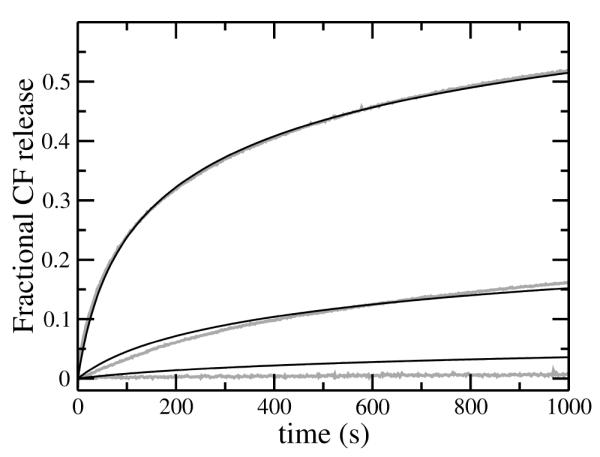
FIGURE 5.

Carboxyfluorescein (CF) efflux induced by mastoparan X (masX) from LUVs of POPS/POPC 20:80, at room temperature (about 22°C). (A) Direct addition of masX (0.5 μM) to vesicles with encapsulated dye, with lipid concentrations of 30, 50, and 100 μM (fastest to slowest). (B) “Reverse experiment”, where masX was first incubated with empty vesicles and then mixed with CF-loaded vesicles of POPS/POPC 20:80 (final peptide and lipid concentrations are 0.5 and 50 μM). The gray lines are experimental data (averages of 2–5 traces in 2 independent samples) and the thin solid lines are the fits of the graded kinetic model to the data. The fits use the on- and off-rate constants listed in Table 2, and the insertion and efflux parameters listed in Table 3.
FIGURE 6.
Carboxyfluorescein (CF) efflux induced by mastoparan X (masX) from LUVs of POPS/POPC 50:50 by direct addition of masX (0.5 μM) to vesicles with encapsulated dye, with lipid concentrations of 30, 50, and 100 μM (fastest to slowest). The gray lines are experimental data (averages of 3–6 traces in 3 independent samples) and the thin solid lines are the fits of the graded kinetic model to the data. The fits use the on- and off-rate constants listed in Table 2, and the insertion and efflux parameters listed in Table 3. The experiments were performed at room temperature (about 22°C).
FIGURE 7.
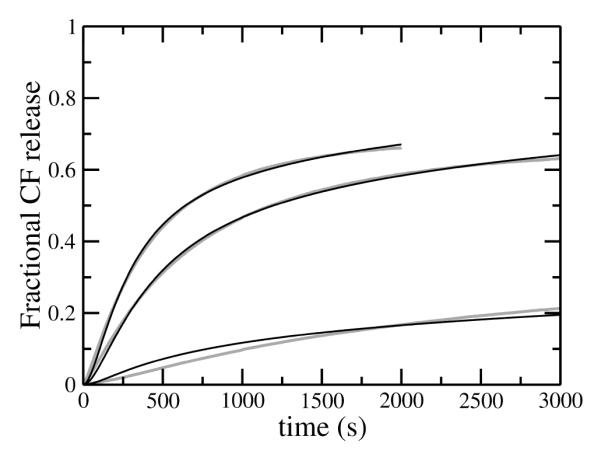
Carboxyfluorescein (CF) efflux induced by mastoparan (masL) from LUVs of POPS/POPC 50:50 by direct addition of masL (0.5 μM) to vesicles with encapsulated dye, with lipid concentrations of 30, 50, and 100 μM (fastest to slowest). The gray lines are experimental data (averages of 2–5 traces in 2 independent samples) and the thin solid lines are the fits of the graded kinetic model to the data. The fits use the same kon as for masX, a koff 30 times larger than for masX (Table 2), and the insertion and efflux parameters listed in Table 3. The experiments were performed at room temperature (about 22°C).
To further test the model, a CF efflux “reverse experiment” (1) was performed, where empty vesicles of POPS/POPC 20:80 (donors) were pre-equilibrated with masX, and then mixed in the stopped-flow system with vesicles loaded with CF (acceptors). The resulting CF efflux kinetics are much slower (Figure 5B, gray curve) than when the peptide is mixed directly with the CF-loaded vesicles, to the same final peptide and lipid concentrations (compare with middle curve in Figure 5A). For the fit of the reverse experiment, the initial conditions were calculated from the integrated equations in the forward reaction, for a period equal to the pre-incubation time of masX with empty vesicles, as previously described (2, 3, 5). A fit to the rate of CF release, with parameters constrained as above from the fits in the forward efflux experiments, yields a line closely matching the experimental trace (Figure 5B, black line). The values obtained for the efflux rate constant (keflx), and the constants for formation and dissipation of the transient pore ( and kdins) are listed in Table 3.
Table 3.
Rate constants for carboxyfluorescein efflux induced by masL and masX, at room temperature (about 22°C). The values for tp10 (5) are listed for easy comparison.
| Peptide and Lipid |
keflx (M−1s−1) |
(M−1s−1) |
kdins (s−1) |
|---|---|---|---|
| Mastoparan (masL) | |||
| POPS/POPC 50:50 | 0.09 ± 0.02 | 0.5 ± 0.1 | 0.005 ± 0.001 |
| Mastoparan X (masX) | |||
| POPS/POPC 20:80 | 5.0 | 0.07 ± 0.02 | 0.9 ± 0.10 |
| POPS/POPC 50:50 | 5.0 | 0.37 ± 0.14 | 1.1 ± 0.2 |
| Tp10a | |||
| POPS/POPC 20:80 | 5.0 | 1.4 ± 0.5 | 0.26 ± 0.05 |
| POPC | 5.0 | 2.2 ± 0.9 | 0.40 ± 0.15 |
Values from (5).
Finally, it should be mentioned that a model involving formation of mastoparan dimers on the membrane as a required step for efflux could also fit the data, perhaps even a little better than the monomer-only model used here. However, it involves two additional parameters, the improvement in the fits is not great, and, most of all, there is no experimental evidence for mastoparan dimerization. The same considerations apply to higher oligomers. Therefore, we have not pursued this alternative further, in keeping with choosing the simplest plausible model that describes the data.
DISCUSSION
The same model that we used to describe the efflux kinetics induced by the cell-penetrating peptide tp10 (5) fits the efflux data of the wasp mastoparans masX and masL. To summarize the model (Figure 8), peptide binding to the outer monolayer of the membrane, determined by kon and koff , creates a mass imbalance across the lipid bilayer. This imbalance perturbs the membrane and thus enhances the probability of a peptide transiently inserting into the bilayer, with an apparent rate constant for insertion kins. In the model, kins is not a true constant but is assumed to be proportional to the absolute value of the gradient of bound peptide across the bilayer, , where is a constant. In the bilayer-inserted state, which is effectively the “pore”, the peptide catalyzes dye efflux from the vesicle. The peptide can then move back to the outer monolayer or complete the crossing of the bilayer with a rate constant kdins. As peptide translocation proceeds, the mass imbalance across the bilayer is dissipated, efflux slows down, and eventually stops, when the bound peptide concentration is the same on both sides of the bilayer. This accounts for the fractional release observed. In this model we used the simplest assumption about the insertion rate constant: that it depends on the difference between the peptide concentrations on the two sides of the membrane. This operational assumption, which also worked well to model the mechanism of δ-lysin (1, 2), was based on the hypothesis that the mass imbalance generated by peptide binding creates a stress across the membrane. This stress may be mediated by the bilayer elastic properties. As peptide binds, the area increase in the outer leaflet of the membrane leads to an imbalance of the relaxed areas of the two leaflets, resulting in an increase of the stretching or bending energy of the membrane, which may be the real transducer of the mass imbalance into larger translocation rates of the peptides. If the primary effect were on the stretching energy we might expect that the apparent rate constant for insertion would depend on the square of the peptide concentration difference across the bilayer, , in accordance with Helfrich (39), instead of the linear dependence we used. We have verified that such a model would provide fits of comparable quality but with slightly different values of the free parameters. On the other hand, we have recently found that, for δ-lysin, the rate of efflux seems to depend on the bilayer bending modulus, rather than on the stretching modulus (40). The effect on bending, however, is probably local and much harder to model. We think that, eventually, a model of the effect of mass imbalance on peptide translocation rate should be based on this type of physical considerations. This is, however, beyond the scope of this paper.
FIGURE 8.
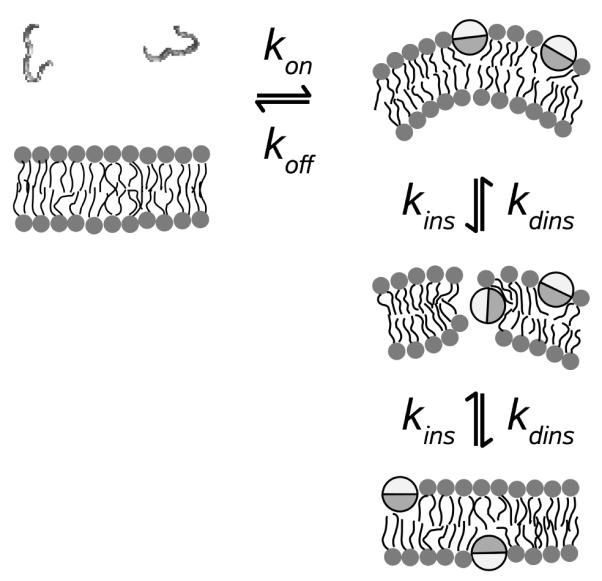
Model of graded release induced by amphipathic peptides. The peptides are unstructured in solution and form α-helices on the membrane, which are shown as viewed from one end of the helix. The dark half of the circle represents the hydrophobic face of the helix and the light half represents the hydrophilic face. Reproduced from ref. (5), as modified in ref. (4), with permission from Biophysical Journal. Copyright 2007 and 2009, respectively, Elsevier.
Comparison of the kinetics of interaction of masX and tp10 with membranes is fairly straight-forward. Binding of tp10 itself to membranes cannot be determined by fluorescence because it does not have a Trp residue, but we have previously measured binding of two tp10 variants that contain fluorophores: tp10-7MC binds to POPC, POPS/POPC 20:80, and POPS/POPC 50:50 with KD = 20, 9, and 3.5 μM, respectively (5, 6), and tp10W binds with KD = 140, 3, and 0.5 μM, respectively, to the same set of mixtures (6). Binding of masX to the same lipid mixtures shows a steeper variation with anionic lipid content: KD = 300, 0.5, and 0.015 μM, respectively (Table 2). With regard to CF efflux, since the efflux rate constant (keflx) for masX can be fixed at the same value used for tp10, only two parameters were determined by fitting, and kdins. MasX inserts more slowly in the bilayer and remains inserted for shorter time periods than tp10; it is therefore significantly less effective. The case of masL is less straightforward. It does not induce dye release from POPC at the peptide concentrations used here, whereas masX releases small but measurable amounts (about 10% release after 1 hour). The main reason masL does not cause release is because it probably binds very poorly to POPC, with a KD 30 times larger than masX (Table 4), as estimated by calculations with MPEX (38). According to these calculations, masX binds better than masL to the POPC interface by a Gibbs free energy difference . This difference arises mainly because masX is more hydrophobic, which contributes ~ −1.3 kcal/mol, but also because masX is more helical, which may contribute up to ~ −0.7 kcal/mol, if the helical contents of masX and masL are taken as 86% (17) and 70% (11-13), respectively, on a membrane surface. The weaker binding of masL to POPC explains why even addition of 20% anionic lipid is insufficient to render masL active (in POPS/POPC 2:8). But in POPS/POPC 50:50, the differences in binding of the two peptides to POPC are overshadowed by the effect of 50% anionic lipid content, and masL becomes actually slightly more effective than masX in inducing efflux.
The mastoparans are much less active than tp10 regarding peptide-induced CF efflux. But of the two, masX behaves more similarly to tp10, although tp10 is actually based on masL, whose sequence constitutes the C-terminal 14 residues of the 21-residue tp10 (Table 1). While all three peptides function in a manner consistent with the same mechanism, the length of tp10 is sufficient to span the bilayer but the length of the mastoparans is not. This suggests that peptide insertion in a membrane-spanning manner is not essential to their mechanism. The thermodynamics of binding and insertion of tp10 and the mastoparans into the bilayer are also not very different. We have calculated the Gibbs free energy of binding to the membrane interface () with the program MPEX (38), which uses the Wimley-White interfacial hydrophobicity scale (41) supplemented with the free energies of transfer of end-groups (42) and the contribution of the peptide α-helical content (43). As shown in Table 4, the calculated values () are in very good agreement with those derived from the experimental binding kinetics (). We have also included in Table 4 the calculated Gibbs energy of transfer of the peptides from water to octanol (), based on the Wimley-White octanol transfer scale (44), which provides a reasonable estimate of the transfer of an α-helical peptide from water to the bilayer interior (45). Finally, we also calculated the Gibbs energy of peptide transfer from the interface to octanol () for mastoparans and tp10 variants. This should provide an estimate of the Gibbs energy of insertion of the peptide, in a helical conformation. This is not to say that simple insertion of masX and masL into the bilayer occurs. We expect that the peptides will perturb the membrane significantly as they sink into the bilayer (1, 2, 5). This perturbation will cause, for example, increased bilayer curvature (46, 47) and thinning (48-51), or other general kinds of membrane perturbations (52). For the mastoparans the calculation yields . In the actual mechanism, where a significant membrane perturbation must occur, the value for insertion should be significantly smaller. Nevertheless, the value of provides a simple and easily accessible tool to predict which peptides are likely to cause the largest membrane perturbations. Among all the peptides that we have examined, tp10 (5, 6) and the mastoparans have small and similar values of , and thus are likely to cause the least bilayer perturbations. Thus, the idea that cationic peptides can translocate across membranes appears at least plausible. In fact, translocation of cationic peptides across anionic membranes has received convincing experimental support (28, 29), and molecular dynamics simulations have provided suggestions for detailed molecular mechanisms (54, 55). Finally, in eukaryotic membranes, a lipid asymmetry exists, with most anionic lipids present in the inner leaflet of the bilayer. It has been suggested that, as cationic peptides bind to the outer leaflet, an electrical field thereby develops across the membrane that enhances the peptide internalization rate (56).
Acknowledgment
This work was supported by National Institutes of Health Grant GM072507. We thank Sonia Gregory, Alesia McKeown, Erin Kilelee, Laura Huskins, and Melissa Cherry for their assistance with some of the experiments.
Footnotes
This work was supported by National Institutes of Health Grant GM072507.
- LUV
- large unilamellar vesicle
- tp10
- transportan 10
- masL
- mastoparan from Vespula lewisii
- masX
- mastoparan from Vespa xanthoptera
- POPC
- 1-Palmitoyl-2-oleoyl-sn-glycero-3-phosphocholine
- POPS
- 1-palmitoyl-2-oleoyl-sn-glycero-3-phosphoserine
- POPE
- 1-palmitoyl-2-oleoyl-sn-glycero-3-phosphoethanolamine
- POPG
- 1-Palmitoyl-2-oleoyl-sn-glycero-3-phosphoglycerol
- DMPC
- dimyristoylphosphatidylcholine
- DMPG
- dimyristoylphosphatidylglycerol
- PC
- phosphatidylcholine
- PS
- phosphatidylserine
- PG
- phosphatidylglycerol
- CF
- carboxyfluorescein
- 7MC
- 7-methoxycoumarin-3-carboxylic acid
- ANTS
- 8-aminonaphtalene-1,3,6-trisulfonic acid
- DPX
- p-xylene-bis-pyridinium bromide
- FRET
- fluorescence resonance energy transfer
- NMR
- nuclear magnetic resonance
- CD
- circular dichroism
- TLC
- thin layer chromatography
- MPEX
- Membrane protein explorer.
- Gibbs energy of peptide binding to the membrane/water interface as a helix
- Gibbs energy of folding to an α-helix in water
- Gibbs energy of transfer of the peptide from water to octanol
- kon
- on-rate constant
- koff
- off-rate constant
- KD
- equilibrium dissociation constant
- kapp
- apparent binding rate constant
- keflx
- efflux rate constant.
References
- 1.Pokorny A, Birkbeck TH, Almeida PFF. Mechanism and kinetics of δ-lysin interaction with phospholipid vesicles. Biochemistry. 2002;41:11044–11056. doi: 10.1021/bi020244r. [DOI] [PubMed] [Google Scholar]
- 2.Pokorny A, Almeida PFF. Kinetics of dye efflux and lipid flip-flop induced by δ-lysin in phosphatidylcholine vesicles and the mechanism of graded release by amphipathic. α-helical peptides. Biochemistry. 2004;43:8846–8857. doi: 10.1021/bi0497087. [DOI] [PubMed] [Google Scholar]
- 3.Gregory SM, Cavenaugh AC, Journigan V, Pokorny A, Almeida PFF. A quantitative model for the all-or-none permeabilization of phospholipid vesicles by the antimicrobial peptide cecropin A. Biophys. J. 2008;94:1667–1680. doi: 10.1529/biophysj.107.118760. [DOI] [PMC free article] [PubMed] [Google Scholar]
- 4.Gregory SM, Pokorny A, Almeida PFF. Magainin 2 revisited: a test of the quantitative model for the all-or-none permeabilization of phospholipid vesicles. Biophys. J. 2009;96:116–131. doi: 10.1016/j.bpj.2008.09.017. [DOI] [PMC free article] [PubMed] [Google Scholar]
- 5.Yandek LE, Pokorny A, Floren A, Knoelke K, Langel U, Almeida PFF. Mechanism of the cell-penetrating peptide Tp10 permeation of lipid bilayers. Biophys. J. 2007;92:2434–2444. doi: 10.1529/biophysj.106.100198. [DOI] [PMC free article] [PubMed] [Google Scholar]
- 6.Yandek LE, Pokorny A, Almeida PFF. Small changes in the primary structure of transportan 10 alter the thermodynamics and kinetics of its interaction with phospholipid vesicles. Biochemistry. 2008;47:3051–3060. doi: 10.1021/bi702205r. [DOI] [PMC free article] [PubMed] [Google Scholar]
- 7.Soomets U, Lindgren M, Gallet X, Hallbrink M, Elmquist A, Balaspiri L, Zorko M, Pooga M, Brasseur R, Langel U. Deletion analogues of transportan. Biochim. Biophys. Acta. 2000;1467:165–176. doi: 10.1016/s0005-2736(00)00216-9. [DOI] [PubMed] [Google Scholar]
- 8.Hällbrink M, Floren A, Elmquist A, Pooga M, Bartfai T, Langel U. Cargo delivery kinetics of cell-penetrating peptides. Biochim. Biophys. Acta. 2001;1515:101–109. doi: 10.1016/s0005-2736(01)00398-4. [DOI] [PubMed] [Google Scholar]
- 9.Hirai Y. In: A new mast cell degranulating peptide “mastoparan” in the wasp venom, Peptide Chemistry. Shiba T, editor. Protein Research Foundation; Osaka, Japan: 1978. pp. 155–160. [Google Scholar]
- 10.Hirai Y, Yasuhara T, Yoshida H, Nakajima T, Fujino M, Kitada C. A new mast cell degranulating peptide “mastoparan” in the venom of Vespula lewisii. Chem. Pharm. Bull. 1979;27:1942–1944. doi: 10.1248/cpb.27.1942. [DOI] [PubMed] [Google Scholar]
- 11.Higashijima T, Wakamatsu K, Takemitsu M, Fujino M, Nakajima T, Miyazawa T. Conformational change of mastoparan from wasp venom on binding with phospholipid membrane. FEBS Lett. 1983;152:227–230. doi: 10.1016/0014-5793(83)80385-8. [DOI] [PubMed] [Google Scholar]
- 12.Vold RR, Prosser RS, Deese AJ. Isotropic solutions of phospholipid bicelles: A new membrane mimetic for high-resolution NMR studies of polypeptides. J. Biomol. NMR. 1997;9:329–335. doi: 10.1023/a:1018643312309. [DOI] [PubMed] [Google Scholar]
- 13.Hori Y, Demura M, Iwadate M, Ulrich AS, Niidome T, Aoyagi H, Asakura T. Interaction of mastoparan with membranes studied by 1H-NMR spectroscopy in detergent micelles and by solid-state 2H-NMR and 15N-NMR spectroscopy in oriented lipid bilayers. Eur. J. Biochem. 2001;268:302–309. doi: 10.1046/j.1432-1033.2001.01880.x. [DOI] [PubMed] [Google Scholar]
- 14.Wakamatsu K, Higashijima T, Fujino M, Nakajima T, Miyazawa T. Tranferred NOE analyses of conformations of peptides as bound to membrane bilayer of phospholipid; mastoparan-X. FEBS Lett. 1983;162:123–126. [Google Scholar]
- 15.Whiles JA, Brasseur R, Glover KJ, Melacini G, Komives EA, Vold RR. Orientation and effects of mastoparan X on phospholipid bicelles. Biophys. J. 2001;80:280–293. doi: 10.1016/S0006-3495(01)76013-4. [DOI] [PMC free article] [PubMed] [Google Scholar]
- 16.Harada E, Todokoro Y, Akutsu H, Fujiwara T. Detection of peptide-phospholipid interaction sites in bilayer membranes by 13C NMR spectroscopy: Observation of 2H/31P-selective 1H-depolarization under magic-angle spinning. J. Am. Chem. Soc. 2006;128:10654–10655. doi: 10.1021/ja062811u. [DOI] [PubMed] [Google Scholar]
- 17.Todokoro Y, Yumen I, Fukushima K, Kang S-W, Park J-S, Kohno T, Wakamatsu K, Akutsu H, Fujiwara T. Structure of tightly membrane-bound mastoparan-X, a G-protein-activating peptide, determined by solid-state NMR. Biophys. J. 2006;91:1368–1379. doi: 10.1529/biophysj.106.082735. [DOI] [PMC free article] [PubMed] [Google Scholar]
- 18.Sforça ML, Oyama S, Jr., Canduri F, Lorenzi CCB, Pertinhez TA, Konno K, Souze BM, Palma MS, Neto JR, Azavedo WF, Jr., Spisni A. How C-terminal carboxyamidation alters the biological activity of peptides from the venom of the eumenine solitary wasp. Biochemistry. 2004;43:5608–5617. doi: 10.1021/bi0360915. [DOI] [PubMed] [Google Scholar]
- 19.Arbuzova A, Schwarz G. Pore-forming action of mastoparan peptides on liposomes: a quantitative analysis. Biochim. Biophys. Acta. 1999;1420:139–152. doi: 10.1016/s0005-2736(99)00098-x. [DOI] [PubMed] [Google Scholar]
- 20.Hellmann N, Schwarz G. Peptide-liposome association. A critical examination with mastoparan-X. Biochim. Biophys. Acta. 1998;1369:267–277. doi: 10.1016/s0005-2736(97)00230-7. [DOI] [PubMed] [Google Scholar]
- 21.Matsuzaki K, Yoneyama S, Murase O, Miyajima K. Transbilayer transport of ions and lipids coupled with mastoparan X translocation. Biochemistry. 1996;35:8450–8456. doi: 10.1021/bi960342a. [DOI] [PubMed] [Google Scholar]
- 22.Tang J, Signarvic RS, DeGrado WF, Gai F. Role of helix nucleation in the kinetics of binding of mastoparan X to phospholipid bilayers. Biochemistry. 2007;46:13865–13863. doi: 10.1021/bi7018404. [DOI] [PubMed] [Google Scholar]
- 23.Schwarz G, Arbuzova A. Pore kinetics reflected in the dequenching of a lipid vesicle entrapped fluorescent dye. Biochim. Biophys. Acta. 1995;1239:51–57. doi: 10.1016/0005-2736(95)00134-o. [DOI] [PubMed] [Google Scholar]
- 24.Arbuzova A, Schwarz G. Pore kinetics of mastoparan peptides in large unilamellar lipid vesicles. Progr. Colloid Polym. Sci. 1996;100:345–350. [Google Scholar]
- 25.Schwarz G, Robert CH. Pore formation kinetics in membranes, determined from the release of marker molecules out of liposomes or cells. Biophys. J. 1990;58:577–583. doi: 10.1016/S0006-3495(90)82401-2. [DOI] [PMC free article] [PubMed] [Google Scholar]
- 26.Schwarz G, Robert CH. Kinetics of pore-mediated release of marker molecules from liposomes or cells. Biophys. Chem. 1992;42:291–296. doi: 10.1016/0301-4622(92)80021-v. [DOI] [PubMed] [Google Scholar]
- 27.Rex S, Schwarz G. Quantitative studies of the melittin-induced leakage mechanism of lipid vesicles. Biochemistry. 1998;37:2336–2345. doi: 10.1021/bi971009p. [DOI] [PubMed] [Google Scholar]
- 28.Sakai N, Matile S. Anion-mediated transfer of polyarginine across liquid and bilayer membranes. J. Amer. Chem. Soc. 2003;125:14348–14356. doi: 10.1021/ja037601l. [DOI] [PubMed] [Google Scholar]
- 29.Sakai N, Takeuchi T, Futaki S, Matile S. Direct observation of anion-mediated translocation of fluorescent oligoarginine carriers into and cacross bulk liquid and anionic bilayer membranes. ChemBioChem. 2005;6:114–122. doi: 10.1002/cbic.200400256. [DOI] [PubMed] [Google Scholar]
- 30.White SH, Wimley WC. Membrane protein folding and stability: Physical principles. Annu. Rev. Biophys. Biomol. Struct. 1999;28:319–365. doi: 10.1146/annurev.biophys.28.1.319. [DOI] [PubMed] [Google Scholar]
- 31.Haugland RP. Handbook of Fluorescent Probes and Research Products. 9th ed Molecular Probes; Eugene, OR: 2002. pp. 66–73. [Google Scholar]
- 32.Bartlett GR. Phosphorous assay in column chromatography. J. Biol. Chem. 1959;234:466–468. [PubMed] [Google Scholar]
- 33.Luo P, Baldwin RL. Mechanism of helix induction by trifluoroethanol: A framework for extrapolating the helix-forming properties of peptides from trifluoroethanol/water mixtures back to water. Biochemistry. 1997;36:8413–8421. doi: 10.1021/bi9707133. [DOI] [PubMed] [Google Scholar]
- 34.Wimley WC, Selsted ME, White SH. Interactions between human defensins and lipid bilayers: Evidence for formation of multimeric pores. Protein Sci. 1994;3:1362–1373. doi: 10.1002/pro.5560030902. [DOI] [PMC free article] [PubMed] [Google Scholar]
- 35.Ladokhin AS, Wimley WC, White SH. Leakage of membrane vesicle contents: determination of mechanism using fluorescence requenching. Biophys. J. 1995;69:1964–1971. doi: 10.1016/S0006-3495(95)80066-4. [DOI] [PMC free article] [PubMed] [Google Scholar]
- 36.Ladokhin AS, Wimley WC, Hristova K, White SH. Mechanism of leakage of contents of membrane vesicles determined by fluorescence requenching. Methods Enzymol. 1997;278:474–486. doi: 10.1016/s0076-6879(97)78025-x. [DOI] [PubMed] [Google Scholar]
- 37.Press WH, Teukolsky SA, Vetterling WT, Flannery BP. Numerical Recipes in Fortran. 2nd ed Cambridge University Press; New York: 1994. [Google Scholar]
- 38.Jaysinghe S, Hristova K, Wimley W, Snider C, White SH. 2009 http://blanco.biomol.uci.edu/mpex.
- 39.Helfrich W. Elastic properties of lipid bilayers: Theory anbd possible experiments. Z. Naturforsch. 1973;28c:693–703. doi: 10.1515/znc-1973-11-1209. [DOI] [PubMed] [Google Scholar]
- 40.Pokorny A, Kilelee EM, Wu D, Almeida PFF. The activity of the amphipathic peptide δ-lysin correlates with phospholipid acyl chain structure and bilayer elastic properties. Biophys. J. 2008;95:4748–4755. doi: 10.1529/biophysj.108.138701. [DOI] [PMC free article] [PubMed] [Google Scholar]
- 41.Wimley WC, White SH. Experimentally determined hydrophobicity scale of proteins at membrane interfaces. Nature Struct. Biol. 1996;3:842–848. doi: 10.1038/nsb1096-842. [DOI] [PubMed] [Google Scholar]
- 42.Hristova K, White SH. An experiment-based algorithm for predicting the partitioning of unfolded peptides into phosphatidylcholine bilayer interfaces. Biochemistry. 2005;44:12614–12619. doi: 10.1021/bi051193b. [DOI] [PubMed] [Google Scholar]
- 43.Ladokhin AS, White SH. Folding if amphipathic α-helices on membranes: Energetics of helix formation by melittin. J. Mol. Biol. 1999;285:1363–1369. doi: 10.1006/jmbi.1998.2346. [DOI] [PubMed] [Google Scholar]
- 44.Wimley WC, Creamer TP, White SH. Solvation energies of amino acid side chains and backbone in a family of host-guest peptapeptides. Biochemistry. 1996;35:5109–5124. doi: 10.1021/bi9600153. [DOI] [PubMed] [Google Scholar]
- 45.Jaysinghe S, Hristova K, White SH. Energetics, stability, and prediction of transmembrane helices. J. Mol. Biol. 2001;312:927–934. doi: 10.1006/jmbi.2001.5008. [DOI] [PubMed] [Google Scholar]
- 46.Matsuzaki K, Sugishita K, Ishibe N, Ueha M, Nakata S, Miyajima K, Epand RM. Relationship of membrane curvature to formation of pores by magainin 2. Biochemistry. 1998;37:11856–11863. doi: 10.1021/bi980539y. [DOI] [PubMed] [Google Scholar]
- 47.Hallock KJ, Lee D-K, Ramamoorthy A. MSI-78, an analogue of the magainin antimicrobial peptides, disrupts lipid bilayer structure via positive curvature strain. Biophys. J. 2003;84:3052–3060. doi: 10.1016/S0006-3495(03)70031-9. [DOI] [PMC free article] [PubMed] [Google Scholar]
- 48.Huang HW. Action of antimicrobial peptides: Two-state model. Biochemistry. 2000;39:8347–8352. doi: 10.1021/bi000946l. [DOI] [PubMed] [Google Scholar]
- 49.Ludtke SJ, He K, Huang HW. Membrane thinning by magainin 2. Biochemistry. 1995;34:16764–16769. doi: 10.1021/bi00051a026. [DOI] [PubMed] [Google Scholar]
- 50.Lee MT, Chen FY, Huang HW. Energetics of pore formation induced by membrane active peptides. Biochemistry. 2004;43:3590–3599. doi: 10.1021/bi036153r. [DOI] [PubMed] [Google Scholar]
- 51.Huang HW, Chen F-Y, Lee M-T. Molecular mechanism of peptide-induced pores in membranes. Phys. Rev. Lett. 2004;92:198304. doi: 10.1103/PhysRevLett.92.198304. [DOI] [PubMed] [Google Scholar]
- 52.Shai Y. Mode of action of membrane active antimicrobial peptides. Biopolymers. 2002;66:236–248. doi: 10.1002/bip.10260. [DOI] [PubMed] [Google Scholar]
- 53.Magzoub M, Kilk K, Eriksson LEG, Langel U, Gräslund A. Interaction and struture induction of cell-penetrating peptides in the presence of phospholipid vesicles. Biochim. Biophys. Acta. 2001;1512:77–89. doi: 10.1016/s0005-2736(01)00304-2. [DOI] [PubMed] [Google Scholar]
- 54.Leontiadou H, Mark AE, Marrink SJ. Antimicrobial peptides in action. J. Amer. Chem. Soc. 2006;128:12156–12161. doi: 10.1021/ja062927q. [DOI] [PubMed] [Google Scholar]
- 55.Herce HD, Garcia AE. Molecular dynamics simulations suggest a mechanism for translocation of the HIV-1 TAT peptide across lipid membranes. Proc. Natl. Acad. Sci. USA. 2007;104:20805–20810. doi: 10.1073/pnas.0706574105. [DOI] [PMC free article] [PubMed] [Google Scholar]
- 56.Binder H, Lindblom G. Charge-dependent translocation of the Trojan peptide penetratin across lipid membranes. Biophys. J. 2003;85:982–995. doi: 10.1016/S0006-3495(03)74537-8. [DOI] [PMC free article] [PubMed] [Google Scholar]