Abstract
γ-Aminobutyric acid (GABA)–releasing inhibitory interneurons, a critical component of cortical circuitry, are involved in myriad known functional roles. However, information regarding the cytoarchitectural, physiological, and molecular properties of interneurons in posterior piriform cortex (PPC) is sparse. Taking advantage of the glutamic acid decarboxylase (GAD)67–enhanced green fluorescent protein (EGFP) mouse, we used in vitro whole-cell patch-clamp techniques to record from GABAergic interneurons across all 3 layers of PPC and, subsequently, to reconstruct their morphology. For the first time, 5 groups of interneurons are identified, whose firing types are defined based on those described within neocortex. Interestingly, each interneuron group with a distinct firing type also exhibits unique morphological properties, laminar distributions, and excitatory synaptic properties. The dendritic and axonal processes demonstrate subtype-specific orientations and a differential expression of spines and boutons, respectively. In addition, the active and passive electrophysiological properties of these cells show marked intergroup differences. Immunohistochemical techniques revealed a laminar-specific distribution of calcium-binding proteins and vasoactive intestinal peptide (VIP) expression. Surprisingly, excitatory synaptic properties in several groups lack target-specific differences seen in neocortical circuits, reflecting a circuit arranged with less complexity. These data aid in the identification of PPC interneurons and allow us to make well-supported postulations about their functional properties.
Keywords: microcircuit, morphology, olfaction, physiology
Introduction
The piriform cortex (PC), a phylogenetically old region of the brain, has been studied extensively in an attempt to elucidate its intrinsic circuitry (reviewed in Haberly 2001; Wilson 2001; Wilson et al. 2006). Rationales for examination of this region are varied and include the following: the relative simplicity of 3 cortical layers, the convenient segregation of afferent and associative inputs, and the understanding that the posterior PC (PPC) microcircuit may provide a model example of associative memory processes (Haberly and Bower 1989). In addition, interneurons of the PC are implicated as important participants in cortical processes including epileptogenesis (de Curtis et al. 1994, 1996; Demir et al. 1998) and feedback inhibition to pyramidal (PYR) cells (Biedenbach and Stevens 1969; Satou et al. 1983; Luna and Schoppa 2008). PC interneurons are also likely to be involved in oscillations originating from the olfactory bulb (Kay and Freeman 1998; Schoppa 2006), although the precise role of cortical inhibition in this process remains unclear.
The 2 classes of principal cells found in the PC have been studied in regard to both their electrophysiological attributes and their anatomy (Haberly 1983; Haberly and Presto 1986; Suzuki and Bekkers 2006). Anatomical studies have detailed numerous non-PYR, morphologically distinct, cell types throughout the PC of the opossum (Haberly 1983; Haberly et al. 1987). In addition, physiological studies have confirmed that non-PYR cells located in the deep layers of the PC have unique firing and membrane properties (Satou et al. 1983; Tseng and Haberly 1989). Our laboratory has previously identified a novel class of PPC interneuron that expresses the 65 kDa isoform of glutamic acid decarboxylase (GAD) (Zhang et al. 2006). However, a comprehensive study of verifiable interneurons found throughout all 3 layers of the mouse PPC, combining physiological, morphological, and immunohistochemical data, has been absent from the literature. It is unclear whether all the physiologically defined interneurons in the neocortex exist in PPC and, if so, whether their morphological and anatomical properties also resemble their neocortical counterparts.
There is still significant debate over how (Yuste 2005), or even if, it is possible (Parra et al. 1998) to group and classify non-PYR cells. However, recent guidelines (Ascoli et al. 2008) have been put to use in this study for the sake of clarity and reproducibility. Our efforts are applied toward providing information that can be used to further our understanding of how cortical inhibitory circuits are organized and, perhaps, function. This first-of-its kind study in the PC provides a necessary background for the elucidation of the olfactory cortical microcircuit. The use of transgenic animals, specifically the GAD67–green fluorescent protein (GFP) mouse (Tamamaki et al. 2003; Jiao et al. 2006), allows for selective recording from γ-aminobutyric acid (GABA)–releasing interneurons that were genetically labeled by expression of GFP under the promoter of the GABA-synthesizing enzyme GAD67 (Tamamaki et al. 2003). GAD67-GFP–positive cells are non-PYR GABAergic cells found throughout the neocortex (Tamamaki et al. 2003; Jiao et al. 2006). Our results provide physiological, morphological, and immunohistochemical data from non-PYR neurons throughout the extent of the mouse PPC. This cortical mapping is a necessary step in order to understand and model the complex circuitry present within the cortex. In addition, although many of the properties of PPC interneurons are similar to their neocortical counterparts, we have also found compelling differences. With these results, it is now possible to elucidate a more complete and accurate PPC circuit through the inclusion of a diverse suite of non-PYR cells.
Materials and Methods
GAD67–EGFP Mice
We used GAD67–GFP (Δneo) mice, in which GFP is selectively expressed under the control of the endogenous GAD67 gene promoter (Tamamaki et al. 2003; Jiao et al. 2006). In this study, these transgenic mice were called GAD67–GFP mice for simplicity. In the neocortex, all the GAD67–GFP neurons were GABAergic, and ∼95% of the GABAergic neurons were GFP positive (Tamamaki et al. 2003; Jiao et al. 2006).
Brain Slice Preparation and Electrophysiological Recordings and Intracellular Dye Injections
PPC brain slices were prepared in accordance to previously published protocols (Young and Sun 2007). Briefly, GAD67–GFP mice (20–30 days postnatal) were deeply anesthetized with pentobarbital sodium (55 mg/kg) and decapitated. The brains were quickly removed and placed into ice-cold, oxygenated slicing medium. This medium contained the following (in millimolar): 2.5 KCl, 1.25 NaH2PO4, 10 MgCl2, 0.5 CaCl2, 26 NaHCO3, 11 glucose, and 234 sucrose. Tissue slices in the coronal plane were cut using a vibratome (TPI, St Louis, MO) and transferred to a holding chamber before recording. For recording, slices were transferred to a recording chamber fixed to a modified microscope stage. All recordings were made at a constant temperature of 33 °C. Slices were minimally submerged and continuously superfused with oxygenated artificial cerebrospinal fluid (ACSF) at a rate of ∼4 mL/min. ACSF contained the following (in millimolar): 126 NaCl, 2.5 KCl, 1.25 NaH2PO4, 1.0 MgCl2, 2 CaCl2, 26 NaHCO3, and 10 glucose. Oxygenation of all solutions consisted of gassing with 95% O2/5% CO2 to a final pH of 7.4 at a temperature of 33 ± 1 °C. The GABAA receptor antagonist picrotoxin (50 μM) was included with the bath perfusion in order to eliminate GABAA-mediated inhibition. Recording pipettes were fabricated from capillary glass obtained from World Precision Instruments (Sarasota, FL; M1B150F-4), using a Sutter Instrument P80 puller, and had tip resistances of 2–5 MΩ when filled with the intracellular solutions referenced below. A Multiclamp 700B amplifier (Axon Instruments, Foster City, CA) was used for voltage-clamp and current-clamp recordings. A potassium-based patch pipette solution containing 0.5% neurobiotin (Vector Laboratories, Burlingame, CA) was used for making patch-clamp recordings from GFP-expressing neurons. Patch pipette saline was composed of the following (in millimolar): 100 potassium-gluconate, 10.0 phosphocreatine–Tris, 3.0 MgCl2, 0.07 CaCl2, 4 ethylene glycol bis(2-aminoethyl ether)-N,N,N′N′-tetraacetic acid, 10.0 4-2-hydroxyethyl-1-piperazine ethanesultanic acid, 4.0 Na2-ATP, and 1.0 Na-GTP, pH adjusted to 7.4 and osmolarity adjusted to 280 mOsm/L. Standard patch recordings were performed for a least 30 min before slices were fixed in 4% paraformaldehyde. Fixed slices were processed for neurobiotin–3,3′-diaminobenzidine tetrahydrochloride (DAB, D5905, Sigma, Saint Louis, MO) histochemistry. GFP-expressing neurons were first identified under an epifluorescent microscope, which was switched to infrared differential interference contrast microscopy for visualized patch-clamp recording.
Electrophysiological Parameters
Recordings were accepted only when the following criteria were met: a resting membrane potential more negative than −55 mV, action potentials which overshoot 0 mV, and a half-maximal spike half width <2 ms. Data analysis was performed using the Clampfit program (MDS, Toronto, Canada), and graphs were plotted in either Excel (Microsoft, Redmond, WA) or Origin (OriginLab Corporation, Northampton, MA); all figures were created using CorelDRAW (Corel Corporation, Ottawa, Canada). Evoked excitatory postsynaptic currents (eEPSCs) were stimulated using a bipolar tungsten electrode placed within layer III of the PPC, as close to the recorded cell as possible (∼200 to 300 μM, depending upon cell soma location). Both eEPSCs and spontaneous excitatory postsynaptic currents (sEPSCs) were recorded in voltage-clamp mode, with a membrane holding potential of −80 mV. The following list of parameters were analyzed from recordings made after 500 ms hyperpolarizing/depolarizing current injection steps in current-clamp mode and evoked and spontaneous currents measured in voltage-clamp mode—maximum peak amplitude (millivolts): the difference between the threshold value and the peak of the action potential following the highest injected current before spike inactivation was observed. Maximum initial frequency (Hertz): the reciprocal of the first interspike interval (ISI) as measured following the highest injected current before spike inactivation was observed. Maximum steady-state frequency (Hertz): the reciprocal of the average of the last 4 ISIs as measured following the highest injected current before spike inactivation was observed. Adaptation ratio (dimensionless): the ratio of the maximum steady-state frequency to the maximum initial frequency. Membrane time constant (milliseconds): measured from the fitting of a monoexponential curve to the falling phase of the voltage response to a small amount of hyperpolarizing current (∼10 mV shift from resting potential). Fast afterhyperpolarization (fAHP, millivolts): measured as the difference between the spike threshold value and the most negative potential following the spike during the smallest injected current to produce spiking. Slow afterhyperpolarization (millivolts): measured as the difference between the membrane potential prior to a 500-ms current step and the most negative potential following the step during the highest injected current before spike inactivation was observed. Input resistance (megaOhms): the slope of a regression line fitted to the I–V curve. Threshold (millivolts): the membrane potential as measured at the point where the interpolated rate of rise (dV/dt) of the spike was equal to 5 V/s, during the smallest injected current to produce spiking. Resting membrane potential (millivolts): membrane potential as measured following seal rupture. Threshold peak amplitude (millivolts): the difference between the threshold value and the peak of the action potential, as measured at the smallest injected current to produce spiking. Maximum rise slope (millivolts per millisecond): as measured during the spike rising phase at the smallest injected current to produce spiking. Maximum decay slope (millivolts per millisecond): as measured during the spike falling phase at the smallest injected current to produce spiking. Decay slope 90% to 10% (millivolts per millisecond): measured at the smallest injected current to produce spiking. Decay time 90% to 10% (milliseconds): measured at the smallest injected current to produce spiking. Half width (milliseconds): measured halfway between threshold and the peak amplitude at the smallest injected current to produce spiking. Frequency/current (F–I) plots were created by measuring the instantaneous frequency of the first 2 spikes of an action potential train and plotting it against the injected current used to elicit the train. Cells of the same firing type were averaged together. Plots indicate stimulation from threshold to the maximum current injection before spike inactivation was observed. sEPSCs: spontaneous excitatory currents averaged over a 3-min recording period. The following parameters were analyzed from sEPSCs: peak amplitude (millivolts), half width (milliseconds), rise tau (milliseconds), decay tau (milliseconds), and instantaneous frequency (Hertz). eEPSCs: induced by a minimally suprathreshold stimulation and averaged over 50 sweeps. The following parameters were analyzed from eEPSCs: half width (milliseconds), rise tau (milliseconds), and decay tau (milliseconds). The paired-pulse ratio (PPR) was calculated from dividing the second eEPSC by the first eEPSC (interval of 500 ms, 5 Hz), averaged over the course of 50 sweeps. In addition, a select number of recordings used a continuum of frequencies (5–70 Hz) to monitor the PPR. Input/output (I–O) graphs were created by plotting the normalized amplitude of eEPSCs versus the normalized current used to stimulate the eEPSC.
Initial Cell Division by Physiological Parameters
Whole-cell patch-clamp recording was used to obtain detailed electrophysiological information from 106 identified GAD67+, non-PYR cells in the PPC. The parameters consisted of both active and passive cell properties (Tables 1 and 2). Mice of ages P20–P30 were used, based upon previous studies in the rat, which maintain that the adult expression pattern of GAD reaches its adult state by P21 (Westenbroek et al. 1987). This was done in an attempt to avoid the inherent developmental differences that may be present in younger aged animals. The posterior region of the PC was chosen due to our laboratory's previous experience in mapping the circuitry, as well as a means to aid in reproducibility. All cells were divided blind as to their anatomical features. Neurons were initially divided by their firing properties into distinct categories: late spiking (LS) cells were identified by a characteristic ramp depolarization or delayed onset prior to firing spikes when stimulated with near-threshold levels of current injection (Kawaguchi 1995; Chu et al. 2003). Irregular spiking (IS) cells were identified by their variable action potential discharge patterns when stimulated with near-threshold levels of current injection. This spiking irregularity often continued until mid-level current injection was reached. Low-threshold spiking (LTS) cells were identified by rebound spiking that occurred following hyperpolarizing current injections. Fast spiking (FS) cells were identified by the following criteria (found previously in neocortical FS cells): an adaptation ratio >0.60, a half width <0.6 ms, a maximum initial frequency >125 Hz, and an F–I slope (calculated from the first 4 current injection steps to generate spiking) greater than 0.5 (see Fig. 1F). Cells that met at least 3 of the 4 criteria were considered to be FS. Cells that did not fit into any of these categories were considered regular spiking non-PYR (RSNP) cells. Each of these phenotypes has been observed previously within the neocortex (see Results). Upon division, physiological and morphological parameters were compared across groups using single-factor analysis of variance tests, followed by Tukey's honestly significant difference test in order to determine intergroup significance. Data are presented as mean ± standard error of the mean, unless noted otherwise.
Table 1.
Action potential electrophysiological parameters of PPC interneurons
| RSNP (n = 51) | LS (n = 24) | IS (n = 19) | FS (n = 12) | ||
| Half width (ms) | 0.84 ± 0.03** | 0.96 ± 0.05** | 0.86 ± 0.07** | 0.40 ± 0.04** | RS, LS, IS ≫ FS |
| Maximum rise slope (mV/ms) | 85.7 ± 4.62 | 68.2 ± 3.76** | 74.6 ± 6.45** | 109 ± 16.7** | FS ≫ LS, IS |
| Decay slope 90–10 (mV/ms) | −22.7 ± 1.21** | −22.5 ± 1.60** | −22.8 ± 1.40** | −40.8 ± 5.67** | FS ≫ RS, LS, IS |
| Maximum frequency initial (Hz) | 81.5 ± 3.68** | 54.1 ± 5.72** | 56.9 ± 7.52** | 141 ± 5.87** | FS ≫ RS, LS, IS |
| RS > LS, IS | |||||
| Maximum frequency steady state (Hz) | 45.6 ± 1.42** | 47.1 ± 1.66** | 46.4 ± 2.73** | 98.7 ± 4.12** | FS ≫ RS, LS, IS |
| Adaptation ratio | 0.60 ± 0.02** | 1.03 ± 0.12* | 1.14 ± 0.19** | 0.73 ± 0.03* | LS > RS, IS ≫ RS |
| IS > FS | |||||
| Membrane time constant (ms) | 16.3 ± 1.00* | 14.4 ± 1.09 | 11.2 ± 0.54* | 17.2 ± 1.99* | FS, RS > IS |
| fAHP (ms) | −14.2 ± 0.48* | −17.0 ± 0.53** | −15.9 ± 0.90** | −11.5 ± 1.00** | LS > RS |
| LS, IS ≫ FS | |||||
| Resistance (MΩ) | 295 ± 11.6* | 256 ± 10.9 | 229 ± 14.2* | 259 ± 20.6 | RS > IS |
| Threshold (mV) | −26.4 ± 1.05 | −21.0 ± 1.17* | −24.3 ± 2.90 | −28.7 ± 3.13* | FS > LS |
| Resting potential (mV) | −66.5 ± 0.87** | −73.0 ± 1.04** | −73.0 ± 1.55** | −64.5 ± 1.98** | LS, IS ≫ FS, RS |
Note: Each parameter represents the average of individual interneurons within each firing type. The final column shows the relative significance for each parameter among the 4 firing types. >, P < 0.05 and ≫, P < 0.01.
*P < 0.05, **P < 0.01 (for all tables).
Table 2.
eEPSC and sEPSC parameters of PPC interneurons
| eEPSC | RSNP (n = 22) | LS (n = 10) | IS (n = 8) | FS (n = 4) | |
| Half width (ms) | 6.96 ± 0.55 | 5.69 ± 0.98 | 4.70 ± 0.67 | 6.51 ± 2.31 | |
| Rise tau (ms) | 4.21 ± 0.70 | 2.83 ± 0.61 | 2.80 ± 0.30 | 2.34 ± 0.82 | |
| Decay tau (ms) | 9.10 ± 0.91 | 9.30 ± 1.56 | 6.35 ± 0.94 | 5.03 ± 1.14 | |
| PPR (dimensionless) | 1.54 ± 0.12 | 1.88 ± 0.31 | 1.69 ± 0.45 | 1.11 ± 0.05 | |
| sEPSC | RSNP (n = 30) | LS (n = 11) | IS (n = 14) | FS (n = 6) | |
| Peak amplitude (pA) | −7.86 ± 0.95 | −9.07 ± 1.40 | −6.69 ± 0.94 | −11.2 ± 3.34 | |
| Half width (ms) | 3.81 ± 0.26 | 3.14 ± 0.42 | 3.00 ± 0.21 | 2.97 ± 0.43 | |
| Rise tau (ms) | 2.93 ± 0.22 | 2.83 ± 0.49 | 2.53 ± 0.25 | 2.69 ± 0.47 | |
| Decay tau (ms) | 7.47 ± 0.44 | 5.86 ± 0.55 | 5.78 ± 0.47 | 5.22 ± 0.44 | |
| Instantaneous frequency (Hz) | 6.47 ± 0.43* | 6.21 ± 0.76* | 6.38 ± 0.51* | 9.00 ± 0.66* | FS > RS, LS, IS |
Note: Each parameter represents the average of individual interneurons within each firing type.
Figure 1.
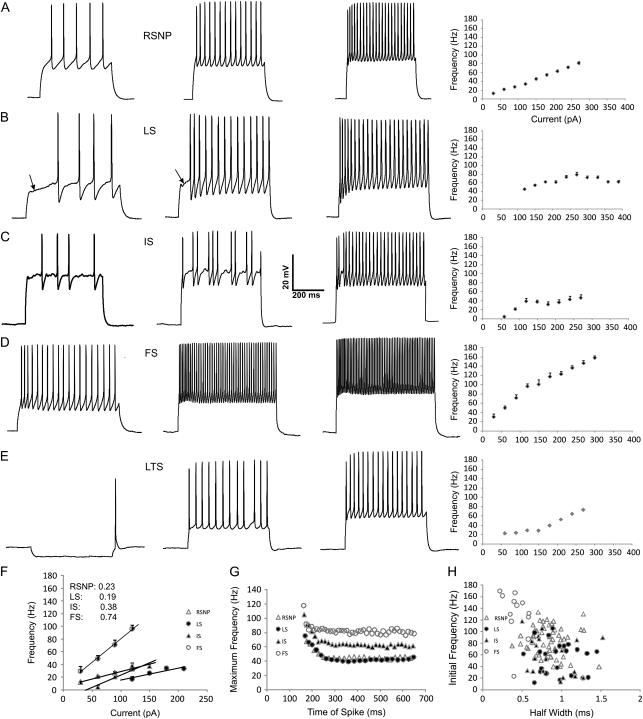
Electrophysiological parameters of PPC interneurons. Representative membrane responses to a 500-ms depolarizing current injection in RSNP (A), LS (B), IS (C), FS (D), and LTS (E) cells (from left to right) at threshold (100 pA), suprathreshold (200 pA), and maximal (300 pA) values (from left to right), except for (E), which indicates the threshold for rebound spiking following hyperpolarizing current (−50 pA), threshold following depolarizing current (100 pA), and suprathreshold (200 pA) value (from left to right). Note the typical regular spiking profile of low frequency, adapting spike trains of RSNP cells (A). Note the slow, ramp depolarization prior to the first spike (arrows)—a hallmark of the LS cell (B). Note the high-frequency, nonadapting spike trains of FS cells (D). Note the rebound excitation following hyperpolarizing current injection of LTS cells (E). A frequency–current (F–I) plot is shown following each of the maximal traces and represents an average from cells of each firing type (RSNP n = 51, LS n = 24, IS n = 19, FS n = 12, LTS n = 1). The first 4 points of the F–I plot (F) were used to calculate the slope of the F–I curve (F inset). A representative chart of maximum frequency versus its time point within the depolarizing train (G) illustrates the differences in adaptation between firing types (see also Table 1). A plot of initial frequency versus the half width of individual cells (H) illustrates segregation between firing types. Scale bar applies to all traces.
Immunohistochemistry
Brains were postfixed after perfusion in 4% paraformaldehyde at 4 °C overnight, cryoprotected in 30% sucrose for 2 days, frozen, and cut into 50-μm thick cryostat sections. Free-floating sections were then stained for antibodies as follows: sections were rinsed in phosphate-buffered saline (PBS), incubated for 30 min in 0.5% H2O2 in PBS, washed 2 × 10 min in PBS, incubated for 2 h at room temperature in PBS with 0.3% Triton X-100, 0.05% Tween, and 4% normal goat serum, and incubated overnight at 4 °C in PBS containing 0.2% Triton X-100 and primary antibodies directed against parvalbumin (PV) (1:1000, Calbiochem, San Diego, CA). The other primary antibodies used were as follows: a polyclonal rabbit anti-nitric oxide synthase 1 (1:250, Chemicon, Millipore, Billerica, MA; cat#: AB1552, lot#: LV1478915), a polyclonal rabbit anti-vasoactive intestinal peptide (VIP, 1:250, Chemicon, cat#: AB982, lot#: LV1423043a), a polyclonal rabbit anti-calretinin (CR) antibody (1:500, Sigma), and a polyclonal rabbit anti-calbindin antibody (1:1000, Sigma). Sections were then rinsed 2 times in PBS and incubated for 3 h at room temperature in Alexa Fluor 594 and goat anti-rabbit immunoglobulin (H + L) for PV. The sections were then rinsed, mounted, and coverslipped using Vectashield mounting medium with 4′,6-diamidino-2-phenylindole (DAPI) or without DAPI. The immunofluorescent specimens were examined using an epifluorescence microscope (Carl Zeiss MicroImaging, Thornwood, NY) equipped with AxioCam digital color camera. Double or triple immunofluorescent images were analyzed using an AxioVision LE imaging suite (Carl Zeiss MicroImaging). Immunopositive cells were counted following the division of the PPC into 3 layers. Each layer had a defined area measured, and the number of immunopositive cells was quantified through visualized counting. Each count represents the average of at least 5 individually stained sections from separate brains. Confocal microscopy images were sampled using an upright Nikon E800 microscope and Bio-Rad Radiance 2100 image analysis software suit. Neurobiotin-labeled sections were incubated in 0.5% H2O2 in methanol for 40 min, PBS washed, incubated in PBS with 0.3% Triton X-100 and 0.2% bovine serum albumin for 2 h, and then incubated in ABC (avidin: biotinylated enzyme complex) kit (Vector Laboratories) overnight. The next day, after PBS rinsing, sections were incubated in DAB (Sigma, D-5905) in Tris buffer solution for 20 min, then rinsed in PBS, mounted, and coverslipped. The specimens were examined using a Zeiss Axioskope 2FS microscope under bright illumination. Individual cells were visualized under ×100 oil immersion objective and traced with Neurolucida.
Morphological Parameters
Three dimensional neuron models were reconstructed using the Neurolucida system (MicroBrightField, Williston, VT) and a brightfield light microscope (Carl Zeiss MicroImaging). Shrinkage was not corrected in this study. Neurons with poor or unclear labeling were discarded. Reconstructed neurons were quantitatively analyzed with NeuroExplorer (MicroBrightField). The following parameters were analyzed: dendritic/axonal length (microns): the sum of the lengths of each of the segments that compose the dendritic tree or axonal arborization. Dendritic/axonal volume (cubic microns): computed by modeling each piece of every dendritic branch or axonal arborization as a frustrum. Scholl analysis: involves placing of nested concentric spheres around the cell body. Each sphere of a specific radius describes the number of intersections, the length of the processes, the number of branch points, and the number of endings within that sphere. The results of each sphere are not cumulative. Dendrogram of axons and dendrites: stylized drawing of branched structures. The branches of the tree are represented with horizontal lines, whereas the branch points are represented by vertical lines. Only the horizontal axis is drawn to scale. Polar histogram of axons and dendrites: overall direction of axonal and dendritic growth, as represented by a directional histogram using pie-shaped wedges to describe values.
Axon and dendritic projection trajectory analysis was carried out using the polar histogram data mentioned above. Each polar histogram was oriented with regard to the pial surface, and each wedge was assigned a standardized numerical value, dependent upon its directionality. Polar histogram data for both axons and dendrites were converted from a circular directional histogram into a scatterplot with the standardized numerical directional value plotted to the “x” axis and process length (in microns) plotted to the “y” axis. Data were averaged from several polar histograms taken from the analysis of individual cells of each firing type. In addition, this allowed for a cross-correlation coefficient (CCC) to be determined for any potential overlap between dendritic and axonal processes.
Results
Whole-cell current-clamp recordings were performed in order to determine interneuron firing types. Due to a lack of interneuron grouping precedent within the PC, we utilized similar terminology to that used within the neocortex. Criteria for distinguishing cell firing types are described in Materials and methods.
Electrophysiology—Action Potentials
RSNP (Connors and Gutnick 1990) cells accounted for the majority (n = 51/106, 48%) of the recorded GFP-positive interneurons. This is in agreement with ratios found in rat frontal cortex (Kawaguchi and Kubota 1998). RSNP cells had action potentials with a fairly high spike adaptation ratio (0.60 ± 0.02, Table 1 and Fig. 1G) exhibited some heterogeneity in their firing patterns and differed significantly from the other 4 firing types in numerous electrophysiological parameters (Table 1). RSNP cells encompass a relatively wide physiological range in comparison to the other firing types (Fig. 1H). The F–I plot was very linear (Fig. 1A), and its slope was found to be intermediate to the other firing types (Fig. 1F).
LS cells (Kawaguchi 1995; Chu et al. 2003) accounted for the second largest (n = 24/106, 23%) group of recorded neurons. They possess a distinctive slow depolarizing ramp following low levels of current injection (Fig. 1B) that was not present within any of the other firing types. The least amount of electrophysiological variability occurred between the LS and IS cells (Table 1). Physiologically (Table 1), LS cells were more closely matched with the RSNP phenotype than that of the FS interneuron types (see Discussion). The F–I plot of LS cells had a curved appearance (reached a peak frequency and then declined, e.g., Fig. 1B). In addition, these cells required a higher level of current injection to elicit spiking (Fig. 1B,F). However, the calculated slope of this curve was found to be the lowest of the firing types (Fig. 1F).
IS cells (Cauli et al. 1997) accounted for the third largest (n = 19/106, 15%) group of recorded neurons. These cells were characterized by variable action potential discharges at low levels of current injection (Fig. 1C). As mentioned previously, IS and LS demonstrate the least amount of variability, among measured electrophysiological parameters, with a much greater degree of variation with the other 2 (RSNP and FS) cell types (Table 1). Selected comparison of half width versus initial frequency showed a tight clustered appearance, and some overlap with LS cells (Fig. 1H). The F–I plot (Fig. 1C) had a biphasic nature (rising initially, then falling slightly, and eventually rising again), and its initial rise slope was the second largest following FS cells (Fig. 1F).
FS cells (Kawaguchi 1995) accounted for the second smallest (n = 12/106) group of recorded neurons. These cells were characterized by high-frequency spiking, with limited adaptation (e.g., Fig. 1D) and short-spike half widths (Table 1, see Materials and methods for FS category criteria). The limited amount of adaptation of these cells was typically relegated to the first spikes of a train (Fig. 1D,G), falling off quickly afterward. By definition, FS cells exhibit electrophysiological parameters that are clearly segregated (i.e., statistically significant, see Table 1 and Fig. 1H) from the other 3 firing types. The F–I curve is linear in nature (Fig. 1D) but shows a much greater slope than any of the other firing types (Fig. 1F).
LTS cells (Kawaguchi 1993, 1995) accounted for the smallest (n = 2/106) group of recorded neurons. These cells were characterized by rebound spiking upon the application of hyperpolarizing current steps (Fig. 1E). Otherwise, their firing properties were nearly identical to the RSNP cells previously presented. Unlike some LTS cells found within the neocortex (Goldberg et al. 2004), these cells fired with individual spikes (Fig. 1E), with no sign of bursting properties. Due to the low representation of LTS cells in total GAD67-positive neurons, their inclusion is mostly for qualitative comparison. By layer, LTS neurons were distributed as follows: 0/2 in layer I, 1/2 in layer II, and 1/2 in layer III. Neither of the cells had sufficient dendritic and axonal processes to accurately quantify their morphology. LTS cells had firing properties in response to current steps that were similar to RSNP cells, other than the distinct rebound spiking found upon the application of hyperpolarizing current (Fig. 1E).
Excitatory Postsynaptic Currents
Following the stimulation of layer III associative fibers, we recorded evoked excitatory currents, as well as spontaneously occurring EPSCs. These procedures were performed in voltage-clamp mode, with the membrane potential held at −80 mV. The distance of the cell body from the stimulating electrode was a function of the laminar location of each cell, but every attempt was made to adjust the position of the electrode in order to standardize the proximity to the stimulated cell (∼200 to 300 μm).
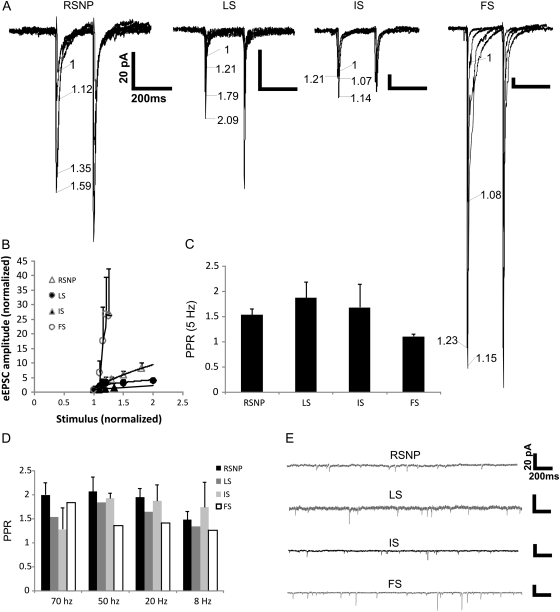
RSNP cells had several parameters from eEPSC and sEPSCs (see Materials and methods) that showed no significant differences between the other 3 firing types (Table 2). The input/output (I–O) plot indicates a steeper slope than both the IS and LS types and much smaller slope compared with FS cells (Fig. 2B). The PPR showed facilitation following 2 stimuli with a 200-ms (5 Hz) interval, but with no significant differences between the other firing types (Fig. 2C).
Figure 2.
Synaptic properties of PPC interneurons. Representative traces of eEPSCs from each of the cell firing types (A), the numbers represent the amount of extracellular stimulation applied to each trace, with “1” as the minimally suprathreshold stimulation and each consecutive number representing the normalized stimulation increase. An average of the input–output (I–O) curve (B) averaged from cells of each firing type (RSNP n = 5, LS n = 6, IS n = 3, FS n = 2). The PPR averaged from each firing type (RSNP n = 21, LS n = 10, IS n = 7, FS n = 4) represented in bar graph form (C). The PPR averaged from each firing type (RSNP n = 4, IS n = 3, LS n = 1, FS n = 1) at various interspike frequencies (D). Representative traces of spontaneous postsynaptic currents from each firing type (E). Scale bar applies to all traces.
We tested a small number of cells from each firing type to determine whether altering the interpulse frequency would result in an alteration in the observed PPR. There were no significant differences found over a broad range of frequencies (6–70 Hz) for both RSNP (n = 4) and IS (n = 3) cells (Fig. 2D). In addition, although limited to only one recorded cell each, both LS (n = 1) and FS (n = 1) cells (Fig. 2D) displayed values similar to those reported at 5 Hz (Fig. 2C).
LS cells had several parameters from eEPSC and sEPSCs that showed no significant differences between the other 3 firing types (Table 2). The I–O plot indicates a steeper slope than IS cells and a smaller slope compared with both RSNP and FS cells (Fig. 2B). Like RSNP cells, the LS cells’ PPR showed facilitation following 2 stimuli with a 200-ms interval, but with no significant differences between the other firing types (Fig. 2C).
IS cells showed no significant differences in measured synaptic properties between the other firing types (Table 2), and the I–O plot indicates the smallest slope compared with the other 3 firing types (Fig. 2B). Indeed, the curve was virtually flat compared with the other firing types’ slopes.
FS cells showed a significant difference in spontaneous excitatory synaptic properties, an increased sEPSC frequency (Fig. 2E and Table 2). As with the other firing types, there were no significant differences in the degree of paired-pulse facilitation seen between FS cells (Fig. 2C) and the other firing types. In addition, the I–O plot indicates a much steeper slope (Fig. 2B) when compared with the other firing types.
Morphology
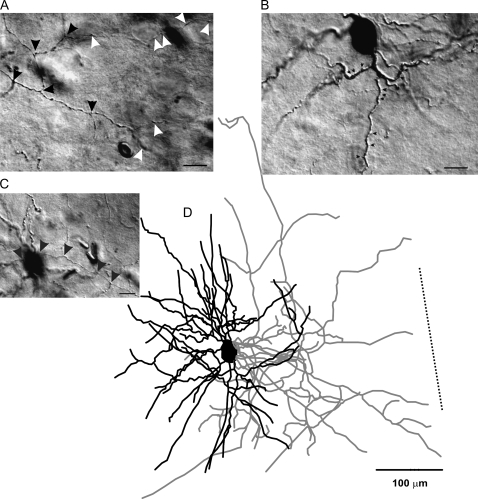
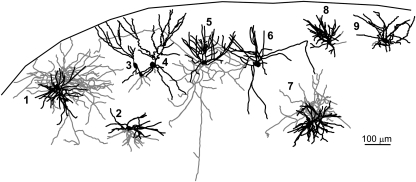
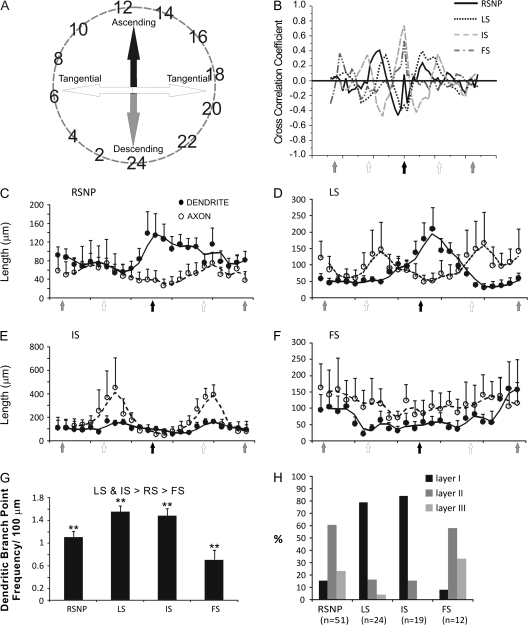
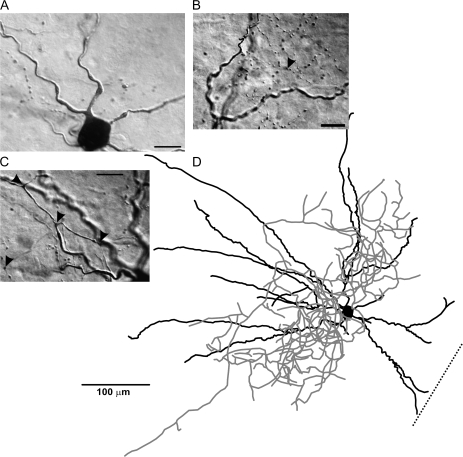
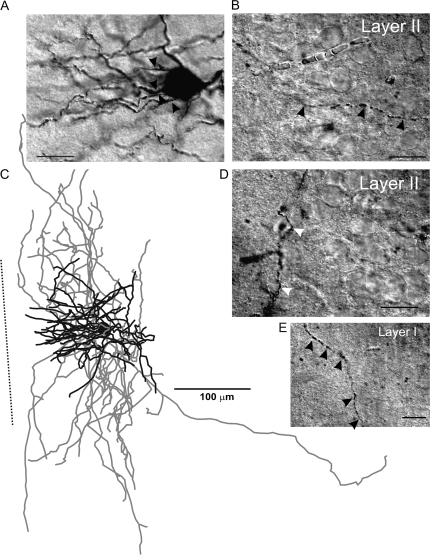
RSNP cells were found throughout all 3 layers of the PPC and showed a high degree of heterogeneity in morphology, in terms of axon and dendritic length, branching patterns, and the degree to which these processes were inter- or intralaminar (Figs 3 and 4). By layer, RSNP neurons were distributed as follows: 16% (8/51) in layer I, 61% (31/51) in layer II, and 23% (12/51) in layer III (Fig. 5H), possessing the greatest laminar variability of any of the firing types, but with the majority located within layer II. Eighteen (1 layer I, 12 layer II, and 5 layer III) cells were reconstructed and had their morphology analyzed. Five out of 18 cells, all found within the interface between layers I and II, were similar to the GAD65-GFP–positive interneurons previously identified by this laboratory (Zhang et al. 2006). Their stereotypical morphology (consisting of an ascending, single-tufted dendritic tree oriented in narrow clusters toward the pial surface and axons that projected at an opposite, usually descending, angle to the dendrites) and firing properties provide easy identification (e.g., Fig. 4, #3 and 4). Our data support an incomplete overlap between the GAD65- and GAD67-expressing cells within the PPC (see Additional immunohistochemistry results for further details). We found that there is much more morphological variability among the GAD67-positive, RSNP cells than what is seen within the putative GAD65 population alone (cf., Zhang et al. 2006). Four out of 18 cells with short, local axon and dendritic arbors confined to the same laminar location as the soma (e.g., Fig. 4, #2, 8, and 9) could be classified as the previously described neurogliaform type (see Discussion, e.g., Fig. 3D). The remaining (9/18) cells do not fit into either the neurogliaform or the GAD65 category, with one layer II RSNP cell exhibiting axons that travel for several hundred microns horizontally and into deeper PC layers and another with dendrites that extend into both layer I and layer III. Typically, RSNP cells had nonsmooth dendrites, some with spines (Fig. 3B, small arrowheads, Fig. 10B3), and 2 cells possessed axons that formed putative perisomatic synapses (Fig. 3A, white arrowheads). Upon examination of all RSNP cell processes, it was found that dendrites favored an orientation ascending toward the pial surface, whereas axons favored a more tangential (horizontal) orientation (Fig. 5C). Fourteen out of 18 cells had radial (perpendicular to pia) dendrites, whereas only 4/18 had tangential dendrites, and all 4 of these cells were found in lower layer II and upper layer III of the PPC. The CCC was highest in RSNP cells for tangentially oriented processes (Fig. 5B), suggesting that greatest overlap of axons and dendrites occurs within the horizontal plane where the dendrites were shortest and the axons longest (Fig. 5C). The axons of RSNP cells were the shortest (150 μm maximum, data not shown) and showed a wide variety of morphological characteristics including ascending, descending, and tangential orientations when compared with the other firing types (Fig. 4). Their dendrites showed the second smallest branch point frequency (Fig. 5G), a measure of process complexity.
Figure 3.
RSNP interneuron of the PPC. A typical example of a Neurolucida reconstruction of an RSNP cell (D). Dendrites (black lines, for all figures) and axons (gray lines, for all figures) showed a neurogliaform-like morphology. Scale bar in (A, B, C) = 20 μm. (A, C) Highlight the unique axonal morphology found in these cells. Axons with distinct puncta were visible (black arrowheads), as well as putative perisomatic contacts (white arrowheads). Spines (B, small black arrowheads) were also visible on some of the larger dendritic processes. Dotted line in panel (D) represents the orientation toward the pial surface, but the distance to the cell is not represented to scale (for Fig. 1–4). The spiking patterns for this cell are represented in Figure 1A. Scale bar in (D) = 100 μm.
Figure 4.
Morphological diversity of RSNP interneurons within the PPC. Stylized slice showing the location and morphology of RSNP PPC interneurons. Scale bar = 100 μm.
Figure 5.
Interneuron axon and dendritic projection trajectory analysis. This figure was derived from the axonal and dendritic polar histogram data from cells of the 4 firing types that were morphologically reconstructed. Data, which, originally appeared in a circular fashion (A, see Materials and methods) were converted to 2 column data sets with the angular value representing the “X” axis and axonal (or dendritic) length representing the “Y” axis. The data from same group of interneurons were then averaged and analyzed. Open circles represent axons, and closed circles represent dendrites. The cell types include: RSNP (C), LS (D), IS (E), and FS cells (F). The CCC for each of the 4 firing types (B) indicates that the greater the CCC value for a given direction the greater the overlap between axons and dendrites for that direction. Note that dendrites and axons of IS cells (gray dashed line) had the largest CCC value toward the pial surface (black arrow in X axis), indicating that their axons and dendrites overlap the most when ascending, but the longest projections (but with less overlap) for both axons and dendrites occur tangentially (E). A bar graph indicates the average dendritic node frequency for each of the 4 firing types (G). Firing types were also segregated by their percentage per laminar location (H). **P < 0.01.
Figure 8.
FS interneuron of the PPC. A typical example of a Neurolucida reconstruction of a FS cell (D). The dendrites of FS cells were typically aspiny or smooth in appearance (A), and the axons typically showed numerous boutons (A, B) and enlargements at branching points (C). The spiking patterns for this cell are represented in Figure 1D. Scale bar in panel (D) = 100 μm. Scale bars in panels (A, B, C) = 15 μm.
Figure 9.
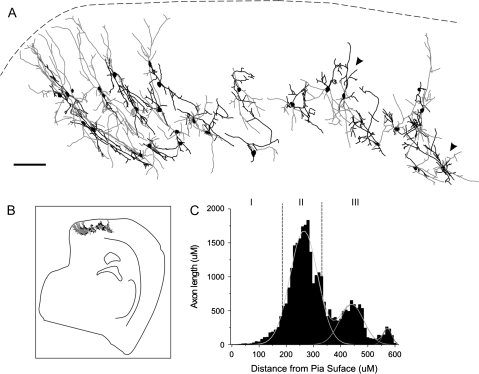
PV-positive interneurons within the PPC. Stylized slice showing reconstructed PV-positive cells found throughout the PPC (A). Dendrites are shown in black and axons in gray. These cells share anatomical characteristics with the recorded and reconstructed FS cells. Stylized low-magnification whole slice of the PPC, indicating cellular location (B). Axon length plotted against the distance from the pial surface (C) indicates the laminar distribution of PV-positive interneuron axons in the PPC. Scale bar = 100 μm.
Figure 10.
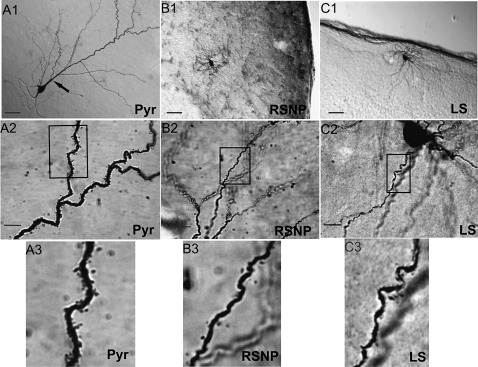
Three physiologically identified spiny neurons within the PPC. DAB-stained photomicrographs from 3 PPC neuron cell types: a layer II PYR (A), layer III RSNP (B), and layer I LS (C) cells were obtained with a light microscope using a ×20 objective (A1, B1, C1) or a ×100 oil immersion objective (A2, B2, C2), with the rectangle in these latter panels indicating the area of dendrites highlighted in the final panel (A3, B3, C3). Scale bar = 50 μm in (A1, B1, C1). Scale bar = 10 μm in (A2, B2, C2). Note the large apical dendritic trunk indicated by the black arrow (A1) and the high density of dendritic spines (A3) found on PYR cells.
LS cells were found predominantly in the upper 2 layers of the PC. By layer, LS neurons were distributed as follows: 79% (19/24) in layer I, 17% (4/24) in layer II, and 4% (1/24) in layer III (Fig. 5H). Eleven cells (8 layer I and 3 layer II) were reconstructed and had their morphology analyzed (e.g., Figs 5D and 6). LS cells could be characterized either as neurogliaform cells (4/11), with extremely local (intralaminar) axons and dendrites, or as cells with lengthy, interlaminar ascending and descending dendritic trees and lengthy, tangential and descending interlaminar axons (5/11). The remaining 2 cells possessed a combination of short, intralaminar dendrites, coupled with long, interlaminar, tangential, and descending axons (Fig. 6C). Axons possessed visible synaptic boutons (Fig. 6B,E) and the occasional putative perisomatic synapse (Fig. 6D, white arrowhead). Dendrites, on average, were ascending, whereas axons were tangential (Fig. 5D). When visible, axons often had straight terminal branches (6/11), whereas a single layer I neurogliaform cell exhibited curved terminal branches. Typically, LS cells had dendrites that left the soma in clustered groups and these processes occasionally presented with a nonsmooth or sparsely spiny appearance (Fig. 6A). The CCC was highest in LS cells for an orientation between horizontal and ascending (Fig. 5B), but, in general, there was little overlap between axonal and dendritic processes (Fig. 5D). LS cells (along with IS cells) showed the greatest dendritic branch point frequency (Fig. 5G), as well as long axons (210 μm maximum, data not shown).
Figure 6.
LS interneuron of the PPC. A typical example of a Neurolucida reconstruction of an LS cell (C). The dendrites leave the cell body in clustered groups (A, black arrowhead), and the axons show distinct boutons present within both layer I (E) and layer II (B, D), with putative perisomatic synapses being formed rarely (D, white arrowheads). The spiking patterns for this cell are represented in Figure 1B. Scale bars in (A, B, D, E) = 20 μm; Scale bar in (C) = 100 μm.
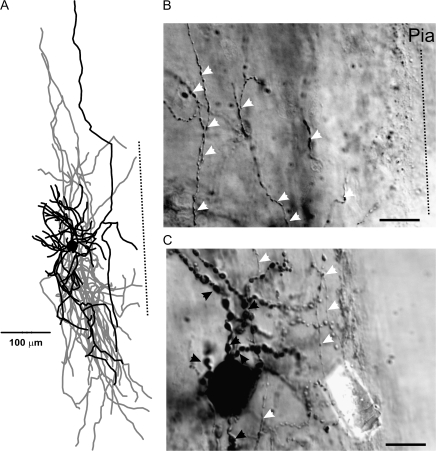
The majority of IS neurons were distributed in layer I (84%, 16/19), 16% (3/19) were found in layer II, and no IS cells were found within layer III (Fig. 5H). Thus, these cells possessed the most homogenous laminar position of all the cell types. 5 (4 layer I and 1 layer II) cells were reconstructed and had their morphology analyzed. IS cells had a consistent directional distribution for both its processes. Axons and dendrites were oriented tangentially (Figs 5E and 7A), with the CCC being highest at this same orientation (Fig. 5B). Four out of 5 cells had ascending dendrites, only one of which (layer II cell) was interlaminar. Four out of 5 cells had tangentially oriented dendrites (excluding the layer II cell) of extremely long length. Axons were the longest of any of the firing types examined (500 μm maximum, data not shown). All 5 cells had axons that had curved terminal branches, and 2/5 cells also showed axon terminal branch clustering. Four out of 5 cells had descending axons, which in all cases were interlaminar. One out of 5 of the reconstructed cells (and the only cell from layer II) demonstrated a “reverse” orientation, not found in the other cells, with exclusively radial axons and dendrites. Axons showed numerous boutons throughout the extent of the arborization (Fig. 7B, white arrowheads). IS cell dendrites typically had a beaded appearance (Fig. 7C, black arrowheads), with both large and smaller diameter processes showing profuse dendritic swellings (Fig. 7C).
Figure 7.
IS interneuron of the PPC. A typical example of a Neurolucida reconstruction of an IS cell (A). Dendrites present a large beaded appearance, with numerous swellings (black arrowheads) along the extent of the processes. Axons possess numerous boutons (white arrowheads, C) at both proximal (C) and distal (B) locations from the cell body. The spiking patterns for this cell are represented in Figure 1C. Scale bar in panel (A) = 100 μm. Scale bars in panels (B, C) = 20 μm.
By layer, FS neurons were distributed as follows: 8% (1/12) in layer I, 58% (7/12) in layer II, and 33% (4/12) in layer III (Fig. 5H). Five cells (2 layer II and 3 layer III) were reconstructed and had their morphology analyzed. Unlike any of the previous firing types, the majority of FS cell somas were round in appearance (4/5). Five out of 5 cells possessed descending dendrites and 3/5 possessed ascending dendrites, with only 1/5 cells displaying tangential dendrites. FS cells typically possessed very smooth dendrites (Fig. 8A). The primary and secondary axon branches of FS cells had very large diameters (Fig. 8C). However, at higher order branches (near the terminals), the diameter of the axon reduced drastically. Synaptic boutons can be seen in very large densities (Fig. 8B). FS cells displayed an almost equal distribution for all directions in both axonal and dendritic processes (Fig. 5F), with a high CCC for the ascending and descending orientations (Fig. 5B), which, in turn, corresponded with the greatest process lengths (Fig. 5F). Four out of 5 FS cells possessed tangentially oriented axons and 5/5 had both ascending and descending axons. The axon terminals possess abundant synaptic boutons and branches that are curved (3/5), clustered (1/5), and situated in close proximity to putative PYR cells (Fig. 8B, black arrowhead). Surprisingly, FS cells had the lowest dendritic branch point frequency of all the cell types (Fig. 5G), indicating the least amount of branching complexity, and an axon length that was found to be intermediate to the other firing types (210 μm, data not shown). FS cell morphology closely matched that seen among PV-positive neurons of the PC (Fig. 9), in that their processes (both axons and dendrites) were oftentimes oriented in a vertical direction and their laminar location was mostly restricted to deep layer II and below. To compare the morphology of FS cells and PV cells, we reconstructed a large number of PV cells from brain sections stained for PV–immunoreactivity (Fig. 9A). The projection trajectory of PV-positive cells appears to be perpendicular to the pia surface but does not differentiate between ascending and descending projections (Fig. 9). Indeed, the axon and dendritic trajectory of FS cells (Fig. 5F) is the only group of cells that showed a similar distribution pattern with PV cells (Fig. 9). The reconstructed FS cells had descending projections toward the white matter, although there were also substantial projections toward the pia surface. Carefully examining individual cells, we have found that some PV-immunoreactive cells (see Additional immunohistochemistry) and FS cells show very similar axon and dendritic patterns (e.g., Fig. 8 vs. cells marked by arrowheads in Fig. 9A). In addition, PV cells exhibited a high density of perisomatic boutons (not shown), which were similar to FS cells (e.g., Fig. 8B, black arrowhead). In the neocortex, interneurons expressing PV exhibited FS firing phenotypes (Kawaguchi and Kubota 1993).
Additional information about the physiological and morphological characteristics of 4 of the aforementioned firing types was analyzed. The axonal branch point frequency was not found to be significantly different for any of the 4 firing types (data not shown), which is in opposition to dendrites that show significant differences between the majority of the firing types (Fig. 5G). In addition, the total number of primary dendrites for each of the cell types showed no significant differences (data not shown), with 35/39 cells from all firing types exhibiting a multipolar dendritic appearance. The overall distribution of axon lengths (as determined by Scholl analysis) was very similar between all 4 groups (data not shown).
Because RSNP cells and PYR cells within the PPC display similarities in their firing patterns in response to depolarizing current steps, we performed additional analysis in order to confirm the non-PYR nature of RSNP cells. We recorded from 21 PYR cells within the PPC and applied the same data analysis to these cells that was previously performed on the non-PYR cells. It was found that there were significant differences in action potential electrophysiology between PYR and RSNP cells. The maximum steady-state frequency was found to be significantly (P < 0.01) smaller in PYR cells (PYR: 26.3 ± 1.50 Hz vs. RSNP: 45.6 ± 1.42 Hz), and the membrane time constant was found to be significantly (P <0.01) larger in PYR cells (PYR: 25.4 ± 2.34 ms vs. RSNP: 16.3 ± 1.00 ms).
In addition to the electrophysiological differences between PYR and RSNP cells, morphological differences were also evident. Other than the most obvious gross morphological differences between these groups (PYR cells typically possess long apical dendrites, whereas RSNP cells have a neurogliaform, local process morphology) (see Fig. 3), the dendritic branch point frequency per 100 μm (see Fig. 5G) was also found to be significantly (P <0.01) different (PYR: 0.58 ± 0.12 vs. RSNP: 1.11 ± 0.10). We also compared the spine density from 2 of our non-PYR firing types (RSNP and LS) to the spine density of PYR cells (see Fig. 10). For cells that possessed spines, there was a significant (P <0.01) difference between the spine densities of all 3 groups, with PYR cells possessing the highest density (spines per micron of dendrite) by far (PYR: 0.336 ± 0.05 vs. RSNP: 0.110 ± 0.02 vs. LS: 0.035 ± 0.02).
Additional Immunohistochemistry
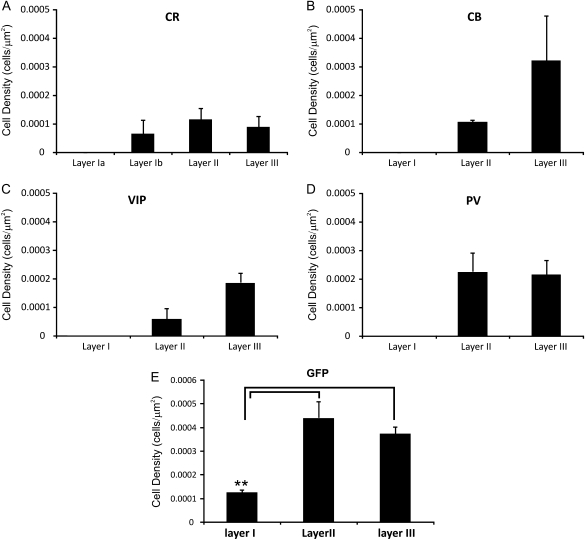
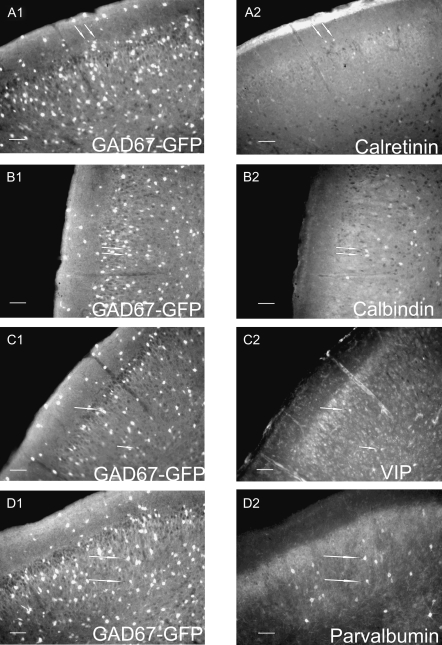
Overall, only a relatively small number of immunopositive cells were found among the physiologically and morphologically verified cells of the PPC. This result is consistent with previous studies of GAD65–GFP neurons in our laboratory (Zhang et al. 2006). However, upon staining for various molecular markers, a marked laminar distribution became evident (Fig. 11). Cell counts were quantified (see Materials and methods) using whole-brain slices stained for the various molecular markers, where the intrinsic GFP signal could be utilized to confirm the GABAergic nature of the cells (Fig. 12). We initially stained GAD67–GFP cells for GABA and found that 92% of GAD67–GFP cells stained positively for GABA, whereas 96% of GABAergic cells were GAD67–GFP cells (data not shown). This is similar to what was observed within the neocortex (Tamamaki et al. 2003).
Figure 11.
Cell density of immunopositive interneurons by laminar location. Bar graph representation of the number of immunopositive cells found in each layer of the PPC following staining for CR (A), calbindin (B), VIP (C), PV (D), and GFP (E).
Figure 12.
Fluorescent microscopy images of immunopositive interneurons. Whole-brain slices (50 μm) used for quantitative analysis and demonstrating intrinsic GAD67–GFP signal (A1, B1, C1, D1) and immunoreactivity for various molecular markers including CR (A2), calbindin (B2), VIP (C2), and PV (D2). White arrows are used to identify cells demonstrating coexpression. Scale bars = 100 μm.
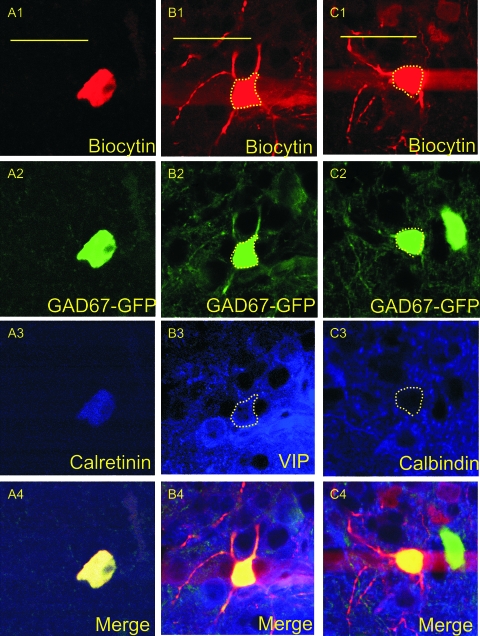
Twenty percent of IS cells stained for CR were found to be immunopositive (Fig. 13A), although this low percentage may be due to the unique background staining profile found within the PPC for CR (see Discussion). All 3 layers demonstrated low levels of CR staining (Fig. 12A2). This was the only molecular marker used in this study that showed any layer I immunoreactivity.
Figure 13.
Confocal microscopy images of immunopositive interneurons. Images were obtained using a ×60 objective and represent a single cell that was triple stained for neurobiotin (A1, B1, C1), GFP (A2, B2, C2), and CR (A3), VIP (B3), or calbindin (C3). The final panels represent the above 3 images merged together (A4, B4, C4). (A1–A4) are from an IS cell found in layer I-B of the PPC, (B1–B4) are from an RSNP cell found in layer II, and (C1–C4) are from an RSNP cell in layer II that was found to show no immunoreactivity for calbindin. Scale bar = 50 μm.
Thirty-three percent of RSNP cells stained for VIP were found to be immunopositive (Fig. 13B), whereas none of the tested calcium-binding proteins (i.e., PV, CR, and calbindin [CB]) showed immunoreactivity from recorded RSNP cells. VIP staining was found only in layers II and III at low levels (Fig. 11C). A layer II, RSNP cell that was found to be immunonegative for calbindin is provided for the sake of comparison (Fig. 13C).
None of the recorded LS cells were found to be immunopositive for VIP or the calcium-binding proteins. LS cells may contain CR or a molecular marker not tested for in this research because, as previously noted, layer I (where the majority of LS cells were found, Fig. 5H) only had CR staining present (Figs 11 and 12A2).
None of the recorded FS cells were found to be immunopositive for VIP or the calcium-binding proteins. However, FS cell morphology closely matched that seen among PV-positive neurons of the PC (Fig. 9), in that their processes (both axons and dendrites) were oftentimes oriented in a vertical direction and their laminar location was mostly restricted to deep layer II and below (refer to Morphology in Results)
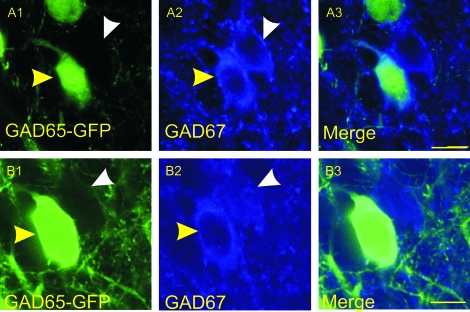
Along with the previous molecular markers, we also stained brain sections obtained from GAD65–GFP mice (Zhang et al. 2006) with monoclonal antibodies for GAD67 in order to determine the amount of overlap between these groups of cells. We found that most GAD65–GFP cells were also immunopositive for GAD67 (Fig. 14, yellow arrowheads), whereas there were a number of GAD67 cells that did not express GAD65–GFP (Fig. 14, white arrowheads).
Figure 14.
Confocal microscopy images of GAD65–GFP cells stained for GAD67. Images were obtained using a ×60 objective and represent cells obtained from a GAD65–GFP mouse and stained for GAD67. The intrinsic GAD65–GFP signal is represented (A1, B1), as well as GAD67-immunopositive cells (A2, B2), along with merged image (A3, B3). Cells that coexpress GAD65 and GAD67 are indicated by yellow arrowheads, whereas cells that express GAD67 with no apparent GAD65 signal are indicated by white arrowheads. Scale bar = 25 μm.
Discussion
The ability to predict or model the information processing capabilities of any given cortical network is directly correlated with an understanding of its underlying circuitry. Whereas principal cells of the PC have been well characterized (Biedenbach and Stevens 1966; Bower and Haberly 1986; Barkai and Hasselmo 1994; Kapur et al. 1997; Suzuki and Bekkers 2006), their non-PYR counterparts remain elusive. Although anatomical (Haberly 1983) and electrophysiological studies provide compelling results about inhibitory inputs in PYR neurons (Tseng and Haberly 1989; Kapur et al. 1997), a thorough survey of the physiological and anatomical features of GABAergic cells has been absent from the literature. In this study, we divide PPC interneurons into groups based upon their firing properties. Within each firing group, there was a good correlation between morphology and cytoarchitecture. Comparisons between each firing group revealed several morphological properties that were found to be different. This segregation of morphological properties with firing types has some similarities to neocortical inhibitory networks (Connors and Gutnick 1990; Kawaguchi and Kubota 1993, 1998; Kawaguchi 1995; Cauli et al. 1997). For example, in the frontal cortex of rat, non-PYR cells within each physiological firing class showed a characteristic set of vertical and horizontal axon branching and bouton distribution patterns (Karube et al. 2004). Similar patterns were also found in the PPC (e.g., Figs 3 and 5–8). The intrinsic, synaptic, and anatomical properties of PC neurons have been examined (Satou et al. 1983; Haberly et al. 1987; Protopapas and Bower 2000; Ekstrand et al. 2001); however, to our knowledge, this is the first account of the electrophysiological and anatomical properties of genetically verified GABAergic cells within the mouse PPC.
Inter- and Intraspecies Comparison of PC Non-PYR Neurons
Similarities were observed between the non-PYR cell types in the mouse PPC and those found in the opossum PC (Haberly 1983). Layer I cells in the opossum are morphologically variable and mostly non-PYR (Haberly 1983). This variability holds true in the mouse PPC as well (Fig. 5H). The horizontal spiny soma cells described in the opossum (Haberly 1983) correspond well with the IS cell of our study (Figs 5E and 7). Haberly also noted the appearance of “smooth cells” (Haberly 1983). These cells are thought to resemble “neurogliaform” cells (Cajal 1911; Kisvarday et al. 1990; Kawaguchi 1995; Hestrin and Armstrong 1996; Kawaguchi and Kubota 1998). In this study, layer I neurogliaform cells are associated with RSNP and LS cells (Figs 3 and 6). As opposed to opossum, some PPC neurogliaform cells possessed spines (e.g., Fig. 3B). Layer I in the rat cortex model (Hestrin and Armstrong 1996; Zhou and Hablitz 1996) demonstrates similarities to mouse PPC. In visual and somatosensory cortices, LS cells possess a neurogliaform-like morphology, in addition to cells with long, descending axons (Chu et al. 2003). These anatomical types were found in layer I, although in PPC some cells with long, descending axons possessed an LS phenotype while others possessed an IS phenotype. Indeed, Chu et al. (2003) report a firing pattern in long-axon neurons similar to IS cells (e.g., Fig. 1C).
The majority of our total recorded interneurons had soma in layer II, and 5 firing types were represented (Fig. 1). The cell density of layer II, GAD67-positive cells was higher than layer I (Fig. 11E). Layer II of opossum PC contains neurogliaform cells and cells possessing complex dendritic appendages (Haberly 1983). We confirmed the presence of neurogliaform cells, all of which were RSNP cells (Fig. 3). In addition, a majority (Fig. 5H) of the recorded FS cells were present within deep layer II. Comparing FS cells with reconstructed PV cells, we found that the morphology of FS cells resembles PV-positive cells (Fig. 9), similar to neocortex, where PV cells exhibited FS firing (Kawaguchi and Kubota 1993). GAD65 neurons (Zhang et al. 2006) were found at the layer junction between I and II (Zhang et al. 2006). Additionally, there are layer II RSNP cells that exhibit a unique morphology within layer II, not previously identified (see Results). Layer III was dominated by RSNP and FS cells (Figs 3 and 8) and showed similar anatomical variability and cell density (Fig. 11E) to layer II. The neurogliaform cell was present within this layer, and the smooth cells as Haberly (1983) describes appear similar to FS cells characterized in the present study (Fig. 8).
Electrophysiology of Non-PYR Neurons
It was previously unknown whether the 5 firing types (RSNP, LS, IS, FS, and LTS) described in neocortical and subcortical regions (Connors and Gutnick 1990; Kawaguchi 1995; Cauli et al. 1997) exist within the PC. We have confirmed the existence of these 5 firing types, and, in addition, within the PPC, there was a segregation of firing types into particular layers (Fig. 5H). Layer I was heavily skewed toward LS and IS cells (Figs 5H, 6, and 7). Beyond their layer specificity, the LS and IS firing types have the smallest differences in measured electrophysiological parameters (Table 1), indicating that these cell types possess a close relationship in terms of ion channel expression (cf., Cauli et al. 1997). A large percentage of our recorded cells were RSNP cells (Figs 3 and 5H), possessing great morphological and laminar diversity (Fig. 4). A surprising finding was the fAHP in 4 of the interneuron firing types (Table 1). LS and IS cells showed significantly (P < 0.01) larger fAHPs than any of the other cell types (i.e., Fig. 1B,C). Eleven parameters displaying intergroup variations provide further validation of our grouping method.
Layer I once again provides an opportunity for meaningful comparisons between PC and neocortex. Zhou and Hablitz (1996) examined electrophysiological properties of layer I neurons in rat frontal cortex. Their findings indicated that layer I neurons had firing patterns similar to FS phenotypes (Zhou and Hablitz 1996). However, only one FS cell was found in PPC layer I (Fig. 5H), and, tellingly, the half width, maximum rise slope, decay slope 90–10, and maximum steady-state frequency of LS and IS cells show no differences with RSNP cells but significant differences with FS cells (Table 1). Each firing type shows a unique F–I curve (Fig. 1A–E), including the initial slope (Fig. 1F). Unlike neocortical FS cells, PPC FS cells had a smaller fAHP compared with the other firing types (Table 1), and the input resistance of FS cells was not the smallest of the various firing types (Table 1), unlike the neocortex (Cauli et al. 1997). In addition, our reported steady-state maximum frequency has a very similar mean value (98.7 ± 4.12 Hz) to that reported in neocortical FS cells (104 ± 25 Hz) (Cauli et al. 1997). Although none of the FS cells we recorded from demonstrated a “bursting” phenotype (Chang and Luebke 2007), it is possible that our IS cells fit into this category. We also recorded sEPSC and eEPSC from 44 and 61 cells, respectively, finding a difference in the frequency of sEPSCs between FS cells and the other 3 firing types (Table 2 and Fig. 2). This is in marked contrast to results from recordings in the neocortex and hippocampus, where both short- and long-term properties of glutamatergic synapses exhibited greater target specificity (Reyes et al. 1998; Toth and McBain 2000). Our results indicate a distinct homogeneity in excitatory inputs onto PC non-PYR cells and reflect the relative evolutionary status of the PC, highlighting circuitry arranged with less complexity in the paleocortex.
Molecular Composition of Non-PYR Neurons
In an earlier study, Zhang et al. (2006) demonstrated a lack of calcium-binding proteins (CR, CB, and PV) in layer II GAD65–GFP cells. In the GAD67–GFP mouse, we also found that overall there was a low level (Figs 11 and 12) of immunoreactivity for all the antibodies tested (see Materials and methods). Layer I provides an interesting example in that the only staining present was for CR and the only firing type labeled was for IS cells (Fig. 13A). However, there was an overabundance of CR-positive process labeling (most likely afferent axons, see Fig. 12A2) in layer I-A (near the pial surface), which would tend to obscure a number of the cells recorded from this layer. Indeed, we only successfully observed labeling from layer I-B, near the interface of layer II (Fig. 12A2, white arrows). Because the majority of layer I cells fall into the IS and LS firing types (Fig. 5H), it is clear that IS cells express CR, whereas LS cells may express CR or additional proteins not examined in this study. In addition, only a small percentage of RSNP cells showed VIP immunoreactivity (Fig. 13B) and were devoid of staining from any of the calcium-binding proteins used in this study. These results are similar to those reported for GAD65–GFP interneurons in the PPC (Zhang et al. 2006), which demonstrated a lack of immunopositive staining for several molecular markers. Although there were striking similarities between FS cells and PV-positive cells in layer II/III (see Results; Figs 8, 9, and 12D2), none of the recorded FS cells (n = 12) were immunoreactive for PV, suggesting that many FS cells do not express PV. It is unclear what firing pattern PV-positive cells possess, although it is likely that they are FS cells. Immunohistochemical results support the idea that GAD65 cells are a specific subgroup within the larger population of GAD67-immunopositive cells. Indeed, whereas the vast majority of GAD65-GFP–positive cells are immunopositive for GAD67, there are numerous GAD67 cells that show no discernable GAD65 signal (Fig. 14). These results complement the earlier work of this laboratory in characterizing the extremely homogenous electrophysiological and morphological properties of GAD65 cells (Zhang et al. 2006). As previously reported by our laboratory, GAD65–GFP cells are exclusively RSNP cells, typically found in the more superficial section of layer II, and possess a stereotypical morphology (ascending, single-tufted dendritic tree, with a typically descending axonal projection). There is strong evidence from our current study that a percentage of the GAD67–GFP RSNP cells we recorded from fit the previously elucidated criteria for the GAD65–GFP phenotype. It is unclear whether their differential expression of GAD67 was due to delayed developmental maturation or suppression by unknown state-dependent processes. This can be addressed with future developmental and longevity studies of the GAD65–GFP neurons. There was an overall low expression for all the calcium-binding proteins tested, and additional molecular markers have been shown to aid in subdividing non-PYR cells in other brain areas (Kawaguchi and Kubota 1993, 1998; Kawaguchi 1995). However, as with all parameters surrounding cortical interneuron identification, it is unclear whether additional means of interneuron separation aid or obfuscate (Monyer and Markram 2004; Yuste 2005) the desired goal of clearly defined subpopulations.
Functional Implications
All afferent olfactory information from the periphery enters the PC within the superficial portion of layer I, synapsing onto the distal apical dendrites of layer II PYR cells. Associative (inter/intracortical and subcortical projections) input is relegated to synapses onto layer I-B proximal dendrites and deeper PC layers, with a large number of these synapses occupying layers II and III (Luskin and Price 1983). This associative network is thought to be especially important in the PPC because the anterior PC receives the majority of direct afferent input from the lateral olfactory tract.
The interneurons of layer I, similar to their neocortical counterparts, are either neurogliaform cells with RSNP or LS firing phenotypes or long process, horizontal cells with LS or IS firing phenotypes (Hestrin and Armstrong 1996; Zhou and Hablitz 1996). IS cells in particular are poised to provide feedforward inhibition to apical dendrites of PYR cells, spread across the extent of the PPC, while receiving input from both olfactory afferents and associational fibers found in layer I-B, possibly involved in coordinating these inputs. There are also reports of a relatively fast, dendritic inhibition occurring at distal segments of apical dendrites (Kanter et al. 1996) that IS cells, in particular, may be involved in. LS cells could be operating in either a more constricted dendritic and axonal arborization scheme or with axons that descend to deep layers of the PC. LS cells with local processes would have influence over afferent information that may have contributed to the same interneuron's activation. LS cells, with their slow ramp depolarization, would only be activated by continuous or high levels of activation, perhaps allowing these cells to function as a “brake” for afferent olfactory signals.
FS cells were found in layers II and III and possess far-reaching axons and dendrites that are often oriented in a vertical direction. In addition, the steep I–O curve (Fig. 2B) and high-frequency sEPSC (Fig. 2E) indicate an interneuronal population that is readily activated and receiving more inputs than the other firing types. These cells have the potential to powerfully control both superficial and deep PYR cells through perisomatic inhibition, due to the large number of putative synapses they form. FS cells may be activated directly from afferent olfactory signals, though their lack of long ascending dendrites and possession of long descending dendritic projections (Fig. 5F) indicate that they are likely activated through associational fibers, providing a role in feedback inhibition to restrain concurrent excitability.
Clearly, the confined nature of RSNP cell axons and dendrites implies that they function as local inhibitors, with the majority of these interneurons in close proximity to PYR cell bodies and initial (proximal) processes. Further work will be necessary in order to determine whether there are unique subsets of RSNP cells within the PPC. It was previously proposed that neurogliaform cells found throughout all 3 layers may share functional properties (Haberly 1983). Most of the RSNP cells within layer II would be activated by associational fibers and possibly by PYR cell axons that extend toward the pial surface (Haberly 2001; Wilson 2001). Additionally, there is a strong possibility that these interneurons are involved in a recently elucidated feedforward mechanism involved in olfactory signal integration at the level of the cortex (Luna and Schoppa 2008). Clearly, the confined nature of RSNP cell axons and dendrites implies that they function as local inhibitors, with the majority of these interneurons in close proximity to PYR cell bodies and initial (proximal) processes. Additional data comparing RSNP cells with PYR cells, when combined with the GFP labeling of GABAergic cells, provide further evidence that RSNP cells are local interneurons, not mislabeled PYR cells. These results also provide a means for separating the 2, electrophysiologically similar, cell types when there is a lack of a specific genetic marker for GABAergic cells.
This study is the first of its kind to carefully document the morphological, electrophysiological, and molecular characteristics of the local GABAergic circuitry of the PPC. Although our understanding of how the PC synthesizes the myriad chemical signals from the periphery into a unified olfactory perception is still unclear, this study advances our understanding of the principle cellular inhibitory components involved. The unique nature of the PC and the sensory information it receives lend importance to this study not only for the elucidation of cortical circuit function in general but also specifically to clarify the intrinsic organization of the olfactory cortex. Future work will be required to fully elucidate the functional role of these cells, either through the use of paired electrophysiological recordings or through in vivo recording during natural odorant stimulation coupled with careful anatomical reconstruction.
Funding
National Institutes of Health (NS057415, RR15640).
Acknowledgments
We thank Dr Yuchio Yanagawa for the generous gift of GAD67–GFP mice and Dr Gábor Szabó for the generous gift of GAD65–GFP mice. We thank Ms Chunzhao Zhang for excellent assistance in immunohistological processing. Conflict of Interest: None declared.
References
- Ascoli GA, Alonso-Nanclares L, Anderson SA, Barrionuevo G, Benavides-Piccione R, Burkhalter A, Buzsaki G, Cauli B, Defelipe J, Fairen A, et al. Petilla terminology: nomenclature of features of GABAergic interneurons of the cerebral cortex. Nat Rev Neurosci. 2008;9:557–568. doi: 10.1038/nrn2402. [DOI] [PMC free article] [PubMed] [Google Scholar]
- Barkai E, Hasselmo ME. Modulation of the input/output function of rat piriform cortex pyramidal cells. J Neurophysiol. 1994;72:644–658. doi: 10.1152/jn.1994.72.2.644. [DOI] [PubMed] [Google Scholar]
- Biedenbach MA, Stevens CF. Intracellular postsynaptic potentials and location of synapses in pyramidal cells of the cat olfactory cortex. Nature. 1966;212:361–362. doi: 10.1038/212361a0. [DOI] [PubMed] [Google Scholar]
- Biedenbach MA, Stevens CF. Synaptic organization of cat olfactory cortex as revealed by intracellular recording. J Neurophysiol. 1969;32:204–214. doi: 10.1152/jn.1969.32.2.204. [DOI] [PubMed] [Google Scholar]
- Bower JM, Haberly LB. Facilitating and nonfacilitating synapses on pyramidal cells: a correlation between physiology and morphology. Proc Natl Acad Sci USA. 1986;83:1115–1119. doi: 10.1073/pnas.83.4.1115. [DOI] [PMC free article] [PubMed] [Google Scholar]
- Cajal SRy. Histology of the nervous system of man and vertebrates. Translated by Swanson N, Swanson LW. New York: Oxford University Press, 1955. 1911 Originally published as histologie du système nerveux de l'homme et des vertebras (Paris: Maloine.) [Google Scholar]
- Cauli B, Audinat E, Lambolez B, Angulo MC, Ropert N, Tsuzuki K, Hestrin S, Rossier J. Molecular and physiological diversity of cortical nonpyramidal cells. J Neurosci. 1997;17:3894–3906. doi: 10.1523/JNEUROSCI.17-10-03894.1997. [DOI] [PMC free article] [PubMed] [Google Scholar]
- Chang YM, Luebke JI. Electrophysiological diversity of layer 5 pyramidal cells in the prefrontal cortex of the rhesus monkey: in vitro slice studies. J Neurophysiol. 2007;98:2622–2632. doi: 10.1152/jn.00585.2007. [DOI] [PMC free article] [PubMed] [Google Scholar]
- Chu Z, Galarreta M, Hestrin S. Synaptic interactions of late-spiking neocortical neurons in layer 1. J Neurosci. 2003;23:96–102. doi: 10.1523/JNEUROSCI.23-01-00096.2003. [DOI] [PMC free article] [PubMed] [Google Scholar]
- Connors BW, Gutnick MJ. Intrinsic firing patterns of diverse neocortical neurons. Trends Neurosci. 1990;13:99–104. doi: 10.1016/0166-2236(90)90185-d. [DOI] [PubMed] [Google Scholar]
- de Curtis M, Biella G, Forti M. Epileptiform activity in the piriform cortex of the in vitro isolated guinea pig brain preparation. Epilepsy Res. 1996;26:75–80. doi: 10.1016/s0920-1211(96)00042-3. [DOI] [PubMed] [Google Scholar]
- de Curtis M, Biella G, Forti M, Panzica F. Multifocal spontaneous epileptic activity induced by restricted bicuculline ejection in the piriform cortex of the isolated guinea pig brain. J Neurophysiol. 1994;71:2463–2476. doi: 10.1152/jn.1994.71.6.2463. [DOI] [PubMed] [Google Scholar]
- Demir R, Haberly LB, Jackson MB. Voltage imaging of epileptiform activity in slices from rat piriform cortex: onset and propagation. J Neurophysiol. 1998;80:2727–2742. doi: 10.1152/jn.1998.80.5.2727. [DOI] [PubMed] [Google Scholar]
- Ekstrand JJ, Domroese ME, Feig SL, Illig KR, Haberly LB. Immunocytochemical analysis of basket cells in rat piriform cortex. J Comp Neurol. 2001;434:308–328. [PubMed] [Google Scholar]
- Goldberg JH, Lacefield CO, Yuste R. Global dendritic calcium spikes in mouse layer 5 low threshold spiking interneurones: implications for control of pyramidal cell bursting. J Physiol. 2004;558:465–478. doi: 10.1113/jphysiol.2004.064519. [DOI] [PMC free article] [PubMed] [Google Scholar]
- Haberly LB. Structure of the piriform cortex of the opossum. I. Description of neuron types with Golgi methods. J Comp Neurol. 1983;213:163–187. doi: 10.1002/cne.902130205. [DOI] [PubMed] [Google Scholar]
- Haberly LB. Parallel-distributed processing in olfactory cortex: new insights from morphological and physiological analysis of neuronal circuitry. Chem Senses. 2001;26:551–576. doi: 10.1093/chemse/26.5.551. [DOI] [PubMed] [Google Scholar]
- Haberly LB, Bower JM. Olfactory cortex: model circuit for study of associative memory? Trends Neurosci. 1989;12:258–264. doi: 10.1016/0166-2236(89)90025-8. [DOI] [PubMed] [Google Scholar]
- Haberly LB, Hansen DJ, Feig SL, Presto S. Distribution and ultrastructure of neurons in opossum piriform cortex displaying immunoreactivity to GABA and GAD and high-affinity tritiated GABA uptake. J Comp Neurol. 1987;266:269–290. doi: 10.1002/cne.902660211. [DOI] [PubMed] [Google Scholar]
- Haberly LB, Presto S. Ultrastructural analysis of synaptic relationships of intracellularly stained pyramidal cell axons in piriform cortex. J Comp Neurol. 1986;248:464–474. doi: 10.1002/cne.902480403. [DOI] [PubMed] [Google Scholar]
- Hestrin S, Armstrong WE. Morphology and physiology of cortical neurons in layer I. J Neurosci. 1996;16:5290–5300. doi: 10.1523/JNEUROSCI.16-17-05290.1996. [DOI] [PMC free article] [PubMed] [Google Scholar]
- Jiao Y, Zhang C, Yanagawa Y, Sun QQ. Major effects of sensory experiences on the neocortical inhibitory circuits. J Neurosci. 2006;26:8691–8701. doi: 10.1523/JNEUROSCI.2478-06.2006. [DOI] [PMC free article] [PubMed] [Google Scholar]
- Kanter ED, Kapur A, Haberly LB. A dendritic GABAA-mediated IPSP regulates facilitation of NMDA-mediated responses to burst stimulation of afferent fibers in piriform cortex. J Neurosci. 1996;16:307–312. doi: 10.1523/JNEUROSCI.16-01-00307.1996. [DOI] [PMC free article] [PubMed] [Google Scholar]
- Kapur A, Pearce RA, Lytton WW, Haberly LB. GABAA-mediated IPSCs in piriform cortex have fast and slow components with different properties and locations on pyramidal cells. J Neurophysiol. 1997;78:2531–2545. doi: 10.1152/jn.1997.78.5.2531. [DOI] [PubMed] [Google Scholar]
- Karube F, Kubota Y, Kawaguchi Y. Axon branching and synaptic bouton phenotypes in GABAergic nonpyramidal cell subtypes. J Neurosci. 2004;24:2853–2865. doi: 10.1523/JNEUROSCI.4814-03.2004. [DOI] [PMC free article] [PubMed] [Google Scholar]
- Kawaguchi Y. Groupings of nonpyramidal and pyramidal cells with specific physiological and morphological characteristics in rat frontal cortex. J Neurophysiol. 1993;69:416–431. doi: 10.1152/jn.1993.69.2.416. [DOI] [PubMed] [Google Scholar]
- Kawaguchi Y. Physiological subgroups of nonpyramidal cells with specific morphological characteristics in layer II/III of rat frontal cortex. J Neurosci. 1995;15:2638–2655. doi: 10.1523/JNEUROSCI.15-04-02638.1995. [DOI] [PMC free article] [PubMed] [Google Scholar]
- Kawaguchi Y, Kubota Y. Correlation of physiological subgroupings of nonpyramidal cells with parvalbumin- and calbindinD28k-immunoreactive neurons in layer V of rat frontal cortex. J Neurophysiol. 1993;70:387–396. doi: 10.1152/jn.1993.70.1.387. [DOI] [PubMed] [Google Scholar]
- Kawaguchi Y, Kubota Y. Neurochemical features and synaptic connections of large physiologically-identified GABAergic cells in the rat frontal cortex. Neuroscience. 1998;85:677–701. doi: 10.1016/s0306-4522(97)00685-4. [DOI] [PubMed] [Google Scholar]
- Kay LM, Freeman WJ. Bidirectional processing in the olfactory-limbic axis during olfactory behavior. Behav Neurosci. 1998;112:541–553. doi: 10.1037//0735-7044.112.3.541. [DOI] [PubMed] [Google Scholar]
- Kisvarday ZF, Gulyas A, Beroukas D, North JB, Chubb IW, Somogyi P. Synapses, axonal and dendritic patterns of GABA-immunoreactive neurons in human cerebral cortex. Brain. 1990;113(Pt 3):793–812. doi: 10.1093/brain/113.3.793. [DOI] [PubMed] [Google Scholar]
- Luna VM, Schoppa NE. GABAergic circuits control input-spike coupling in the piriform cortex. J Neurosci. 2008;28:8851–8859. doi: 10.1523/JNEUROSCI.2385-08.2008. [DOI] [PMC free article] [PubMed] [Google Scholar]
- Luskin MB, Price JL. The laminar distribution of intracortical fibers originating in the olfactory cortex of the rat. J Comp Neurol. 1983;216:292–302. doi: 10.1002/cne.902160306. [DOI] [PubMed] [Google Scholar]
- Monyer H, Markram H. Interneuron diversity series: molecular and genetic tools to study GABAergic interneuron diversity and function. Trends Neurosci. 2004;27:90–97. doi: 10.1016/j.tins.2003.12.008. [DOI] [PubMed] [Google Scholar]
- Parra P, Gulyas AI, Miles R. How many subtypes of inhibitory cells in the hippocampus? Neuron. 1998;20:983–993. doi: 10.1016/s0896-6273(00)80479-1. [DOI] [PubMed] [Google Scholar]
- Protopapas AD, Bower JM. Physiological characterization of layer III non-pyramidal neurons in piriform (olfactory) cortex of rat. Brain Res. 2000;865:1–11. doi: 10.1016/s0006-8993(00)02070-9. [DOI] [PubMed] [Google Scholar]
- Reyes A, Lujan R, Rozov A, Burnashev N, Somogyi P, Sakmann B. Target-cell-specific facilitation and depression in neocortical circuits. Nat Neurosci. 1998;1:279–285. doi: 10.1038/1092. [DOI] [PubMed] [Google Scholar]
- Satou M, Mori K, Tazawa Y, Takagi SF. Interneurons mediating fast postsynaptic inhibition in pyriform cortex of the rabbit. J Neurophysiol. 1983;50:89–101. doi: 10.1152/jn.1983.50.1.89. [DOI] [PubMed] [Google Scholar]
- Schoppa NE. AMPA/kainate receptors drive rapid output and precise synchrony in olfactory bulb granule cells. J Neurosci. 2006;26:12996–13006. doi: 10.1523/JNEUROSCI.3503-06.2006. [DOI] [PMC free article] [PubMed] [Google Scholar]
- Suzuki N, Bekkers JM. Neural coding by two classes of principal cells in the mouse piriform cortex. J Neurosci. 2006;26:11938–11947. doi: 10.1523/JNEUROSCI.3473-06.2006. [DOI] [PMC free article] [PubMed] [Google Scholar]
- Tamamaki N, Yanagawa Y, Tomioka R, Miyazaki J, Obata K, Kaneko T. Green fluorescent protein expression and colocalization with calretinin, parvalbumin, and somatostatin in the GAD67-GFP knock-in mouse. J Comp Neurol. 2003;467:60–79. doi: 10.1002/cne.10905. [DOI] [PubMed] [Google Scholar]
- Toth K, McBain CJ. Target-specific expression of pre- and postsynaptic mechanisms. J Physiol. 2000;525(Pt 1):41–51. doi: 10.1111/j.1469-7793.2000.00041.x. [DOI] [PMC free article] [PubMed] [Google Scholar]
- Tseng GF, Haberly LB. Deep neurons in piriform cortex. II. Membrane properties that underlie unusual synaptic responses. J Neurophysiol. 1989;62:386–400. doi: 10.1152/jn.1989.62.2.386. [DOI] [PubMed] [Google Scholar]
- Westenbroek RE, Westrum LE, Hendrickson AE, Wu JY. Immunocytochemical localization of cholecystokinin and glutamic acid decarboxylase during normal development in the prepyriform cortex of rats. Brain Res. 1987;431:191–206. doi: 10.1016/0165-3806(87)90208-2. [DOI] [PubMed] [Google Scholar]
- Wilson DA. Receptive fields in the rat piriform cortex. Chem Senses. 2001;26:577–584. doi: 10.1093/chemse/26.5.577. [DOI] [PubMed] [Google Scholar]
- Wilson DA, Kadohisa M, Fletcher ML. Cortical contributions to olfaction: plasticity and perception. Semin Cell Dev Biol. 2006;17:462–470. doi: 10.1016/j.semcdb.2006.04.008. [DOI] [PubMed] [Google Scholar]
- Young A, Sun QQ. Long-term modifications in the strength of excitatory associative inputs in the piriform cortex. Chem Senses. 2007;32:783–794. doi: 10.1093/chemse/bjm046. [DOI] [PMC free article] [PubMed] [Google Scholar]
- Yuste R. Origin and classification of neocortical interneurons. Neuron. 2005;48:524–527. doi: 10.1016/j.neuron.2005.11.012. [DOI] [PubMed] [Google Scholar]
- Zhang C, Szabo G, Erdelyi F, Rose JD, Sun QQ. Novel interneuronal network in the mouse posterior piriform cortex. J Comp Neurol. 2006;499:1000–1015. doi: 10.1002/cne.21166. [DOI] [PubMed] [Google Scholar]
- Zhou FM, Hablitz JJ. Layer I neurons of rat neocortex. I. Action potential and repetitive firing properties. J Neurophysiol. 1996;76:651–667. doi: 10.1152/jn.1996.76.2.651. [DOI] [PubMed] [Google Scholar]


