Abstract
Processing dynamic changes in the stimulus stream is a major task for sensory systems. In the auditory system, an increase in the temporal integration window between the inferior colliculus (IC) and auditory cortex is well known for monaural signals such as amplitude modulation, but a similar increase with binaural signals has not been demonstrated. To examine the limits of binaural temporal processing at these brain levels, we used the binaural beat stimulus, which causes a fluctuating interaural phase difference, while recording from neurons in the unanesthetized rabbit. We found that the cutoff frequency for neural synchronization to the binaural beat frequency (BBF) decreased between the IC and auditory cortex, and that this decrease was associated with an increase in the group delay. These features indicate that there is an increased temporal integration window in the cortex compared to the IC, complementing that seen with monaural signals. Comparable measurements of responses to amplitude modulation showed that the monaural and binaural temporal integration windows at the cortical level were quantitatively as well as qualitatively similar, suggesting that intrinsic membrane properties and afferent synapses to the cortical neurons govern the dynamic processing. The upper limits of synchronization to the BBF and the band-pass tuning characteristics of cortical neurons are a close match to human psychophysics.
Keywords: dynamic processing, binaural beats, binaural sluggishness, monaural amplitude modulation, temporal coding
Introduction
Auditory signals change over time, and the temporal pattern of changes conveys important information, e.g., speech. Previous physiological studies have described the resolution with which temporal changes are encoded. A focus has been the differences in temporal processing abilities in neurons at different levels in the brain. To date, most studies have examined the processing of monaural, dynamic sounds, such as amplitude-modulated sounds. The general finding is that the upper cutoff frequency of the synchronized response decreases at higher levels along the ascending auditory pathway (see Joris et al. 2004 for a review). The main focus of the current study was to determine if a decrease also occurs to binaural, dynamic sounds measured at the midbrain and cortical levels.
Binaural cues are important for sound localization and separation of signals from noise. They are processed in discrete pathways that include integration of information from the two ears in the superior olivary complex. Psychophysically, processing of temporal fluctuations in binaural signals, particularly interaural time differences (ITDs) and interaural correlation, is said to be “sluggish” compared to comparable processing of monaural cues such as amplitude modulation (Viemeister 1977; Grantham and Wightman 1978; Viemeister 1979; Grantham 1982), although recent studies suggest that this sluggishness does not occur under all experimental conditions (Siveke et al. 2008).
To investigate binaural temporal processing in the inferior colliculus (IC) and auditory cortex, we used the binaural beat (BB) stimulus. When tones that differ slightly in frequency are delivered to each ear, the frequency difference causes an ongoing fluctuation, or beat, of the interaural phase, or equivalently of the interaural time difference. The BB frequency (BBF), or beat rate, is controlled by the magnitude of the frequency difference. Because the tones at each ear are unmodulated, the beating occurs as a consequence of central rather than peripheral processing. Although the BB stimulus has been extensively used in physiological studies, most have used only a single binaural beat frequency (typically 1 Hz) to efficiently characterize the spatial tuning of neurons (e.g., Yin and Kuwada 1983b; Kuwada et al. 1987; Palmer et al. 1990; Yin and Chan 1990; Fitzpatrick et al. 2000). Studies where the BBF has been varied are few. In IC neurons of barbiturate-anesthetized cats, it was first reported that the upper limit for synchronization to a BBF was ∼80 Hz (Yin and Kuwada 1983a). However, more recent measurements in the anesthetized cat indicate that the upper limit for neuronal synchronization of IC neurons is ∼1 kHz (Joris et al. 2006). In contrast, at the cortical level, most neurons in the barbiturate-anesthetized cat do not respond to BB stimuli (Reale and Brugge 1990). Fitzpatrick et al. (2000) showed that loss of sensitivity to BB stimuli occurs in cortical neurons upon administration of barbiturate anesthesia. Consequently, responses in unanesthetized animals are required for describing dynamic response capabilities of cortical neurons.
To investigate monaural temporal processing in the IC and cortex, we used sinusoidally amplitude-modulated (AM) tones delivered to the contralateral (re: recording site) ear. Ter-Mikaelian et al. (2007) showed that anesthesia altered the variability and the temporal precision of auditory cortical neurons to AM tones. In contrast, neurons in the IC were found to be less affected by anesthesia. Their results further underscore the pitfalls of using anesthetized preparations to study temporal coding. The present study used the unanesthetized rabbit to investigate binaural and monaural processing in the IC and cortex.
Materials and methods
Thirty-seven adult female Dutch-belted rabbits with clean external ear canals were used. The animals were handled according to the standards and protocols of the Institutional Animal Care and Use Committee at the University of Connecticut Health Center and at the University of North Carolina at Chapel Hill, and the “Guide for the Care and Use of Laboratory Animals” published by the National Institute of Health.
Surgical procedures for extracellular recordings
Surgical and recording methods for the unanesthetized rabbit preparation have been previously described (Kuwada et al. 1987; Fitzpatrick and Kuwada 2001). Briefly, all surgical procedures were performed using aseptic techniques. Under general anesthesia (ketamine, 35 mg/kg and xylazine, 5 mg/kg), a square brass rod was anchored to the skull using screws and dental acrylic. While anesthetized, earmolds were made by inserting a rod in the ear canal and ear impression compound was pressed around the rod. The rod was subsequently replaced with a hollow, 6.5-cm-long sound tube that was glued to the earmold. After acclimation to the recording environment and listening to sounds through the earmolds, the animal was re-anesthetized and a small rectangular craniotomy (∼3 mm × 4 mm) was made in the skull overlying the inferior colliculus or auditory cortex, respectively. The exposed dura was protected by covering it with a sterilized medical elastopolymer (Sammons Preston Rolyan Inc., WI, USA).
All recordings were conducted in a double-walled, sound-attenuated chamber. The unanesthetized rabbit was placed in a body stocking or cloth wrap and seated in a cradle from which its head protruded. The stocking or wrap provided only mild restraint, their primary purpose being to discourage movements that might cause injury to the rabbit. The rabbit’s head was fixed by clamping to the surgically implanted brass rod. Once the rabbit was secured, the elastopolymer covering was removed to expose the opening in the skull. To reduce possible pain or discomfort during the penetration of the electrode, a topical anesthetic (1% xylocaine) was applied to the dura for approximately 5 min and then removed by aspiration. With these procedures, rabbits remained still for the recording session (2–3 h), an important criterion for neural recording. A session was terminated if the rabbit showed any signs of discomfort. Daily recording sessions were made for a periods of up to 6 months per rabbit.
Extracellular recordings were made with glass-coated, platinum–tungsten or tungsten-in-glass microelectrodes (tip diameter of 1–2 μm, impedances of 10–20 MΩ). Electrode position was controlled via a piezoelectric microdrive (Burleigh Instruments, Fishers, NY, USA) and calibrated in reference to bregma prior to each recording session. This allowed consistent placement of the electrode. The action potentials of single neurons or small clusters of neurons were amplified 5,000–25,000 times, isolated with the aid of a window discriminator and timed relative to the stimulus onset with an accuracy of 1 or 10 μs. All of our illustrated examples are from single neurons. If another 1–2 units were present whose spikes may have occasionally been included in the recording, it was classified as a small cluster. We did not include multiunit recording where there was no single dominant waveform, and we saw no consistent difference between single neuron recordings and those classified as small clusters.
Acoustic stimulation and calibration
Auditory stimuli were generated by a two-channel digital stimulation system (Rhode 1976) or by a System II TDT hardware using custom software. In earlier animals, calibrations were performed after recordings were complete, with a probe inserted surgically into the bony meatus opposite the tympanum (Batra et al. 1993). In later animals, calibrations were performed via probes incorporated in the sound tubes (Fitzpatrick et al. 2000). In the latter situation, the tip of the probe was ∼2 cm from the tympanum. Calibrating sounds were either tones from 60 to 40,000 Hz in 20 Hz steps, or bands of noise spanning the range from 60 to 50,000 Hz in steps of 50–2,000 Hz and bandwidths of 100–2,000 Hz. Sound levels are expressed in decibel re 20 μPa (decibel sound pressure level).
Recording sites
Responses were obtained from recording sites in the IC and auditory cortex. The nuclei were localized based on stereotaxic coordinates determined in previous studies and on physiological criteria. From our angle of approach starting on the dorsal skull, the central nucleus of the IC in the rabbit is characterized by a tonotopic sequence from low to high CFs. Most of the recordings to BB stimuli were made in the dorsal and lateral parts of the IC. Most of the recordings to monaural AM tones were made in the ventral, lateral part of the IC. The auditory cortex has at least two tonotopically organized areas, the primary auditory cortex (AI) and a field located dorsal and anterior to AI (McMullen and Glaser 1982 and personal observations). The isofrequency laminae are aligned rostrocaudally. The rabbit’s cortex is lissencephalic and the auditory cortex lies on its lateral surface, which is oriented vertically. Thus, with our dorsal approach, we can make long, tangential penetrations that remain in the middle layers where the responses are most robust. Because of the orientation of the laminae, the penetrations cross the tonotopic sequence which runs from high to low in AI. All recordings included here were from AI, which could be distinguished from the dorsoanterior area by a reversal at the high-frequency (dorsal) border.
Data collection and analysis
For each neuron, the sensitivity to ITDs was first tested using a 1-Hz BB stimulus across a range of stimulus frequencies from as low as 200 Hz to as high as 2,200 Hz in 100 Hz steps. If the neuron was sensitive to ITDs, it was studied across a range of BBFs with the stimulus frequency at one ear fixed at the best frequency for ITD sensitivity, defined as the frequency giving the highest sync-rate (see below) to the 1-Hz BBF tested initially. In some neurons, both directions of interaural phase change were studied for each BBF, with direction controlled by changing the ear with the higher frequency tone. The intensity was 50–70 dB SPL. The duration was 5.1 s, the repetition period was 5.3 s, and the stimuli were repeated one to three times. In some neurons, the BF was determined using pure tone stimuli of different frequencies and constant intensity, from 40 to 70 dB SPL, delivered to the contralateral ear. The BF was defined as the stimulus frequency that produced the maximum firing rate.
Measurements collected from the period histograms binned on the BBF included the mean interaural phase, synchrony, rate, and synchronized rate (sync-rate). The first 100 ms of each response was excluded from the analysis to avoid onset transient effects. The interaural phase at which each spike occurred was plotted in relation to that of the stimulus at the tympanic membrane based on the calibrations. The mean phase was taken as the mean vector of the period histogram (Goldberg and Brown 1969). The synchronization, or vector strength, is a measure of the height of the mean vector normalized by the spike count. It can range from 1 to zero, where 1 indicates that all spikes occurred at a single interaural phase and smaller numbers indicate greater dispersion with respect to interaural phase. The firing rate is the total number of spikes divided by the time of stimulation, or number of cycles times the period. The sync-rate is the product of the synchrony and the firing rate. The sync-rate is a measure of the relative strength of time-locked responses as a function of the BBF.
For the monaural studies, sinusoidal AM tones with varying modulation frequencies and 100% modulation depth were presented to the contralateral ear (re: site of recording). The carrier frequencies were set to the BF of the neuron as defined above. The AM tone level used to test AM sensitivity was mostly between 40 and 70 dB SPL. The duration of the AM tones was 0.5 to 5.1 s, the silent interval between repetitions was typically 0.2–0.3 s and the stimuli were repeated one to ten times. Like the responses to the BB stimuli, the first 100 ms of the response to AM tones response was excluded to avoid transient effects. Analysis consisted of using period histograms to measure the mean phase, synchrony, rate and sync-rate to the AM period.
Results
Recordings to BB stimuli at different BBFs were obtained from 113 sites in the auditory cortex of nine rabbits and 74 sites in the IC of 12 rabbits. Recordings to monaural, sinusoidal AM tones were obtained from 113 sites in the auditory cortex of five rabbits, and 132 sites in the IC of 11 rabbits.
Neural responses to BB stimuli
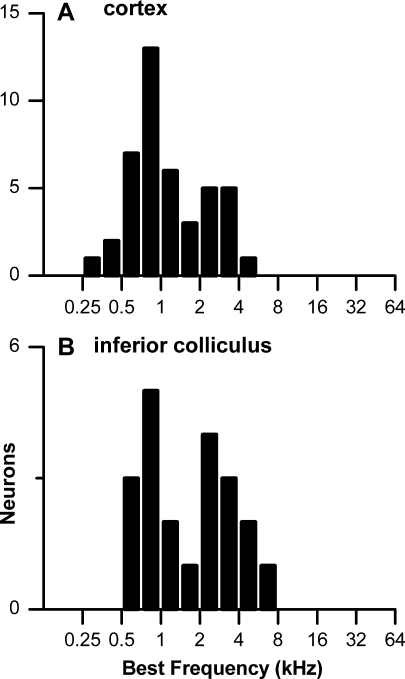
For many neurons studied with BB stimuli, the BF was determined to contralateral tones from an isointensity sweep (74 of 113 neurons in the cortex and 26 of 74° in the IC). The distributions of best frequencies (BFs) of cortical and IC neurons tested with BB stimuli are shown in Figure 1A, B, respectively. Both populations contained neurons with BFs at low frequencies (<2.5 kHz) where phase locking is common in the rabbit, as well as at high frequencies where phase locking to pure tones is not present. In these latter neurons, the responses to BB stimuli were obtained at low stimulus frequencies in the low-frequency tail of the neuron’s frequency tuning.
FIG. 1.
A, B Distributions of best frequencies in neurons studied with BB stimuli.
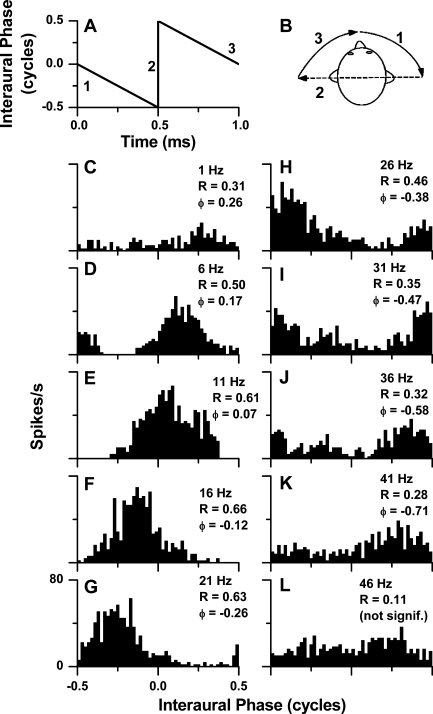
An example of the measurement of the binaural temporal transfer function to tones is shown in Figures 2 and 3. In Figure 2A, the change in interaural phase with a BB stimulus is linear, as shown for a 1-Hz BBF. The cartoon in Figure 2B shows the movement of the sound image within the head for one cycle of interaural phase, with the numbered epochs corresponding to panel A. The direction of movement towards the right ear in this example was produced by delivering the higher frequency to the right ear. Period histograms created by averaging the response over one cycle of interaural phase change for a cortical neuron are shown in Figure 2C–L. For this neuron, the BBFs were varied by delivering a 700-Hz tone to the contralateral ear while increasing the frequency to the ipsilateral ear (701–746 Hz). Significant synchrony (R) to the BBF was determined by the Rayleigh test of uniformity (Mardia and Jupp 1999). Most of the responses (Fig. 2C–K) met this criterion while that at 46 Hz BBF did not (Fig. 2L). The mean interaural phase changed systematically with BBF. As the mean phase “wrapped around” the cycle boundary (Fig. 2J), a cycle was subtracted from the response phase to maintain continuity.
FIG. 2.
Properties of binaural beat (BB) stimuli and examples of neural responses obtained with BB stimuli. A One period of the change in interaural phase over 1 s from a 1-Hz binaural beat. B The perceived change in lateralization that would be expected with a beat frequency of less than a few hertz. Numbers refer to the epochs of the stimulus shown in A. C–L Period histograms of responses of a single neuron in the auditory cortex to the BB stimuli at different binaural beat frequencies (BBFs). The synchrony (R values) was significant (see text) at BBFs up to 41 Hz, but was not significant at 46 Hz. The mean response phase (ϕ) increased with BBF. Stimulus frequency = 700 Hz in contralateral ear, 700 Hz + BBF in ipsilateral ear; level = 70 dB SPL, duration = 5100 ms, repetitions = 1. The BF of this neuron was 740 Hz.
FIG. 3.
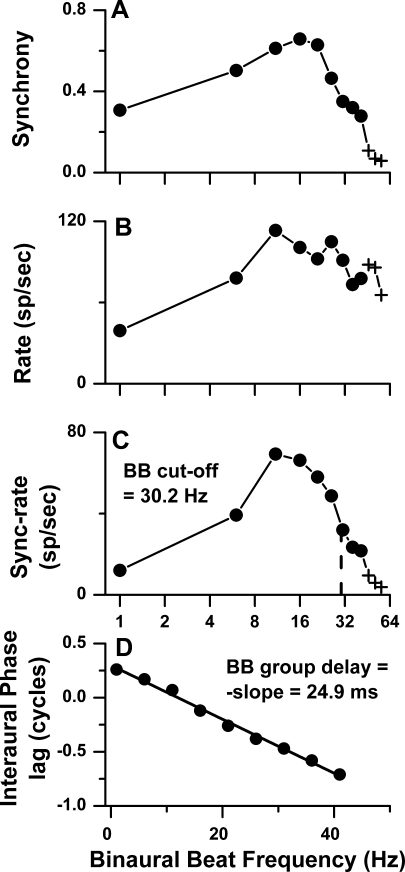
Phase and amplitude components of binaural beat (BB) transfer functions for the same cortical neuron as in Figure 1. A Synchrony versus BBF. B Average rate versus BBF. C Sync-rate versus BBF. The cutoff frequency was defined as the BBF where the sync-rate was half maximal. D Interaural phase versus BBF. The BB group delay was defined as the slope of phase versus BBF.
Measurements computed from the period histograms were the synchrony, rate, sync-rate, and response phase, as described in “Materials and methods”. These quantities are plotted as a function of BBF in Figure 3A–D for the same neuron as in Figure 2. The points plotted as filled circles showed significant synchrony (p < 0.001), whereas the points plotted as crosses did not. Figure 3A–C represents three different quantifications of the amplitude component of the BBF transfer function. In this neuron, all three functions were band-pass. Synchrony is more informative of a neuron’s response than rate when the excitation is weak. When excitation is strong, rate is more informative than synchrony because synchrony saturates at lower sound levels than rate. The sync-rate incorporates the merits of both synchrony and rate because it effectively conveys information about the temporally based transfer function (Kim and Molnar 1979). Thus, we use the sync-rate to compute the BB cutoff frequency (at 50% of maximum sync-rate), although we will further consider the synchrony and rate transfer functions in a following section. The cutoff frequency for this neuron was 30.2 Hz.
When the response phase was plotted against BBF, the relationship was linear (Fig. 3D). The change in response phase versus BBF represents the phase component of the BBF transfer function. A linear phase–frequency plot indicates that the response phase is affected by a constant time delay, called the group delay (Papoulis 1962). This measure corresponds to the center of gravity of the impulse response (Goldstein et al. 1971). We defined the negative slope of this line to be the BB group delay to distinguish it from other measures of group delay, e.g., those determined from plots of response phase versus monaural tonal stimulus frequency (Pfeiffer and Molnar 1970; Anderson et al. 1971), or from plots of response phase versus BB stimulus frequency (characteristic delay, Yin and Kuwada 1983b). The BB group delay for this neuron was 24.9 ms.
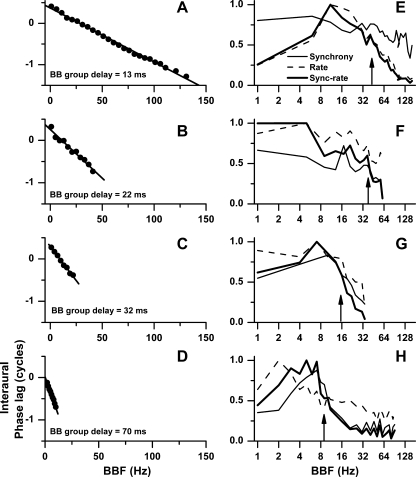
In Figure 4, we present four additional examples of BB modulation transfer functions. The phase component of the modulation transfer function is shown in the left column (Fig. 4A–D). Only the points showing significant synchrony to the BBF are shown. These four neurons were chosen to reflect the range of BB group delays and are arranged from short to long group delays. As the group delay increased, the range of frequencies showing significant synchronization decreased. The corresponding amplitude components (rate, synchrony, sync-rate) of the modulation transfer functions of these four neurons are shown in the right column (Fig. 4E–H). The three types of amplitude transfer functions, in general, differed from each other, but for reasons stated above we chose to measure upper cutoff from the sync-rate functions. The upper cutoff frequencies of the sync-rate functions (50% of maximum) are indicated by upward arrows. There was an inverse relation between group delay and upper cutoff such that as group delay increased, upper cutoff decreased.
FIG. 4.
Four additional examples of BB modulation transfer functions. Neurons with short group delays (A and B) tended to have a large range of significant frequencies and have higher cutoff frequencies (E and F), while neurons with long group delays (C and D) tended to have a short range of significant frequencies and lower cutoff frequencies (G and H). There was variability between the amplitude components of the transfer functions based on synchrony, rate, or sync-rate. The cutoff frequency (arrows) was determined from the sync-rate curves. A and E, BF = 640 Hz, stimulus frequency = 400 Hz, level = 60 dB SPL; B and F, 500 Hz/300 Hz/70 dB SPL; C and G, 910 Hz/700 Hz/60 dB SPL; D and H, 750 Hz/700 Hz/60 dB SPL.
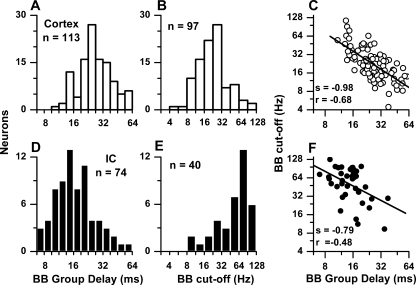
The distribution of BB group delays and BB cutoff frequencies is shown for neurons in the auditory cortex (Fig. 5A, B) and IC (Fig. 5D, E), respectively. The BB group delays were estimated from phases at a minimum of four frequencies for each neuron. In addition, we required that synchrony be significant and the correlation coefficient of the linear regression line be greater than 0.9. For the cortex, the median BB group delay was 25.6 ms and the median BB cutoff frequency was 21.2 Hz. Consistent with Figure 4, the BB group delay was inversely related to cutoff frequency (Fig. 5C), albeit with noticeable scatter. The relationship between group delay and cutoff frequency was strongest when sync-rate was used for the cutoff compared to either rate (50% cutoff) or synchrony (highest significant frequency).
FIG. 5.
Distributions of binaural beat (BB) group delays (A, D) and cutoffs (B, E) and the relationships between the two measures (C, F) for the cortical (A–C) and IC neurons (D–F).
The BB group delays and cutoff values for IC neurons are shown in Figure 5D, E. The BB group delays were shorter and the cutoff frequencies were higher than in the auditory cortex. The median BB group delay in the IC was 13.4 ms, or about half that in the cortex, while the median BB cutoff frequency was 63 Hz, or about three times that in the auditory cortex. As in the auditory cortex, IC neurons showed an inverse relationship between BB group delay and cutoff frequency. These results show that the temporal integration window increases between the IC and cortex.
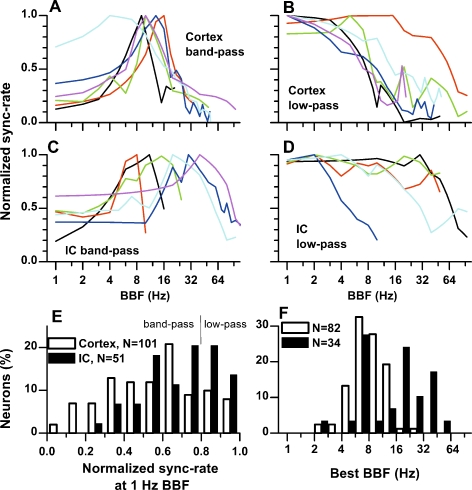
The results above describe the neuron’s cutoff frequency corresponding to the low-pass portion of the BB modulation transfer functions. The responses of many neurons were band-pass whereas others were low-pass. To examine the distribution of these shapes, we derived normalized sync-rate (NSR) by dividing by the maximum sync-rate. Figure 6 plots the NSR versus BBF for a sample of cortical and IC neurons that displayed band-pass (Fig. 6A, C) and low-pass functions (Fig. 6B, D). Most cortical band-pass functions showed peaks that clustered around a BBF of 10 Hz (Fig. 6A). In contrast, IC band-pass functions showed a wide distribution of peak BBFs (Fig. 6C). Both the prevalence and sharpness of band-pass behavior was greater in the cortex than in the IC (Fig. 6E). Here, we plotted the distribution of NSR at a BBF of 1 Hz. For a band-pass neuron, the NSR at 1 Hz BBF is much less than 1, whereas it is near 1 for a low-pass neuron. Overall, the median NSR at 1 Hz BBF was 0.58 in the cortex compared to 0.74 in IC. For quantification, we classified a function as band-pass if the NSR at a BBF of 1 Hz BBF was less than 0.8. With this criterion, the majority of neurons in both structures were band-pass but the cortex showed a greater proportion of band-pass neurons than did the IC (82% compared to 66%). For the band-pass neurons, the distribution of best BBFs (Fig. 6F) for cortical neurons was tightly clustered between 6 and 11 Hz, whereas those of IC neurons were broadly distributed with many above 11 Hz.
FIG. 6.
Shapes of binaural beat (BB) transfer functions. A Representative examples of cortical neurons with band-pass BB transfer functions. B Representative examples of cortical neurons with low-pass BB transfer functions. C Representative examples of IC neurons with band-pass BB transfer functions. D Representative examples of IC neurons with low-pass BB transfer functions. E Distribution of normalized sync-rate at 1 Hz BBF. A low (or high) value of this measure is an indication of band-pass (or low-pass) characteristic of each neuron. A band-pass function was defined to have a response at 1 Hz BBF < 0.8., while a low-pass function had a response greater than 0.8. F Distribution of best BBFs for band-pass neurons in the auditory cortex and IC.
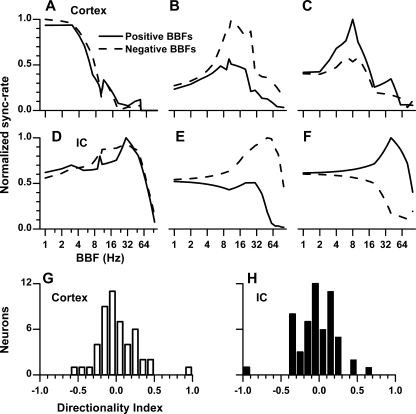
With BB stimuli, the direction of the change in IPD is controlled by the ear with the higher frequency. For both the IC and cortex, some neurons did not show a directional preference (Fig. 7A, D) whereas others did. Of those with a directional preference, some neurons preferred one direction (Fig. 7B, E) while other preferred the opposite (Fig. 7C, F). To assess the degree of direction preference, a directionality index was defined as the difference between the maximum sync-rate for each direction divided by the sum of the two maximum sync-rates. On this scale, zero means no directional preference, and a response only to one direction yields a direction index of magnitude 1. A negative sign indicates that the direction of movement for the larger of the two maxima was towards the contralateral ear. Most neurons had a relatively low degree of directional preference, both in the IC and cortex (Fig. 7G, H). The proportion of neurons preferring each direction was similar for cortical and IC neurons.
FIG. 7.
The degree of sensitivity to the direction of binaural beat (BB) in the cortex and IC. A, D Representative examples of neurons in the cortex (A) and IC (D) that did not show a preference for the direction of the BB. B, E Examples of neurons that preferred movement toward the contralateral ear. C, F Examples of neurons that preferred movement toward the ipsilateral ear. G, H Distributions of directionality index (see text). A directionality index near zero indicates little directional sensitivity while an index near 1 corresponds to high directional sensitivity.
Neural responses to monaural, sinusoidal AM tones
Our goal in the use of monaural AM tones was to compare processing of dynamically changing binaural cues in tones with a dynamic stimulus that can be processed in monaural channels. The sensitivity to AM tones has been often studied previously at both the IC and cortical levels. However, in order to compare the binaural and monaural results quantitatively, it is necessary that comparable data be collected in terms of animal species and anesthetic state, as well as methods of analysis. Here, the analysis of sinusoidal AM responses was similar to that shown in Figure 2, except that the period histograms were binned according to the AM frequency. The same measures of response phase, synchrony, rate, and sync-rate were obtained from the period histograms.
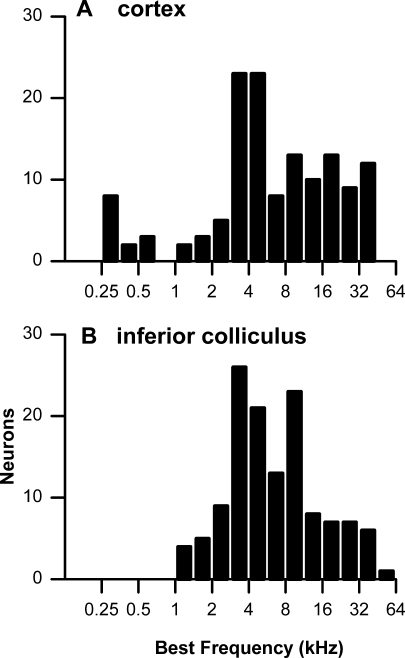
The carrier frequency for the AM stimuli was set at the neuron’s BF. The distributions of BFs for cortical and IC neurons are presented in Figure 8A, B, respectively. Because neurons responsive to AM are found across the full range of BFs, the distributions contain more neurons with high BF than was the case with the binaural stimuli. The distributions at the two brain levels are overlapping, indicating that similar ranges of BF were sampled.
FIG. 8.
A, B Distributions of best frequencies in neurons studied with AM stimuli.
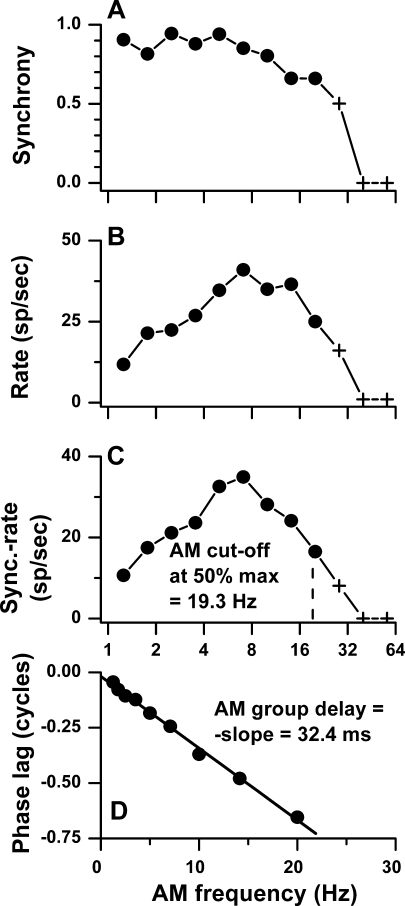
An example of the measurements made as a function of AM frequency is shown for a cortical neuron in Figure 9. The amplitude component of the AM temporal modulation transfer function was low-pass in terms of synchrony and band-pass in terms of rate, giving a band-pass shape to sync-rate. The AM cutoff frequency based on sync-rate in this neuron was 19.3 Hz (vertical dashed line, Fig. 9C). The phase–frequency plot yielded an “AM group delay” of 32.4 ms.
FIG. 9.
Phase and amplitude components of monaural amplitude modulation (AM) transfer functions for a cortical neuron. A–D Synchrony, average rate, sync-rate, and mean phase versus AM frequency. The cutoff frequency was defined as the AM frequency where the sync-rate was half maximal. The AM group delay was defined as the slope of phase versus monaural AM frequency. BF and carrier frequency = 2,000 Hz in contralateral ear, AM depth = 100%, level = 50 dB SPL, duration = 1,100 ms, interstimulus period = 1,300 ms, repetitions = 2.
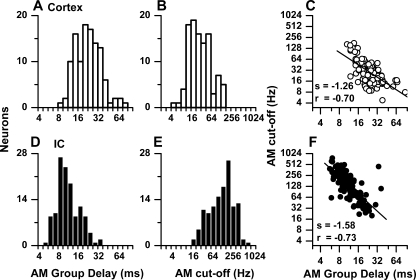
The distributions of AM group delays and cutoff frequencies based on sync-rate are shown in Figure 10. As with the binaural responses (Fig. 5), there was an increase in the AM group delays between the IC (10.6 ms) and cortex (25.6 ms; Fig. 10A, D) and a decrease in the sync-rate cutoff frequencies (IC = 188 Hz, cortex = 21.2 Hz; Fig. 10B, E). For both structures, there was an inverse relationship between group delay and cutoff frequency (Fig. 10C, F).
FIG. 10.
Distributions of AM group delays (A, D) and cutoffs (B, E) and the relationships between the two measures (C, F) for the cortical (A–C) and IC neurons (D–F).
Comparison of responses to BB and AM stimuli recorded in the same neurons
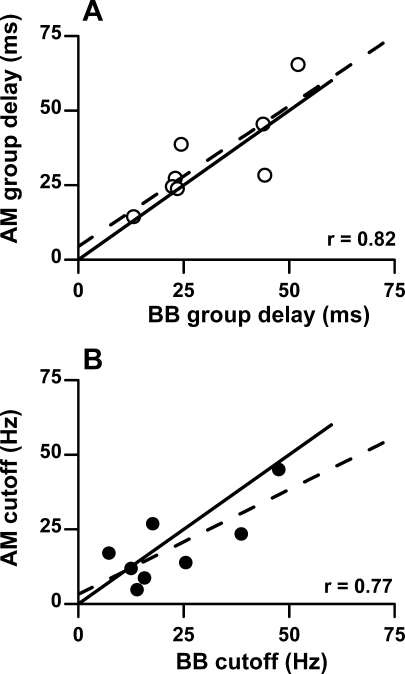
Because the distributions of group delays and cutoffs to BB and AM stimuli were similar for cortical neurons, we asked whether a cortical neuron would exhibit similar group delays and cutoffs to the two different stimuli. This was measured in eight cortical neurons with low BFs. Figure 11A shows the AM versus the BB group delays and Figure 11B shows the AM versus the BB cutoff frequencies. The best fit line (red) is close to the line of equality (black) indicating that these monaural and binaural response measures were highly similar when tested in the same neurons. This result supports the view that dynamic processing of cortical neurons is similar whether the stimulus is binaural or monaural.
FIG. 11.
Comparison of group delays (A) and cutoff frequencies (B) measured to binaural beat (BB) and monaural AM stimulation in the same cortical neurons. The lines of equality (solid), and linear fit (dashed) are shown.
Discussion
We presented the first description of neural responses to a range of BBFs from the auditory cortex and IC in unanesthetized rabbits. We found a decrease in the upper cutoff frequency to the BB stimuli between the IC and auditory cortex and an inverse correlation between the cutoff frequency and group delay in both structures. These features indicate an increase in the temporal integration window between the IC and auditory cortex. We also found that the degree of “tuning” to particular ranges of BBF was more pronounced in cortex than in IC. Analogous to the binaural observations, monaural AM processing also showed a decrease in the upper cutoff frequency between the IC and auditory cortex and an inverse correlation between the upper cutoff frequency and group delay in both structures. At the cortical level, the temporal integration of monaural and binaural stimuli was comparable, suggesting that the temporal integration is dominated by cortical mechanisms.
Increased temporal integration window between the IC and cortex
In both the IC and cortex, there was an inverse correlation between cutoff frequency and group delay across neurons (Figs. 5 and 10). To understand this behavior we employ a simple low-pass filter as a heuristic model. In this model, the input is voltage-applied to a resistor (R) in series with a capacitor (C) and the output is voltage across the capacitor. In the model, cutoff frequency is inversely proportional to the integration time constant τ where τ = R × C (e.g., Alexander and Sadiku 2006). The energy-weighted group delay is proportional to the center of gravity of the filter’s impulse response energy (Goldstein et al. 1971; Papoulis 1962), which in turn is proportional to τ. Therefore, the energy-weighted group delay is inversely proportional to cutoff frequency in the filter model.
In order to apply the filter model quantitatively to the IC and cortical neurons, it is necessary that the energy-weighted group delay of neural response be used. For convenience, we used unweighted group delay. An additional requirement for quantitative application of the model is that the transmission delay be subtracted from the total group delay to derive the “filter delay” (Eggermont 1999). The filter delay is related to the temporal integration window. The latency, or estimate of the time to the initial spike in response to a stimulus, is a possible measurement of the transmission delay. Unfortunately, measurements of latency such as the mean time to the initial spike or initial rise of the PST histogram can be confounded with a number of stimulus variables and, most importantly, with the temporal integration window itself (Heil 2004). Eggermont (1999) attempted to determine transmission delay from latency and found that the filter delay obtained as group delay minus latency of many cortical neurons was negative. Negative filter delays imply that the actual transmission delay was shorter than the measured latency. This highlights the difficulty in determining the transmission delay, an essential parameter involved in determining the relationship between group delay and cutoff using a filter model. In addition, the initial response of IC and cortical neurons is often inhibitory rather than excitatory, so that measures such as first spike latency do not reflect the early inhibitory response (Covey et al. 1996; Kuwada et al. 1997; Faure et al. 2003). For these multiple reasons, it is difficult to use a filter model to predict quantitatively the relationship between group delay and cutoff frequency. Nevertheless, the model does provide a useful conceptual framework to view such relationships.
Previous studies in many species reported that upper cutoff to monaural sinusoidal AM tones were lower in the cortex than the IC (e.g., cat (Schreiner and Urbas 1988; Miller et al. 2002), guinea pig (Creutzfeldt et al. 1980), gerbil (Ter-Mikaelian et al. 2007)). The present results are the first to show an inverse relationship between upper cutoff and group delay for both IC and cortical neurons to monaural AM tones, qualitatively consistent with the filter model. Ter-Mikaelian et al. (2007) found an inverse relationship between latency (not group delay) and cutoff frequency for monaural AM tones in IC and cortical neurons. This relationship may have resulted from the filter delay being a part of latency. Using AM electrical pulse trains delivered to cochlear implants, Middlebrooks (2008) showed an inverse relationship between AM group delays and cutoff frequencies in cortical neurons.
Although our observation of the cutoff frequencies for neurons to monaural AM tones in the IC (158 Hz) are similar to those in unanesthetized gerbil (190 Hz; Ter-Mikaelian et al. 2007), our cutoffs for cortical neurons to the same stimuli are considerably higher (26 Hz) than those in the gerbil (7 Hz). The reason for this difference is not clear. Our findings are more in line with cutoffs of 20–50 Hz using monaural SAM tones in cortical neurons of anesthetized preparations (Creutzfeldt et al. 1980; Schreiner and Urbas 1988; Miller et al. 2002).
A possible reason why cortical neurons exhibit longer group delays and lower cutoff frequencies than the midbrain neurons is that the two groups of neurons differ in their intrinsic membrane properties and their afferent synapses. Regular spiking neurons in a brain slice of the auditory cortex display discrete, non-decrementing excitatory postsynaptic potential (EPSPs) that precisely follow stimulation rates of their presynaptic fibers at 10 Hz. At 40 Hz, these neurons show decrementing EPSPs that begin to lose their temporal synchrony to the stimulating pulses (Rose and Metherate 2005). Interestingly, this limit of ∼40 Hz is comparable to the median cutoffs (23–26 Hz) for cortical neurons (Figs. 5 and 10). In contrast, neurons in the brain slice of the IC show discrete EPSPs that precisely follow pulse rates of 100 Hz (and potentially to even higher rates) (Sivaramakrishnan and Oliver 2006). This is in line with the higher cutoff frequencies in the IC (Figs. 5 and 10). The difference in upper cutoffs between the midbrain and cortex may be established in the thalamus and then relayed to the cortex. However, this does not appear to be the case since previous studies have shown that thalamic neurons synchronize to higher AM frequencies than cortical neurons (Creutzfeldt et al. 1980) and spectro-temporal receptive fields also show sensitivity to higher rates of temporal modulation in thalamic than in cortical neurons (Miller et al. 2002).
In addition to the differences in mean group delays and cutoff frequencies between the IC and cortex, there was also a considerable range of these values within each structure. Presumably, there is a wide range of potential channel and network configurations in each structure to support decomposing the signal stream on multiple time scales, with the available time scales in the cortex extending to longer values than those in the IC. Recently, it has been shown that the temporal modulation window in the cortex varies by cortical layer (Middlebrooks 2008). Another contributor to this variance maybe due to different transmission delays (independent of cutoff frequency) among neurons, whereas the inverse trend between group delay and cutoff may be due to the filter delay (inversely proportional to cutoff frequency).
Comparison of monaural and binaural responses
In the cortex, we found that the upper cutoff and group delays to BB and monaural AM tones were remarkably similar (Figs. 5 and 10). This is despite the fact that these responses came from two independent samples of cortical neurons exhibiting different ranges of BF (Figs. 1A and 8A). It is reasonable to compare different samples because neurons with any BF can synchronize to AM stimuli while synchronization to BB stimulation is most commonly seen in neurons with low BFs, where peripheral phase locking is pronounced. In addition, neurons that respond to BB stimulation by definition reflect inputs derived from pathways through the superior olivary complex, especially the medial superior olive, while neurons responsive to AM may preferentially reflect the LSO pathway, or bypass the superior olivary complex altogether. Thus, although there are obvious advantages in studying the responses to both stimuli in the same neurons, a sample restricted to neurons that respond to both AM and BB stimuli would not be representative of the majority of neurons that respond to AM. The fact that results from the two samples are remarkably similar shows that at the cortical level the temporal integration of monaural and binaural stimuli is dominated by mechanisms that do not depend on differences in location on the basilar membrane or on early auditory pathways. This similarity is consistent with the hypothesis that intrinsic membrane properties and afferent synapses to the cortical neurons govern the dynamic processing regardless of whether the stimulus is binaural or monaural.
In contrast to the cortex, at the level of the IC, the cutoff frequency for the binaural and monaural stimuli was different, and this difference could be due to different BF ranges sampled. In the IC, the cutoff frequencies to AM were higher (median = 158 Hz) than the comparable cutoff for the BB stimulus (median = 63 Hz). This difference is consistent with results in the auditory nerve, where the cutoff frequency to AM increases with the fiber’s BF (Joris and Yin 1992; Greenwood and Joris 1996). An increase in cutoff frequency is expected because of the increased bandwidth of frequency tuning with increasing BF. In the IC, it has been previously reported that the highest best AM frequency increases with BF in the IC (Langner and Schreiner 1988). However, at each BF, there is a wide range of best AM frequencies for IC with similar BFs (Rees and Moller 1987; Langner and Schreiner 1988; Schreiner and Urbas 1988; Krishna and Semple 2000; Eggermont 2002; Blanks et al. 2007). Similarly, although there was a difference in median cutoff frequency between monaural and binaural stimuli in the IC, using linear regression, the cutoff frequency or group delay was not significantly related to the BF in any of our neuronal samples (data not shown). These results show that even by the level of the IC the primary determinant of temporal integration is due to central rather than peripheral factors.
Tuning to particular ranges of the BBF and directional sensitivity
A band-pass transfer function to the BB stimuli was characterized by a low value (e.g., <0.8) of normalized sync-rate at 1 Hz BBF (Fig. 6). A greater proportion of cortical neurons showed band-pass transfer functions to the BB stimuli than IC neurons (Fig. 6E). The high-pass part of a band-pass transfer function of a neuron (defined in the frequency domain) is expected to be associated with adaptation of response (a time-domain behavior) to a steady-state stimulus. That is, adaptation will occur if a stimulus is on for a sufficient time period (i.e., a low frequency of modulation) but will not occur in the case of a rapidly changing stimulus that does not allow the adaptation to build. The more pronounced high-pass behavior of cortical compared to IC neurons to the BB stimuli is consistent with a greater magnitude of adaptation of cortical neurons, as has been previously reported (Spitzer and Semple 1993; McAlpine et al. 2000; Malone et al. 2002; Ingham and McAlpine 2004; Ter-Mikaelian et al. 2007).
Most neurons showed little or no directional preference, and of the remainder, there was no consistent bias in directional preference for either the IC or cortex. However, the presence of neurons that are sensitive to each direction may provide a basis for the motion after-effects that occur after conditioning for extended periods with one direction of motion (Grantham 1989; Carlile et al. 2001). That is, movement in one direction could lead to adaptation of neurons most sensitive to that particular direction, such that when the motion is stopped the activity in the non-adapted neurons will give a percept of motion in the opposite direction.
Comparison of neural and psychophysical responses to a changing BBF
The results in cortical neurons show a similarity to those from psychoacoustic studies using BB stimuli. First, in humans the BB upper cutoff frequency (measured as detection of the beat in 50% of the trials) is ∼34 Hz for a 500-Hz carrier (Perrott and Nelson 1969). This value is similar to the transition from “roughness” to “smoothness” that occurred at an upper limit of about 35 Hz in an adaptive task for a binaural beat stimulus in the neighborhood of 400 Hz (Licklider et al. 1950). These results are in reasonable agreement with the 21-Hz median upper cutoff for BBFs in cortical neurons. Second, in humans, the detectability of BB stimuli is maximal for BBFs of 10–20 Hz for carrier frequencies of 500 and 1,000 Hz (Perrott and Nelson 1969). The band-pass characteristics of cortical neurons peak over this same range. Third, in humans, the highest BBF where the beats could be detected in a small proportion of trials was ∼100 Hz (Perrott and Nelson 1969) which is similar to the upper limit of synchronization identified in cortical neurons. Fourth, in humans, the upper limit shows little sensitivity to stimulus frequency (Perrott and Nelson 1969). In cortical neurons, we also did not observe a relationship between stimulus frequency and upper cutoff (data not shown). Thus, the behavioral sensitivity to BB stimuli in humans is qualitatively consistent with the responses of cortical neurons in the unanesthetized rabbit.
A caveat about the comparison between rabbit neurons and human behavior is that it cannot at present be known what response features lead to the behaviors. We have in general assumed that synchronization to the BB frequency is required to detect the presence of the beat, but this is an untested assumption. With AM, the sensitivity to modulation depth in IC neurons in unanesthetized rabbits shows a good match between the neuronal synchronization and human behavior, while the response rate tends to be a less sensitive measure for detecting the modulation (Nelson and Carney 2007). A reasonable conclusion is that synchronization to the AM is the main cue supporting the behavioral sensitivity. However, preliminary results suggest that rabbit detection of AM is less sensitive than in humans, and that the rate cue is a good match to the rabbit behavior (Nelson and Carney 2007, personal observations). Thus, it is either the case that humans are able to make use of the synchronization cue while rabbits cannot, or that humans have a rate cue that is more sensitive than in rabbits. Similar issues arise with modulation of binaural signals.
To date, there is no indication of binaural sluggishness, defined as a nearly order of magnitude increase in the temporal integration window for binaural compared to monaural stimuli, in auditory neurons. Our results show a close correspondence between monaural and binaural processing. As suggested by Joris et al. (2006), it may be that the monaural system converts temporal sensitivity to a rate code that can be transmitted to a higher level while the binaural system does not. In this case, the low pass filtering that occurs at subsequent levels of brain processing would affect the binaural but not the monaural information. However, our use of tones at the full range of ITDs with BB stimuli or 100% modulation depth with AM is not comparable to the noise stimuli and increase in threshold depth measurements that characterize the psychophysical studies. Recent studies indicate that binaural sluggishness may not be present when using stimuli that utilize the full range of ITDs and AM (Siveke et al. 2008). In addition, a behavioral measure of binaural modulation processing is not available in species other than humans to more directly compare to the neural data. Thus, there remain large gaps in our ability to describe the relationship between neural and behavioral aspects of binaural sluggishness.
Significance of dynamic processing in the binaural system
In the monaural system, identification of the pattern of amplitude modulation can be important in characterizing species specific sounds, such as speech. In the binaural system, it is less clear what information is extracted from the ongoing fluctuation of binaural cues. Motion of sound sources is one possibility. However, behavioral sensitivity to motion extends to at most a few hertz, so the tuning in many cortical neurons to a rate near 10 Hz is inconsistent with motion detection. In addition, sensitivity to motion in the auditory system is weak compared to the specialized mechanisms in the visual system. Another possibility is that temporal sensitivity in the binaural system aids in the detection and discrimination of multiple source locations or provides information about the acoustical properties of spaces, both of which cause dynamic changes in interaural time and correlation (Bradley et al. 2000; Faller and Merimaa 2004; Goupell and Hartmann 2006). Because of the broad tuning to ITDs, a population code is most likely to be used for ITD determination of source location (Fitzpatrick et al. 1997; McAlpine et al. 2001; Stecker et al. 2005). In this case, locations of multiple sources are not directly available during any epoch of the stimulus stream, but must be obtained sequentially during epochs where a single source dominates the interaural time and correlation (Faller and Merimaa 2004). The binaural temporal integration window is expected to be a major factor in the sequential identification of interaural time and correlation information.
ACKNOWLEDGEMENTS
We thank Dr. Marcel van der Heijden, Talong Ju and Robert Manfredi for development of the software for acoustic stimulation and spike recording, and Steven Pulver, Lisa M. Fitzpatrick and Jessica Wu for technical assistance. Supported by NIH grants DC03948, DC005360 and DC002178.
References
- Alexander C, Sadiku M. Fundamentals of Electric Circuits. New York, McGraw-Hill Higher Education, 2006.
- Anderson DJ, Rose JE, Hind JE, Brugge JF. Temporal position of discharges in single auditory nerve fibers within the cycle of a sine-wave stimulus: frequency and intensity effects. J. Acoust. Soc. Am. 49:1131–1139, 1971. [DOI] [PubMed]
- Batra R, Kuwada S, Stanford TS. High-frequency neurons in the inferior colliculus that are sensitive to interaural delays of amplitude-modulated tones: evidence for dual binaural influences. J. Neurophysiol. 70:64–80, 1993. [DOI] [PubMed]
- Blanks DA, Roberts JM, Buss E, Hall JW, Fitzpatrick DC. Neural and behavioral sensitivity to interaural time differences using amplitude modulated tones with mismatched carrier frequencies. J. Assoc. Res. Otolaryngol. 8:393–408, 2007. [DOI] [PMC free article] [PubMed]
- Bradley JS, Reich RD, Norcross SG. On the combined effects of early- and late-arriving sound on spatial impression in concert halls. J. Acoust. Soc. Am. 108:651–661, 2000. [DOI] [PubMed]
- Carlile S, Hyams S, Delaney S. Systematic distortions of auditory space perception following prolonged exposure to broadband noise. J. Acoust. Soc. Am. 110:416–424, 2001. [DOI] [PubMed]
- Covey E, Kauer JA, Casseday JH. Whole-cell patch-clamp recording reveals subthreshold sound-evoked postsynaptic currents in the inferior colliculus of awake bats. J. Neurosci. 16:3009–3018, 1996. [DOI] [PMC free article] [PubMed]
- Creutzfeldt O, Hellweg FC, Schreiner C. Thalamocortical transformation of responses to complex auditory stimuli. Exp. Brain. Res. 39:87–104, 1980. [DOI] [PubMed]
- Eggermont JJ. The magnitude and phase of temporal modulation transfer functions in cat auditory cortex. J. Neurosci. 19:2780–2788, 1999. [DOI] [PMC free article] [PubMed]
- Eggermont JJ. Temporal modulation transfer functions in cat primary auditory cortex: separating stimulus effects from neural mechanisms. J. Neurophysiol. 87:305–321, 2002. [DOI] [PubMed]
- Faller C, Merimaa J. Source localization in complex listening situations: selection of binaural cues based on interaural coherence. J. Acoust. Soc. Am. 116:3075–3089, 2004. [DOI] [PubMed]
- Faure PA, Fremouw T, Casseday JH, Covey E. Temporal masking reveals properties of sound-evoked inhibition in duration-tuned neurons of the inferior colliculus. J. Neurosci. 23:3052–3065, 2003. [DOI] [PMC free article] [PubMed]
- Fitzpatrick DC, Kuwada S. Tuning to interaural time differences across frequency. J. Neurosci. 21:4844–4851, 2001. [DOI] [PMC free article] [PubMed]
- Fitzpatrick DC, Kuwada S, Batra R. Neural sensitivity to interaural time differences: beyond the Jeffress model. J. Neurosci. 20:1605–1615, 2000. [DOI] [PMC free article] [PubMed]
- Fitzpatrick DC, Batra R, Stanford TR, Kuwada S. A neuronal population code for sound localization. Nature 388:871–874, 1997. [DOI] [PubMed]
- Goldberg JM, Brown PB. Response of binaural neurons of dog superior olivary complex to dichotic tonal stimuli: some physiological mechanisms of sound localization. J. Neurophysiol. 32:613–636, 1969. [DOI] [PubMed]
- Goldstein JL, Baer T, Kiang NYS. A theoretical treatment of latency, group delay, and tuning characteristics for auditory-nerve responses to clicks and tones. In: Sachs MB (ed) Physiology of the Auditory System. Baltimore, MD, National Educational Consultants, pp. 133–141, 1971.
- Goupell MJ, Hartmann WM. Interaural fluctuations and the detection of interaural incoherence: bandwidth effects. J. Acoust. Soc. Am. 119:3971–3986, 2006. [DOI] [PubMed]
- Grantham DW. Detectability of time-varying interaural correlation in narrow-band noise stimuli. J. Acoust. Soc. Am. 72:1178–1184, 1982. [DOI] [PubMed]
- Grantham DW. Motion aftereffects with horizontally moving sound sources in the free field. Percept. Psychophysiol. 45:129–136, 1989. [DOI] [PubMed]
- Grantham DW, Wightman FL. Detectability of varying interaural temporal differences. J. Acoust. Soc. Am. 63:511–523, 1978. [DOI] [PubMed]
- Greenwood DD, Joris PX. Mechanical and “temporal” filtering as codeterminants of the response by cat primary fibers to amplitude-modulated signals. J. Acoust. Soc. Am. 99:1029–1039, 1996. [DOI] [PubMed]
- Heil P. First-spike latency of auditory neurons revisited. Curr. Opin. Neurobiol. 14:461–467, 2004. [DOI] [PubMed]
- Ingham NJ, McAlpine D. Spike-frequency adaptation in the inferior colliculus. J. Neurophysiol. 91:632–645, 2004. [DOI] [PubMed]
- Joris PX, Yin TCT. Responses to amplitude-modulated tones in the auditory nerve of the cat. J. Acoust. Soc. Am. 91:215–232, 1992. [DOI] [PubMed]
- Joris PX, Schreiner CE, Rees A. Neural processing of amplitude-modulated sounds. Physiol. Rev. 84:541–577, 2004. [DOI] [PubMed]
- Joris PX, van de Sande B, Recio-Spinoso A, van der Heijden M. Auditory midbrain and nerve responses to sinusoidal variations in interaural correlation. J. Neurosci. 26:279–289, 2006. [DOI] [PMC free article] [PubMed]
- Kim DO, Molnar CE. A population study of cochlear nerve fibers: comparison of spatial distributions of average-rate and phase-locking measures of responses to single tones. J. Neurophysiol. 42:16–30, 1979. [DOI] [PubMed]
- Krishna BS, Semple MN. Auditory temporal processing: responses to sinusoidally amplitude-modulated tones in the inferior colliculus. J. Neurophysiol. 84:255–273, 2000. [DOI] [PubMed]
- Kuwada S, Stanford TR, Batra R. Interaural phase sensitive units in the inferior colliculus of the unanesthetized rabbit. Effects of changing frequency. J. Neurophysiol. 57:1338–1360, 1987. [DOI] [PubMed]
- Kuwada S, Batra R, Yin TCT, Oliver DL, Haberly LB, Stanford TR. Intracellular recordings in response to monaural and binaural stimulation of neurons in the inferior colliculus of the cat. J. Neurosci. 17:7565–7581, 1997. [DOI] [PMC free article] [PubMed]
- Langner G, Schreiner CE. Periodicity coding in the inferior colliculus of the cat. I. Neuronal mechanisms. J. Neurophysiol. 60:1799–1822, 1988. [DOI] [PubMed]
- Licklider JCR, Webster JC, Hedlun JM. On the frequency limits of binaural beats. J. Acoust. Soc. Am. 22:468–473, 1950. [DOI]
- Malone BJ, Scott BH, Semple MN. Context-dependent adaptive coding of interaural phase disparity in the auditory cortex of awake macaques. J. Neurosci. 22:4625–4638, 2002. [DOI] [PMC free article] [PubMed]
- Mardia KV, Jupp PE. Directional Statistics. New York, Wiley, 1999.
- McAlpine D, Jiang D, Palmer AR. A neural code for low-frequency sound localization in mammals. Nat. Neurosci. 4:396–401, 2001. [DOI] [PubMed]
- McAlpine D, Jiang D, Shackleton TM, Palmer AR. Responses of neurons in the inferior colliculus to dynamic interaural phase cues: evidence for a mechanism of binaural adaptation. J. Neurophysiol. 83:1356–1365, 2000. [DOI] [PubMed]
- McMullen NT, Glaser EM. Tonotopic organization of rabbit auditory cortex. Exp. Neurol. 75:208–220, 1982. [DOI] [PubMed]
- Middlebrooks JC. Auditory cortex phase locking to amplitude-modulated cochlear implant pulse trains. J. Neurophysiol. 100:76–91, 2008. [DOI] [PMC free article] [PubMed]
- Miller LM, Escabi MA, Read HL, Schreiner CE. Spectrotemporal receptive fields in the lemniscal auditory thalamus and cortex. J. Neurophysiol. 87:516–527, 2002. [DOI] [PubMed]
- Nelson PC, Carney LH. Neural rate and timing cues for detection and discrimination of amplitude-modulated tones in the awake rabbit inferior colliculus. J. Neurophysiol. 97:522–539, 2007. [DOI] [PMC free article] [PubMed]
- Palmer AR, Rees A, Caird D. Interaural delay sensitivity to tones and broad band signals in the guinea-pig inferior colliculus. Hear. Res. 50:71–86, 1990. [DOI] [PubMed]
- Papoulis A. Signal Processing. New York, McGraw-Hill, 1962.
- Perrott DR, Nelson MA. Limits for the detection of binaural beats. J. Acoust. Soc. Am. 46:1477–1481, 1969. [DOI] [PubMed]
- Pfeiffer RR, Molnar CE. Cochlear nerve fiber discharge patterns: relationship to the cochlear microphonic. Science 167:1614–1616, 1970. [DOI] [PubMed]
- Reale RA, Brugge JF. Auditory cortical neurons are sensitive to static and continuously changing interaural phase cues. J. Neurophysiol. 64:1247–1260, 1990. [DOI] [PubMed]
- Rees A, Moller AR. Stimulus properties influencing the responses of inferior colliculus neurons to amplitude-modulated sounds. Hear. Res. 27:129–143, 1987. [DOI] [PubMed]
- Rhode WS. A digital system for auditory neurophysiological research. In: Brown P (ed) Current Computer Technology in Neurobiology. Washington D.C., Hemisphere, pp. 543–567, 1976.
- Rose HJ, Metherate R. Auditory thalamocortical transmission is reliable and temporally precise. J. Neurophysiol. 94:2019–2030, 2005. [DOI] [PubMed]
- Schreiner CE, Urbas JV. Representation of amplitude modulation in the auditory cortex of the cat. II. Comparison between cortical fields. Hear. Res. 32:49–63, 1988. [DOI] [PubMed]
- Sivaramakrishnan S, Oliver DL. Neuronal responses to lemniscal stimulation in laminar brain slices of the inferior colliculus. J. Assoc. Res. Otolaryngol. 7:1–14, 2006. [DOI] [PMC free article] [PubMed]
- Siveke I, Ewert SD, Grothe B, Wiegrebe L. Psychophysical and physiological evidence for fast binaural processing. J. Neurosci. 28:2043–2052, 2008. [DOI] [PMC free article] [PubMed]
- Spitzer MW, Semple MN. Responses of inferior colliculus neurons to time-varying interaural phase disparity: effects of shifting the locus of virtual motion. J. Neurophysiol. 69:1245–1263, 1993. [DOI] [PubMed]
- Stecker GC, Harrington IA, Middlebrooks JC. Location coding by opponent neural populations in the auditory cortex. PLoS Biol. 3:e78, 2005. [DOI] [PMC free article] [PubMed]
- Ter-Mikaelian M, Sanes DH, Semple MN. Transformation of temporal properties between auditory midbrain and cortex in the awake Mongolian gerbil. J. Neurosci. 27:6091–6102, 2007. [DOI] [PMC free article] [PubMed]
- Viemeister NF. Temporal factors in audition: a system analysis approach. In: Evans Wilson EFJP (ed) Psychophysics and Physiology of Hearing. London, Academic, 1977.
- Viemeister NF. Temporal modulation transfer functions based upon modulation thresholds. J. Acoust. Soc. Am. 66:1364–1380, 1979. [DOI] [PubMed]
- Yin TCT, Kuwada S. Binaural interaction in low-frequency neurons in inferior colliculus of the cat. II. Effects of changing rate and direction of interaural phase. J. Neurophysiol. 50:1000–1019, 1983a. [DOI] [PubMed]
- Yin TCT, Kuwada S. Binaural interaction in low-frequency neurons in inferior colliculus of the cat. III. Effects of changing frequency. J. Neurophysiol. 50:1020–1042, 1983b. [DOI] [PubMed]
- Yin TCT, Chan JCK. Interaural time sensitivity in medial superior olive of cat. J. Neurophysiol. 64:465–488, 1990. [DOI] [PubMed]


