

Abstract
The affinity between the 1–157 and 158–238 fragments of green fluorescent protein (GFP) is too low for spontaneous in vivo reassembly of the protein upon co-expression of the two fragments. This prevents chromophore maturation and the cells lack GFP fluorescence. We have utilized the very high affinity between the two EF-hands of calbindin D9k to facilitate GFP assembly from its fragments and to introduce a calcium dependent molecular switch. In GFPN-EF1, residues 1–157 of GFP are fused to residues 1–43 of calbindin, and in EF2-GFPC, residues 44–75 of calbindin are fused to residues 158–238 of GFP. When co-expressed, GFPN-EF1 and EF2-GFPC associate spontaneously and rapidly resulting in a folded reconstituted protein with bright GFP fluorescence. The high affinity of GFPN-EF1 for EF2-GFPC leads to brighter fluorescence of the cells compared to cells with a control constructs carrying leucine zippers (Wilson et al., Nature Methods 2004;3:255). The complex of GFPN-EF1 and EF2-GFPC was purified from cells using metal-ion chelate chromatography and the temperature dependence of GFP fluorescence was found to be calcium dependent. The GFPN-EF1 and EF2-GFPC fragments were separated by ion exchange chromatography. The assembly of the fragments was found to be reversible and the complex was regained upon mixing, as evidenced by surface plasmon resonance (SPR) data. The affinity between GFPN-EF1 and EF2-GFPC as well as rates of association and dissociation were found to be Ca2+-dependent.
Keywords: split GFP, protein reconstitution, fragment complementation, protein stability, EF-hand, calcium dependence
Introduction
Green fluorescent protein (GFP) becomes fluorescent upon folding without the requirement of any cofactors. The chromophore is built from residues Ser65-Tyr66-Gly67 via a slow covalent reaction. The native fold of the protein is required for this reaction, which leads to maturation of the chromophore and the folding of GFP is shown to be slow and contain significantly populated intermediates.1 In folded GFP, the mature chromophore is located in the interior of a β-barrel structure2 yielding bright fluorescence, for review see for example.3 The wt protein has several excitation peaks and in order to obtain only one peak, GFP was mutated. One construct that only shows one excitation peak at 475 nm and emission at 505 nm has the following six mutations compared to wt GFP: F64L, S65C, Q80R, Y151L, I167T, and K238N. This variant is used in the current study, and the chromophore is produced from C65-Y66-G67, which gives bright green fluorescence. Similar properties are described for a mutant with four of these substitutions (F64L, S65C, I167T, and K238N).4
The correct folding of GFP seems to rely on its covalent structure, and in spite of the close proximity of the N- and C-termini, the protein has relatively low tolerance to manipulations such as circular permutation of the chain.5 Protein reconstitution is a process by which protein fragments upon mixing reconstitute to produce the same fold as the intact chain, often with regained function, but with lower stability towards denaturation. The affinity between GFP fragments seems to be too low for reconstitution and chromophore maturation under normal conditions, reflecting that circular permutation and protein reconstitution rely on the same molecular principles.6 For example, fragments comprising residues 1–157 (GFPN) and 158–238 (GFPC) reconstitute with too low affinity for fluorescence to be observed upon co-expression of the fragments. However, these two fragments of GFP can be fused separately to two different proteins (or other molecules) whose interaction promotes assembly and folding of GFP and thereby chromophore development.7–9 Complex formation between the fusion partners raises the effective concentration of the GFP fragments for one another favoring their association and folding and the fluorescence will develop slowly in an irreversible fashion.
Residues Q157 and K158 are found in a surface loop of GFP. This cut site is tolerated for circular permutation5 and can accommodate insertions of 20 amino acid long peptides with retained GFP fluorescence.10 The GFPN fragment harbors all the residues forming the GFP chromophore (C65-Y66-G67), but fluorescence does not develop until the native fold of GFP is formed through complementation with GFPC via the help from fusion partners. These properties form the basis for the split GFP reporter system, which has been used for in vivo screening of protein-protein interactions in bacteria,7–9,11 in yeast,12,13in plants14 and in vitro for monitoring protein conformational changes.15 In another split GFP system, complementation between fragments from residues 1–214 to residues 215–230 of GFP reassemble spontaneously and are used for screening of protein folding and solubility of the fused protein16–18 as well as for aggregation.19
In the present study, we have successfully coupled the split GFP system (with non-spontaneous reassembly) to another fragment complementation system (with spontaneous reassembly). The two fragments, residues 1–157 and residues 158–238, of GFP are fused separately to two different fragments of the protein calbindin D9k, whose reconstitution reaction leads to assembly and folding of GFP and development of bright green fluorescence [Fig. 1]. The interaction between the two EF-hands, EF1 and EF2, of calbindin D9k facilitates reconstitution of GFPN with GFPC, and introduces a calcium switch for GFP assembly. We have studied the fluorescence both in vivo and in vitro, and the complex displays enhanced thermal stability and brighter fluorescence compared to the reference construct with leucine zippers.7,9 This is related to the higher affinity between EF1 and EF2 than between the leucine zippers. By surface plasmon resonance (SPR) technology the complex of EF1-GFPN and GFPC-EF2 is found to have a very high affinity that is calcium dependent, as previously found for EF1 and EF2.21,22 As expected, the affinity enhancement is reciprocal and the fusion with the GFP fragments renders the affinity between EF1-GFPN and GFPC-EF2 higher than between EF1 and EF2.
Figure 1.
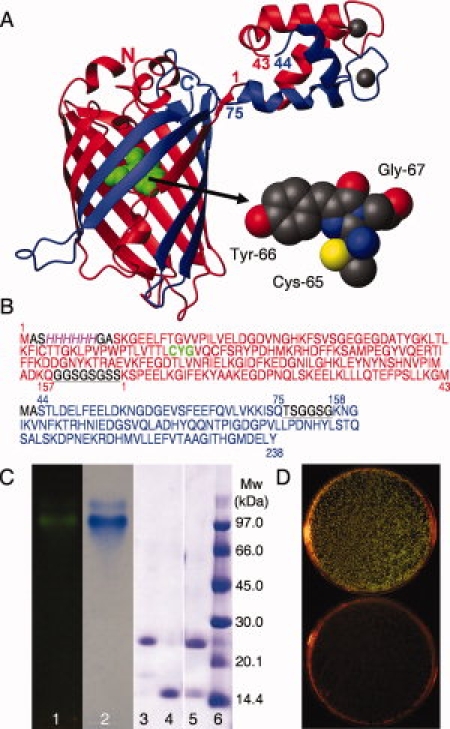
A, left) Cartoon of EF1 and EF2 from calbindin D9k fused to the N- and C-terminal fragments of GFP. The N-terminal fragment is shown in red and the C-terminal fragment in blue, with the N- and C-termini of GFP marked by letters, and the first and last residue of each EF-hand partner marked with numbers. The chromophore is shown in green. A, right) The chromophore formed by a covalent reaction between residues Cys 65, Tyr 66 and Gly 67 is shown in a space filling model. The figure was prepared using MOLMOL20 and the pdb files 1EMA and 4ICB. B): Amino acid sequences of the fragments forming the reconstituted protein. GFP-N (res. 1–157) and EF1 of calbindin D9k (res. 1–43) are red and the chromophore marked in green, EF2 of calbindin D9k (res. 44–75) and GFP-C (res. 158–238) are blue. The 6xHis-tag is also indicated (italic, magenta) and the linker regions between the fragments are black and underlined. C) Gel electrophoresis of the GFPN-EF1·EF2-GFPC complex and fragments. Lane 1: Agarose gel of GFPN-EF1·EF2-GFPC complex before coomassie staining visualized using a Dark Reader DR45M transilluminator. Lane2: Agarose gel of GFPN-EF1·EF2-GFPC complex after coomassie staining. Lanes 3–6: SDS-PAGE; 3: GFPN-EF1, 4: EF2-GFPC, 5: GFPN-EF1·EF2-GFPC complex, 6: Molecular weight standard. D) Co-transformation of the plasmids coding for GFPN-EF1 and EF2-GFPC give green colonies when spread on inducing media, plate B, (top) but not when spread on media containing only the antibiotics, plate A (bottom).
Results and Discussion
Co-expression and fluorescence time dependence
Co-transformation of the plasmids coding for GFPN-EF1 and EF2-GFPC was efficient and all colonies growing under inducing conditions (plate B) showed bright green fluorescence after 24 h [Fig. 1(D), top plate]. The development of green fluorescence from bacteria growing on agar plates was monitored continuously in 96-well format in a fluorescence plate reader at 30°C. In the first experiment, 48 wells contained bacteria originating from one colony obtained after co-transformation of GFPN-EF1 and EF2-GFPC, and another 48 wells contained bacteria originating from one colony obtained after co-transformation of GFPN-ZN and ZC-GFPC. As shown in Figure 2(A), the majority of wells with GFPN-EF1 and EF2-GFPC (39 wells) displayed significantly higher fluorescence intensity compared to wells with GFPN-ZN and ZC-GFPC (37 wells). As shown in Figure 2(B), green fluorescence is not developed in all wells. The reason for this is not clear but these data are highly similar to those observed for bacteria grown under non-inducing condition [Fig. 2(C)] suggesting that bacteria in these wells fail to express one or both fragments. A second experiment followed bacteria from six colonies obtained after co-transformation of GFPN-EF1 and EF2-GFPC (in eight wells each), and in another 6 × 8 wells bacteria originating from six colonies obtained after co-transformation of GFPN-ZN and ZC-GFPC, and the averages over each set of eight wells are displayed in Figure 2(D). Also in this case, some wells seemed to contain uninduced bacteria and these are not included in the averages. Again the majority of wells with GFPN-EF1 and EF2-GFPC displayed significantly higher fluorescence intensity compared to wells with GFPN-ZN and ZC-GFPC. The same conclusion was obtained in a third experiment with three colonies of each fusion couple (data not shown). Our data show that EF1 and EF2 interact with high affinity when fused to the GFP fragments promoting in vivo assembly and folding of GFP with chromophore maturation. The enhanced fluorescence intensity compared to the reference construct is most likely an effect of the higher affinity between EF1 and EF2 compared to ZN and ZC.
Figure 2.
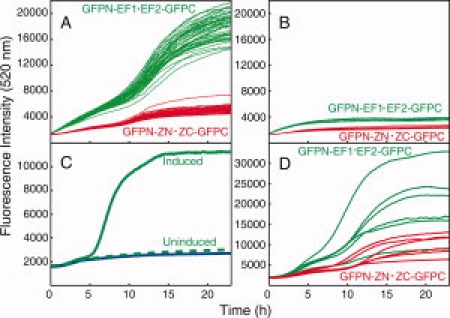
Fluorescence intensity as a function of time for co-expression of GFPN-EF1 and EF2-GFPC (green) or GFPN-ZN and ZC-GFPC (red) in black 96-well microplates. A and B: Fluorescence curves in vivo stemming from one colony for each case plated in 48 different wells. A) Data for 39 wells with GFPN-EF1 and EF2-GFPC and 37 wells with GFPN-ZN and ZC-GFPC. B) Data for nine wells with GFPN-EF1 and EF2-GFPC and 11 wells with GFPN-ZN and ZC-GFPC, that failed to develop fluorescence after 5 h. C) Comparison between the fluorescence from bacteria growing on inducing medium that do develop green fluorescence (green) and do not develop fluorescence (green, dashed) and with bacteria growing on non-inducing medium (blue). D) Fluorescence from six colonies with GFPN-EF1 and EF2-GFPC and six colonies with GFPN-ZN and ZC-GFPC shown as averages over wells, developing fluorescence, inoculated from the same colony.
The green fluorescence from the co-expressed GFPN-EF1 and EF2-GFPC follows a similar kinetic development as the reference construct with leucine zippers (GFPN-ZN·ZC-GFPC) This indicates that the number of reconstituted and correctly folded GFP with matured chromophore is higher for GFPN-EF1 and EF2-GFPC compared to GFPN-ZN and ZC-GFPC, while for those individuals that do assemble, the rate of folding and maturation is similar in the two cases.
Purification of the GFPN-EF1.EF2-GFPC complex
After co-expression in liquid culture, the complex of GFPN-EF1 and EF2-GFPC was purified using NTA chelate chromatography in the presence of Ni2+ and Ca2+. The GFPN-EF1.EF2-GFPC complex is eluted from the Ni2+-NTA column when imidazole is added and runs as one band with green fluorescence under non-denaturing conditions on agarose-gel electrophoresis [Fig. 1(C), lanes 1 and 2]. In denaturing sodium dodecyl sulphate (SDS) polyacrylamide gel electrophoresis (PAGE) the fragments are separated and two gel bands with the expected sizes are observed [Fig. 1(C), lane 5]. This shows that the purified fraction contains both fragments GFPN-EF1 and EF2-GFPC and the affinity between these two fragments is high enough to withstand separation both during washing of the column and under the forces applied during electrophoresis in a native gel system. After the NTA chelate chromatography the sample was only 90% pure and was therefore subjected to size exclusion chromatography to isolate the pure GFPN-EF1.EF2-GFPC complex, which was then used in fluorescence and CD spectroscopy. To ensure a folded, dimeric complex, far-UV CD spectra were recorded for the GFPN-EF1.EF2-GFPC complex at several concentrations. The spectra showed a combination of α-helix and β-sheet secondary structures, as expected, and the appearance of the spectra was independent of concentration suggesting that the complex does not aggregate further (data not shown). The preference for closed heterodimers over extended polymers could in part be due to the design which allows for assembly of closed heterodimers that restore all native contacts in both the GFP and calbindin parts without steric repulsion. There is also an entropic factor that disfavors higher order assemblies and the equilibrium constant for 3D domain swapping of intact calbindin D9k is indeed very low.23 The possibility of forming polymeric aggregates therefore can not be excluded and needs to be investigated at much higher protein concentration than used in the present study.
Separation and reassembly–chromatography and fluorescence
An attempt was made to separate the fragments from one another by ion exchange chromatography in the presence of EDTA. This method is successfully used to separate EF1 from EF2 after CNBr cleavage of calbindin D9k at Met43,21 but failed to separate GFPN-EF1 and EF2-GFPC (data not shown). This implies that in the absence of Ca2+, the complex between GFPN-EF1 and EF2-GFPC is of higher affinity than that between EF1 and EF2. GFPN-EF1 and EF2-GFPC were therefore separated using ion exchange chromatography in the presence of EDTA and urea, followed by dialysis and concentration on centrifugal devices with Mw cutoff of 5 kDa. The two fragments were visible by coomassie staining after SDS PAGE [Fig. 1(C), lanes 3 and 4] and agarose-gel electrophoresis in the presence of calcium (data not shown). This shows that denaturation of the complex facilitates separation of GFPN-EF1 and EF2-GFPC.
Rates and affinity of reassembly
The rates of association and dissociation of GFPN-EF1 and EF2-GFPC were measured in the presence of EDTA or Ca2+ using SPR technology, and the affinity between the fragments was calculated from the rate constants. EF2-GFPC was immobilized in the dextran matrix on the sensor chip using amine coupling. GFPN-EF1 was injected in constant flow over the immobilized EF2-GFPC to study the association kinetics, followed by buffer injection to study the dissociation of the complex. Examples of data obtained at different GFPN-EF1 concentrations in the absence of Ca2+ (buffer with 3.4 mM EDTA, 10 mM Tris/HCl, pH 7.4, 150 mM KCl, 0.005% Tween20) are shown in Figure 3(A). Fitting to these data yield an association rate constant of kon = 1.0.105 M−1s−1 (±0.3.105 M−1s−1), and a dissociation rate constant of koff = 1.0.10−4 s−1 (±0.2.10−4 s−1). Thus the affinity in the absence of Ca2+ is around 1.0.109 M−1 (KD = 1 nM), whereas for EF1 and EF2 the affinity in EDTA was too low to be quantified by SPR.22 In the presence of 2 mM Ca2+, the dissociation is too slow to allow for reliable fitting–the decay in intensity over 24 h is of the same order as the instrument drift. Thus we can only say that koff ≤ 1.0.10−6 s−1. Fitting to the association phase data yield an association rate constant of kon = 1.5.105 M−1s−1 (±0.3.105 M−1s−1). This is lower than observed for EF1 and EF2 (kon = 4.106 M−1s−1,)22 indicating that assembly of the larger complex of GFPN-EF1 and EF2-GFPC is slower. This is in line with the slow folding of GFP.1 From the rate constants we derive a lower limit for the equilibrium association constant KA ≥ 1.5.1011 M−1 corresponding to an upper limit of the equilibrium dissociation constant KD ≤ 7 pM for the GFPN-EF1·EF2-GFPC complex in the presence of Ca2+. Our data show that the GFPN-EF1·EF2-GFPC complex is of very high affinity both in the absence and presence of calcium and that it is at least 150 times stronger in the presence of Ca2+. Moreover, the data obtained in EDTA show that the affinity enhancement within the complex is reciprocal–while the complex formation between the EF1 and EF2 parts promotes assembly and folding of GFP parts, the assembly of the GFP parts leads to a higher overall affinity of the complex compared to that of isolated EF1 and EF2.
Figure 3.
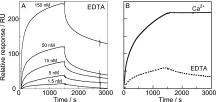
SPR-data for the interaction between the GFPN-EF1 and EF2-GFPC in the presence and absence of calcium. A) Association and dissociation curves in 3.4 mM EDTA for EF2-GFPC at five different concentrations, indicated in the figure, flown over immobilized GFPN-EF1. B) Comparison of SPR data for 15 nM EF2-GFPC flown over immobilized GFPN-EF1 in the presence of 2 mM CaCl2 (solid) or 3.4 mM EDTA (dashed).
The affinity between the EF-hands in the presence of calcium is KD = 3 pM22 while the antiparallel leucine zipper peptides have a KD of 20 μM.9 With the GFP fragments fused to the leucine zippers the affinity was drastically increased by almost a factor of 1000 yielding a KD = 31 nM,7 thus it is likely that the affinity of GFPN-EF1 for EF2-GFPC in the presence of Ca2+ is much higher than the limit derived from the present experiments (KD ≤ 7 pM).
Temperature dependence of green fluorescence
The green fluorescence of the GFPN-EF1·EF2-GFPC and GFPN-ZN·ZC-GFPC complexes showed similar fluorescence spectra (data not shown) and for the GFPN-EF1·EF2-GFPC complex there is a slight increase in intensity with the addition of calcium [Fig. 4(A)] that is not observed for the GFPN-ZN·ZC-GFPC complex (data not shown).
Figure 4.
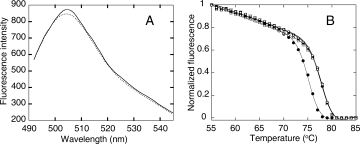
Green fluorescence for the GFPN-EF1·EF2-GFPC complex. A) Fluorescence spectra for two different calcium concentrations; 1 mM EDTA (dotted) and 10 mM Ca2+ (solid). B) Thermal denaturation of the GFPN-EF1·EF2-GFPC complex at different calcium concentrations observed from following the green fluorescence with temperature. The symbols are data points (1 mM EDTA •, 10 μM Ca2+ ▪, 100 μM Ca2+ x, 1 mM Ca2+ [♦], 10 mM Ca2+ ▵) and the lines show Eq. (1) fit to data. The fluorescence is normalized with respect to the highest and lowest value and the Tm-values from the fits are shown in Table I.
The thermal stability of the GFPN-EF1·EF2-GFPC complex was investigated by monitoring the fluorescence of the GFP chromophore at 503 nm during continuous temperature increase. The denaturation curves show a cooperative denaturation process during which the fluorescence is lost [Fig. 4(B)]. Moreover, the GFPN-EF1·EF2-GFPC complex becomes more stable with increasing calcium concentration; a trend that is not observed for the reference construct with leucine zippers [Fig. 4(B) and Table I]. This shows that Ca2+-binding to the GFPN-EF1 EF2-GFPC complex increases its thermal stability. Thus the Ca2+-induced enhancement of the affinity between GFPN-EF1 and EF2-GFPC is paralleled by an increase in stability of the complex towards denaturation.
Table I.
Apparent Thermal Stabilities of the GFPN-EF1·EF2-GFPC and GFPN-ZN·ZC-GFPC Complexes at Different Calcium Concentrations. Apparent Tm-Values were Obtained by Fitting Eq. (1)to Normalized Fluorescence Data
| Condition | Tm (oC) GFPN-EF1·EF2-GFPC | ± (°C) | Tm (oC) GFPN-ZN·ZC-GFPC | ± (°C) |
|---|---|---|---|---|
| 1 mM EDTA | 75.3 | 0.10 | 75.3 | 0.16 |
| 10 μM Ca2+ | 78.0 | 0.13 | ||
| 100 μM Ca2+ | 78.1 | 0.16 | ||
| 1 mM Ca2+ | 78.1 | 0.16 | ||
| 10 mM Ca2+ | 78.2 | 0.14 | 75.6 | 0.12 |
In conclusion, we have shown that fusion of the two EF-hands of calbindin D9k to split GFP increases the affinity between the fused fragments in a calcium dependent manner. The system presented here might be put to broad use for in vivo studies of gene regulation and protein processing and for in vitro studies of association of protein fragments. Moreover, the fluorescence intensity in vivo is higher compared to the reference construct of leucine zippers. Clearly, EF1 and EF2 are more potent as split GFP fusion partners than the ZN - ZC couple and produce brighter green fluorescence. This is related to the higher affinity between EF1 and EF2 compared to ZN and ZC. Our results imply that the split GFP system can be utilized for screening for higher affinity fusion partners, and thereby more stable proteins, because increased affinity between fragments in a reconstituted protein correlates with increased stability of the corresponding intact protein.6,22,27 Hence, the multi-well micro plate set up for continuous fluorescence measurement in vivo is an excellent screening system for protein stabilization using split GFP as a reporter.
Materials and Methods
Cloning
The EF-hand genes for the constructs GFPN-EF1 and EF2-GFPC were prepared by PCR using as a template the PetSac plasmid with the gene for bovine minor A calbindin D9k.24 The primers GFPNCBD9kNstart and GFPNCBD9kNstop were used to produce the PCR band covering the N-terminal EF-hand of calbindin D9k, EF1, with XhoI and BamHI restriction sites, to allow cloning into the pET11a-link-GFP vector. The primers CBD9kCGFPCstart and CBD9kCGFPCstop were used to produce the PCR band covering the C-terminal EF-hand of calbindin D9k, EF2, with NcoI and AatII restriction sites to allow cloning into the pMRBAD-link-CGFP vector.
The primer sequences are as follows:
GFPNCBD9kNstart : 5′-AATAATCTCGAGCAAATCTCCGGAAGAACTGAAAGG
GFPNCBD9kNstop: 5′-AATAATGGATCCTTACATACCTTTCAGCAGAGACGGGAAC
CBD9kCGFPCstart: 5′-AATAATCCATGGCTAGCACTCTGGATGAACTGTTCG'
CBD9kCGFPCstop: 5′- AATAAGACGTCCCCTGAGAGATCTTCTTAACCAGAACC
The PCR program consisted of: 95°C, 2 min; 30x(95°C, 30 s; 66°C, 30 s; 72°C, 45 s); 72°C, 7 min using the Expand High Fidelity PCR system (Roche Diagnostics, Indianapolis, IN). The PCR products were investigated and purified by agarose gel electrophoresis using GFX™ PCR, DNA and Gel Band Purification Kit (GE healthcare, Uppsala, Sweden).
The pET11a-link-GFP and pMRBAD-link-CGFP vectors, absorbed onto a filter paper were provided as gifts from Professor Lynne Regan, Yale University, and were amplified and purified using Qiagen Plasmid Purification Midi kit (Qiagen, Hilden, Germany).
The pET11a-link-GFP vector and GFPN-EF1 PCR product were digested with BamHI (NEB, Ipswich, MA) and XhoI (NEB) according to the recommendations in.8 The pMRBAD-link-CGFP vector and EF2-GFPC PCR product were digested with AatII (NEB) and NcoI (NEB) in a sequential manner where AatII was used at 1/3 of the concentration compared to the BamHI, XhoI and NcoI enzymes due to the enzyme's sensitivity to glycerol. Digested DNA was purified by agarose gel electrophoresis and GFX™ PCR, DNA and Gel Band Purification Kit (GE healthcare, Uppsala, Sweden).
The digested PCR fragments were ligated into the appropriate vector using T4 DNA ligase (USB, Cleveland, OH) and the ligation product was transformed into E. coli ER2566 by electroporation. Colonies growing on LB/agar containing 100 μg/mL Amp (pET11a-link-GFP ligation product) and 35 μg/mL Kan (pMRBAD-link-CGFP ligation product) were picked, amplified and purified using FastPlasmid Mini kit (Eppendorf AG, Hamburg, Germany). Purified plasmids were cut with the appropriate restriction enzymes to identify plasmids containing inserts, and the DNA of these plasmids was sequenced (purchased at BM Unit, Furulund, Sweden) to identify plasmids containing the correct insert.
The pET11a-link-GFP and pMRBAD-link-CGFP vectors were supplied as kind gifts from Professor Lynne Regan, Yale Univeristy. Details about the vectors can be found in Ref. 8 and at http://www.yale.edu/reganlab/publications.html.
The protein sequences of the GFP-EF1 and EF2-GFPC constructs are shown in Figure 1(B) together with a cartoon of the reconstituted complex Figure 1(A).
Co-expression of GFPN-EF1·EF2-GFPC and purification of the complex
The plasmids (1 μL of each at a concentration of 100 mg/L) coding for GFPN-EF1 and EF2-GFPC were co-transformed into 40 μL of electrocompetent E. coli of strain ER2566 by electroporation and spread on A plates (LB containing, 1.5% agar, 100 μg/mL Amp and 35 μg/mL Kan). The A plates were incubated at room temperature for 24 h. Single colonies were then picked and each colony streaked both on A plates and B plates (LB containing, 1.5% agar, 100 μg/mL Amp, 35 μg/mL Kan, 10 μM IPTG and 0.2% (w/v) arabinose). Overnight cultures were inoculated with four colonies from plate A that were found to yield green colonies on plate B after 24 h at room temperature. Four overnight cultures (50 mL each) were grown at 27°C, and 15 mL from each was then diluted into 500 mL LB with 100 μg/mL Amp, 35 μg/mL Kan, 10 μM IPTG and 0.2% (w/v) arabinose and the cultures were grown for 24 h at 27°C. Cells were harvested by centrifugation at 6000g for 5 min.
The GFPN-EF1·EF2-GFPC complex was purified using metal ion chelate chromatography, Ni-NTA (Qiagen, Hilden, Germany), employing the hexa-histidine tag, which is located N-terminal to GFPN-EF1. Pellets from a total culture volume of 2 L were resuspended in 100 mL of 20 mM Tris/HCl, 0.1M NaCl, pH 8 (buffer A) on ice, sonicated for 5 min (1/2 horn, output 10, duty cycle 50%) and centrifuged for 10 min at 27,000g. The pellet was extracted by a second sonication and centrifugation in 70 mL of buffer A. The two supernatants (118 + 70 mL) were combined and pumped onto a 1.5 × 12 cm Ni-NTA column (Qiagen, Hilden, Germany) equilibrated in buffer A with 1 mM CaCl2. The column was washed with 100 mL buffer A and eluted with 60 mL 0.7M imidazole/HCl pH 8, followed by 60 mL 8M urea pH 8 and 100 mL H2O. Fractions were analyzed by UV absorbance at 280 nm, SDS PAGE and agarose gel electrophoresis in two separate gels in 75 mM sodium barbiturate buffer pH 8.6, one with 2 mM CaCl2 and one with 2 mM EDTA. The GFP fluorescence from the gels was monitored before coomassie staining using a Dark Reader DR45M transilluminator (Clare Chemical Research, Dolores, CO), and green fluorescent bands were observed in fractions 42–47 (strong peak at fraction 43) during the imidazole elution on the SDS PAGE gel and on the agarose gels, both in EDTA and in Ca2+. The presence of a single green band on the SDS PAGE gel and two bands on the agarose gel indicates that the protein is partly deamidated. There is one potential asparagine-glycine deamidation site at position 23 in GFPN, and one at position 56 in EF2.25 In addition glutamine 157 is followed by a glycine in the linker. Fractions 43–46 were pooled (total 15 mL) and diluted with H2O to 105 mL and pumped onto a 1.5 × 10 cm anion exchange, DEAE sephacel (GE healthcare, Uppsala, Sweden), column in 20 mM Tris/HCl, 0.1 mM CaCl2, pH 8 (buffer B). The column was eluted using a linear salt gradient from 50 to 400 mM NaCl in buffer B, total gradient volume 400 mL, and fractions analyzed by UV absorbance at 280 nm and agarose gel electrophoresis in 75 mM sodium barbiturate buffer pH 8.6, with 2 mM CaCl2. GFP fluorescence from the gel was monitored using a Dark Reader DR45M transilluminator before coomassie staining, revealing green fluorescence in fractions 30–36. The charge variants of the protein were partly separated on the ion exchange column and the majority of contaminating proteins were removed. Fractions 29–33 were pooled and purified by size exclusion chromatography with 1 mL applied at a time onto a 1 × 30 cm Superdex 200 column (GE healthcare, Uppsala, Sweden) to yield the pure GFPN-EF1.EF2-GFPC complex. The complex peaks from six runs were combined, aliquoted and used in the fluorescence and CD spectroscopy studies.
Co-expression of GFPN-ZN·ZC-GFPC and purification of the complex
GFPN-ZN and ZC-GFPN were co-expressed as described above for GFPN-EF1 and EF2-GFPN, except that the plasmids coding for GFPN-ZN and ZC-GFPC were used. The plasmids absorbed onto a filter paper were provided as gifts from Professor Lynne Regan, Yale University, and were amplified and purified using Qiagen Plasmid Purification Midi kit (Qiagen, Hilden, Germany). The GFPN-ZN·ZC-GFPC complex was purified from pellet from a 1.5-L culture using metal ion chelate (Ni-NTA, Qiagen, Hilden, Germany), anion exchange (DEAE sephacel, GE healthcare, Uppsala, Sweden) and size exclusion chromatography (Superdex 200 column, GE healthcare, Uppsala, Sweden) essentially as described above but with no CaCl2 added. Again two green bands were observed on agarose gel electrophoresis using a Dark Reader DR45M transilluminator after the metal chelate chromatography step, indicating that deamidation has occurred.
Separation of GFPN-EF1 and EF2-GFPC
The GFPN-EF1·EF2-GFPC complex was subjected to anion exchange chromatography in the presence of 8M urea in 20 mM Tris/HCl pH 8 with 3 mM EDTA. Urea was used because EDTA alone did not weaken the affinity between the two fragments enough to permit separation. According to SDS PAGE and agarose gel electrophoresis, the two fragments were well separated from one another, and the fractions were combined in two pools containing GFPN-EF1 and EF2-GFPC, respectively, and dialysed against 10 mM Tris/HCl, 50 mM NaCl, 0.5 mM EDTA, pH 8.
Co-expression and kinetics of green fluorescence development in vivo
The plasmids (1 μL of each at a concentration of 100 mg/L) coding for GFPN-EF1 and EF2-GFPC were co-transformed into 40 μL of the E. coli strain ER2566 using electroporation. The bacteria were incubated for 40 min at 37°C before spreading on plate A (LB containing, 1.5% agar, 100 μg/mL Amp and 35 μg/mL Kan) and plate B (LB containing, 1.5% agar, 100 μg/mL Amp, 35 μg/mL Kan, 10 μM IPTG and 0.2% (w/v) arabinose). The plates were incubated at room temperature and after about 24 h all colonies on plate B were green. Single colonies from plate A were picked and spread on fresh A plates. The bacteria were scraped off the plates and re-suspended in LB containing both antibiotics. Plates with bacteria stemming from different transformed colonies were scraped separately and the bacterial suspensions were diluted to obtain a suspension with an OD of 8 at 600 nm. To measure the kinetics and intensity of the development of the green color 20 μL of the bacterial suspension was distributed into wells in a 96-well Corning black plate with clear bottom prepared with 85 μL LB containing, 1.5% agar, 100 μg/mL Amp, 35 μg/mL Kan, 10 μM IPTG and 0.2% (w/v) arabinose. The development of the green fluorescence was recorded in a FluoStar Omega plate reader (LabVision, Stockholm, Sweden) with excitation at 485 nm and emission at 520 nm. In a parallel experiment, the plasmids coding for GFPN-ZN and ZC-GFPC were co-transformed, and handled in the exact same manner as described here for GFPN-EF1 and EF2-GFPC, to follow in parallel the development of green fluorescence from the complex of GFPN-ZN and ZC-GFPC. Control experiments where the fluorescence at 520 nm for the growth of the same complexes but without inducing media was performed in the same manner but the medium in the wells was LB containing, 1.5% agar, 100 μg/mL Amp, 35 μg/mL Kan. The curves were plotted and analyzed using Matlab (MathWorks, Natick, MA).
Surface plasmon resonance studies with immobilized targets
The SPR studies were performed on a Biacore 3000 (GE Healthcare, Uppsala, Sweden). The purified GFPN-EF1 was immobilized on CM5 sensor chip by amine coupling using standard procedures with GFPN-EF1 at 10–50 mg/L in 10 mM sodium acetate buffer pH 3.9. The association of EF2-GFPC was followed by an injection of 250 μL of EF2-GFPC at concentrations ranging from 1 to 100 nM in 10 mM Tris/HCl, pH 7.5 with 150 mM KCl, 0.005% (v/v) Tween20 and either 3.4 mM EDTA or 2 mM CaCl2 with the same buffer used as running buffer and a flow rate of 10 μL per minute. The dissociation of calmodulin was monitored for 3–30 h by continuous flow of buffer and the chip was then regenerated by a 50 μL injection of 10 mM HCl.
Analysis of surface plasmon resonance data
Dissociation phase data were analyzed by fitting a single exponential decay function
to the data. R is the response, A the amplitude and koff the dissociation rate constant. The variable parameters were koff and A.
Association phase data were analyzed by fitting the following function to the data with a fixed value of koff as obtained above.
 |
R is the response (in response units that are proportional to the mass of protein bound at the surface), c the EF2-GFPC concentration, kon the association rate constant, Rmax the signal that would have been obtained at full saturation of the immobilized targets, and R0 the response resulting from injection of the protein. The variable parameters were kon, Rmax, and R0. An estimate of KD was obtained as
Circular dichroism (CD) spectroscopy
Far-UV CD spectra were determined for the GFPN-EF1·EF2-GFPC and GFPN-ZN·ZC-GFPC complexes using a Jasco J-720 spectrometer (Jasco, Tokyo, Japan). Spectra were recorded at 25°C from 250 to 195 nm at 20 nm/min as an average of three scans with a bandwith of 1 nm, a resolution of 1 nm, and a response of 8 s.
Fluorescence spectra
The fluorescence spectra of GFP were determined for the GFPN-EF1·EF2-GFPC and GFPN-ZN·ZC-GFPC complexes using a Carey Eclipse Fluorescence Spectrophotometer (Varian, Palo Alto, CA). The excitation wavelength was set to 471 nm and the fluorescence spectrum was recorded from 490 to 550 nm at a slow scanning speed. The excitation bandwidth was 2.5 nm, the emission bandwidth was 5 nm and the temperature was 20°C. Each protein was studied in a buffer containing 10 mM Tris/HCl, pH 7.5 with either 1 mM EDTA or 10 mM Ca2+. The protein concentrations were 7.4 μM for GFPN-EF1·EF2-GFPC and 6.2 μM for GFPN-ZN·ZC-GFPC as determined using absorbance (using an extinction coefficient of 26,200 cm−1 M−1 at 474 nm appropriate for the used GFP variant).4
Temperature dependence of fluorescence intensity
The fluorescence of the GFP fusion complexes at 7.4 μM for GFPN-EF1·EF2-GFPC and 6.2 μM for GFPN-ZN·ZC-GFPC was followed as a function of temperature in a Perkin Elmer LS-50B spectrofluorometer (Perkin Elmer, Waltham, MA). The excitation wavelength was set to 471 nm and the emission wavelength was set to 503 nm to monitor the GFP chromophore fluorescence. The excitation bandwidth was 2.5 nm, the emission bandwidth was 5 nm and the temperature was incremented at a rate of 1°C/min. Each protein was studied in a buffer containing 10 mM Tris/HCl, pH 7.5 with either 1 mM EDTA, or 20 μM (no added Ca2+ determined using Quin 2 (2-[[bis[(carboxymethyl)amino]-5-methylphenoxy]-methyl]-6-methoxy-8-[bis(carboxymethyl)amino]quinoline),26 100, 1, or 10 mM Ca2+.
The denaturation process proved to be irreversible and hence a thermodynamic description of the stability is inadequate. Instead, the normalized data were qualitatively compared and ranked according to their relative stability in terms of the mid-point of the observed transition (Tm) as obtained by fitting Eq. (1) to the data
| (1) |
where Fobs is the observed fluorescence at 503 nm, kN, bN, kU and bU define the baselines of the native and unfolded states respectively. A is a parameter in the fitting process but has no value for an irreversible unfolding, T is the temperature in Kelvin and R is the gas constant. The non-linear least-square fitting of Eq. (1) to data was done using Kaleidagraph (Synergy Software, Essex Junction, VT).
Acknowledgments
The authors thank Professor Lynne Regan, Yale University, for providing the plasmids necessary for the work. Erik Hellstrand is gratefully acknowledged for help using Matlab.
Glossary
Abbreviations:
- Amp
ampicillin
- CD
circular dichroism
- EF2-GFPC
residues 44–75 of calbindin D9k fused to residues 158–238 of GFP
- GFP
green fluorescent protein
- GFPN-EF1
residues 1–157 of GFP fused to residues 1–43 of calbindin D9k
- GFPN-ZN
residues 1–157 of GFP fused to N-terminal peptide of the designed leucine zippers
- ZC-GFPC
C-terminal peptide of the designed leucine zippers fused to residues 158-238 of GFP
- IPTG
isopropyl β-d-1-thiogalactopyranoside
- Kan
kanamycin
- PAGE
polyacrylamide gel electrophoresis
- SDS
sodium dodecyl sulphate
- SPR
surface plasmon resonance
- Tris
tris(hydroxymethyl)aminomethane.
References
- 1.Huang JR, Craggs TD, Christodoulou J, Jackson SE. Stable intermediate states and high energy barriers in the unfolding of GFP. J Mol Biol. 2007;370:356–371. doi: 10.1016/j.jmb.2007.04.039. [DOI] [PubMed] [Google Scholar]
- 2.Ormö M, Cubitt AB, Kallio K, Gross LA, Tsien RY, Remington SJ. Crystal structure of the Aequorea victoria green fluorescent protein. Science. 1996;273:1392–1395. doi: 10.1126/science.273.5280.1392. [DOI] [PubMed] [Google Scholar]
- 3.Tsien RY. The green fluorescent protein. Ann Rev Biochem. 1998;67:509–544. doi: 10.1146/annurev.biochem.67.1.509. [DOI] [PubMed] [Google Scholar]
- 4.Palm GJ, Zdanov A, Gaitanaris GA, Stauber R, Pavlakis GN, Wlodawer A. The structural basis for spectral variations in green fluorescent protein. Nat Struct Biol. 1997;4:361–365. doi: 10.1038/nsb0597-361. [DOI] [PubMed] [Google Scholar]
- 5.Topell S, Hennecke J, Glockshuber R. Circularly permuted variants of the green fluorescent protein. FEBS Lett. 1999;457:283–289. doi: 10.1016/s0014-5793(99)01044-3. [DOI] [PubMed] [Google Scholar]
- 6.Carey J, Lindman S, Bauer M, Linse S. Protein reconstitution and three-dimensional domain swapping: benefits and constraints of covalency. Protein Sci. 2007;16:2317–2333. doi: 10.1110/ps.072985007. [DOI] [PMC free article] [PubMed] [Google Scholar]
- 7.Ghosh I, Hamilton AD, Regan L. Antiparallel leucine zipper-directed protein reassembly: application to the green fluorescent protein. J Am Chem Soc. 2000;122:5658–5659. [Google Scholar]
- 8.Wilson CG, Magliery TJ, Regan L. Detecting protein-protein interactions with GFP-fragment reassembly. Nat Methods. 2004;1:255–262. doi: 10.1038/nmeth1204-255. [DOI] [PubMed] [Google Scholar]
- 9.Magliery TJ, Wilson CGM, Pan WL, Mishler D, Ghosh I, Hamilton AD, Regan L. Detecting protein-protein interactions with a green fluorescent protein fragment reassembly trap: scope and mechanism. J Am Chem Soc. 2005;127:146–157. doi: 10.1021/ja046699g. [DOI] [PubMed] [Google Scholar]
- 10.Abedi MR, Caponigro G, Kamb A. Green fluorescent protein as a scaffold for intracellular presentation of peptides. Nucl Acids Res. 1998;26:623–630. doi: 10.1093/nar/26.2.623. [DOI] [PMC free article] [PubMed] [Google Scholar]
- 11.Sarkar M, Magliery TJ. Engineering a split-GFP reassembly screen to examine RING-domain interactions between BARD1 and BRCA1 mutants observed in cancer patients. Mol Biosyst. 2008;4:599–605. doi: 10.1039/b802481b. [DOI] [PubMed] [Google Scholar]
- 12.Barnard E, McFerran NV, Trudgett A, Nelson J, Timson DJ. Development and implementation of split-GFP-based bimolecular fluorescence complementation (BiFC) assays in yeast. Biochem Soc Trans. 2008;36:479–482. doi: 10.1042/BST0360479. [DOI] [PubMed] [Google Scholar]
- 13.Barnard E, McFerran NV, Trudgett A, Nelson J, Timson DJ. Detection and localisation of protein-protein interactions in Saccharomyces cerevisiae using a split-GFP method. Fungal Genet Biol. 2008;45:597–604. doi: 10.1016/j.fgb.2008.01.003. [DOI] [PubMed] [Google Scholar]
- 14.Ohad N, Shichrur K, Yalovsky S. The analysis of protein-protein interactions in plants by bimolecular fluorescence complementation. Plant Physiol. 2007;145:1090–1099. doi: 10.1104/pp.107.107284. [DOI] [PMC free article] [PubMed] [Google Scholar]
- 15.Jeong J, Kim SK, Ahn J, Park K, Jeong EJ, Kim M, Chung BH. Monitoring of conformational change in maltose binding protein using split green fluorescent protein. Biochem Biophys Res Commun. 2006;339:647–651. doi: 10.1016/j.bbrc.2005.11.056. [DOI] [PubMed] [Google Scholar]
- 16.Cabantous S, Pédelacq JD, Mark BL, Naranjo C, Terwilliger TC, Waldo GS. Recent advances in GFP folding reporter and split-GFP solubility reporter technologies. Application to improving the folding and solubility of recalcitrant proteins from Mycobacterium tuberculosis. J Struct Funct Genomics. 2005;6:113–119. doi: 10.1007/s10969-005-5247-5. [DOI] [PubMed] [Google Scholar]
- 17.Cabantous S, Terwilliger TC, Waldo GS. Protein tagging and detection with engineered self-assembling fragments of green fluorescent protein. Nat Biotechnol. 2005;23:102–107. doi: 10.1038/nbt1044. [DOI] [PubMed] [Google Scholar]
- 18.Cabantous S, Waldo GS. In vivo and in vitro protein solubility assays using split GFP. Nat Methods. 2006;3:845–854. doi: 10.1038/nmeth932. [DOI] [PubMed] [Google Scholar]
- 19.Chun WJ, Waldo GS, Johnson GVW. Split GFP complementation assay: a novel approach to quantitatively measure aggregation of tau in situ: effects of GSK3 beta activation and caspase 3 cleavage. J Neurochem. 2007;103:2529–2539. doi: 10.1111/j.1471-4159.2007.04941.x. [DOI] [PubMed] [Google Scholar]
- 20.Koradi R, Billeter M, Wüthrich K. MOLMOL: a program for display and analysis of macromolecular structures. J Mol Graph. 1996;14:51–55. doi: 10.1016/0263-7855(96)00009-4. [DOI] [PubMed] [Google Scholar]
- 21.Finn BE, Kordel J, Thulin E, Sellers P, Forsen S. Dissection of calbindin-D(9k) into 2 Ca2+-binding subdomains by a combination of mutagenesis and chemical cleavage. FEBS Lett. 1992;298:211–214. doi: 10.1016/0014-5793(92)80059-p. [DOI] [PubMed] [Google Scholar]
- 22.BerggÅrd T, Julenius K, Ogard A, Drakenberg T, Linse S. Fragment complementation studies of protein stabilization by hydrophobic core residues. Biochemistry. 2001;40:1257–1264. doi: 10.1021/bi0014812. [DOI] [PubMed] [Google Scholar]
- 23.HÅkansson M, Fast J, Svensson A, Linse S. An extended hydrophobic core induces EF-hand swapping. Protein Sci. 2001;10:927–933. doi: 10.1110/ps.47501. [DOI] [PMC free article] [PubMed] [Google Scholar]
- 24.Dell'Orco D, Xue WF, Thulin E, Linse S. Electrostatic contributions to the kinetics and thermodynamics of protein assembly. Biophys J. 2005;88:1991–2002. doi: 10.1529/biophysj.104.049189. [DOI] [PMC free article] [PubMed] [Google Scholar]
- 25.Chazin WJ, Kördel J, Thulin E, Hofmann T, Drakenberg T, Forsén S. Identification of an isoaspartyl linkage formed upon deamidation of bovine calbindin D9k and structural charcterization by 2D 1H NMR. Biochemistry. 1989;28:8646–8653. doi: 10.1021/bi00447a055. [DOI] [PubMed] [Google Scholar]
- 26.Linse S. Calcium binding to proteins studied via competition with chromophoric chelators. Methods Mol Biol. 2002;173:15–24. doi: 10.1385/1-59259-184-1:015. [DOI] [PubMed] [Google Scholar]
- 27.Xue WF, Szczepankiewicz O, Bauer MC, Thulin E, Linse S. Intra- versus intermolecular interactions in monellcontribution of surface charges to protein assembly. J Mol Biol. 2006;358:1244–1255. doi: 10.1016/j.jmb.2006.02.069. [DOI] [PubMed] [Google Scholar]