

Abstract
Previous diffusion tensor imaging (DTI) studies indicated microstructural disruption of white matter in alcohol dependence. To investigate the microstructure of primary neurocircuitry involved in alcohol use disorders, the present study used Tract-Based Spatial Statistics (TBSS) of DTI measures as well as probabilistic tractography. Eleven recovering alcoholics in their first week of abstinence from alcohol were compared with ten light drinking controls; diffusion measures were correlated with measures of neurocognition and drinking severity. Regions characterized by low fractional anisotropy and high mean diffusivity included cortico-striatal fibers and those in frontal white matter and limbic pathways. Greater diffusion abnormalities in sections of commissural fibers (inter-hemispheric connections) were associated with stronger drinking severity, and lower fractional anisotropy measures in frontal and limbic fiber tracts correlated with lower visuospatial memory performance. These study findings provide direct evidence of compromised integrity of the motivational brain circuitry in alcohol use disorders. These abnormalities in fiber connections could be partially responsible for deficiencies in executive functions, behavioral regulation, and impulse control commonly described in alcohol dependence.
Keywords: Alcohol use disorder; Cognition; Brain MRI; Diffusion tensor imaging, DTI; Tract-based spatial statistics, TBSS; Probabilistic tractography
1. INTRODUCTION
Water diffusion in the brain is influenced by the local microstructure of the tissue. Magnetic Resonance Diffusion Tensor Imaging (DTI) is a quantitative non-invasive and objective method for assessing the integrity of major white matter (WM) fiber tracts indirectly via measurement of the directionality of water diffusion (fractional anisotropy, FA) (Pierpaoli and Basser, 1996). FA reflects axonal diameter, axonal density and fiber tract complexity (Beaulieu, 2002). Water diffusion or mobility in WM is mainly hindered by myelin sheaths and cell membranes (Beaulieu, 2002) so that its movement is influenced by level of myelination and axonal density. More specifically, reduced FA can be attributed to degradation of both myelin sheaths and axonal membranes (Werring et al., 2000; Pierpaoli et al., 2001), abnormalities of myelin with sparing of the axonal fibers (Gulani et al., 2001; Song et al., 2002), or reduced density of axonal fibers (Takahashi et al., 2002). Mean diffusivity (MD), which is the overall mean-squared displacement of water molecules restricted by organelles and membranes (Neil et al., 1998), reflects cellular density and extracellular volume (Gass et al., 2001; Sotak, 2004) and relates to the volume fraction of the interstitial space (Sotak, 2004). Thus, low FA and high MD in the same brain region indicate higher intracellular or extracellular fluid associated with less organized myelin and/or axonal structure (Pfefferbaum and Sullivan, 2005). The spatial orientation of fibers can be derived from the eigenvalues from the diffusion tensor, and parallel (λ1) and perpendicular (λ2 and λ3) diffusion to the WM tract can be calculated; these are also referred to as axial diffusivity, λ∥ = λ1, and radial diffusivity, λ┴= (λ2+λ3)/2.
The hydrophobic myelin sheath hinders water movement perpendicular to axonal tracts (λ┴), imposing a preferential diffusion direction parallel (λ∥) to the WM tracts (Klingberg et al., 1999; Harsan et al., 2006). Therefore, an increase of λ┴ is thought to signify increased space between fibers (suggesting demyelination or dysmyelination) (Song et al., 2003; Harsan et al., 2006), whereas a decrease in λ∥ suggests axonal injury (Ito et al., 2002; Lazar et al., 2003).
In alcohol use disorders (AUD = alcohol abuse or dependence), microstructural WM integrity is thought to be disrupted by both demyelination and axonal structural abnormalities (Pfefferbaum and Sullivan, 2002; Pfefferbaum and Sullivan, 2005; Pfefferbaum et al., 2006a; Pfefferbaum et al., 2006b). These changes can be permanent or transient (Carlen et al., 1984). Permanent injury is thought to involve neuronal death with secondary axonal (Wallerian) degeneration, which has been documented in superior frontal lobe, hypothalamus and cerebellum [see (Oscar-Berman, 2000; Sullivan, 2000) for review]. Morphological abnormalities in AUD include transient changes and may include shrinkage of neuronal soma, dendritic pruning, decreased axonal size and density as well as myelin changes, which are manifested on magnetic resonance (MR) neuroimaging as reductions in brain tissue volume, metabolite abnormalities and decreased cerebral blood flow (Sullivan, 2000). Volumetric abnormalities may show partial to substantial recovery during short-term or extended sobriety [e.g., (Pfefferbaum et al., 1995; Gazdzinski et al., 2005; Yeh et al., 2007)]. However, AUD-related microstructural abnormalities have been observed in regions of WM that appear grossly normal on structural MRI (Sullivan and Pfefferbaum, 2003). For example, FA reductions were reported in the genu of the corpus callosum (cc) and the centrum semiovale (cs) that exhibited no gross lesions on standard structural images (Pfefferbaum et al., 2000; Pfefferbaum and Sullivan, 2002; Pfefferbaum and Sullivan, 2005; Pfefferbaum et al., 2006a; Pfefferbaum et al., 2007).
Recent research in AUD has focused on the brain reward circuitry, which is implicated in the development and maintenance of substance use disorders in general (Chambers et al., 2003; Sullivan et al., 2003; Kalivas and Volkow, 2005; Sullivan and Pfefferbaum, 2005; Sullivan, 2003; Bowirrat and Oscar-Berman, 2005). This network is comprised of dopaminergic afferents, which originate in the ventral tegmental area of the midbrain and project to the nucleus accumbens, prefrontal cortex, limbic, and striatal structures, and of reciprocal GABAergic or glutamatergic circuits connecting the dorsal anterior frontal cortex, orbitofrontal cortex, anterior cingulate cortex, and ventral striatum. Current DTI data analysis methods, which include voxelwise analysis, region-of-interest (ROI) analysis, and tractography, suffer from the low spatial precision of cross-subject image alignment, the residual misalignment due to group differences in ventricular size, and the lack of knowledge of the proper degree of spatial smoothing. Additionally, traditional linear affine transformations may result in geometric tract distortion upon coregistration of WM tracts between groups. Tract-Based Spatial Statistics (TBSS), which uses non-linear image transformation, is a newly developed technique that combines the strength of both voxelwise and tractography-based analyses (Smith et al., 2006). In this report, we demonstrate the application of TBSS to the investigation of the voxelwise differences of diffusion measures between alcohol dependent individuals (ALC) and non/light-drinking controls (LD). The goals of this study were 1) to implement TBSS of DTI data in ALC, 2) to describe and measure potential microstructural difference in the motivational neurocircuitry of ALC and LD, and 3) to correlate measures of drinking severity and neurocognition to the DTI measures of local WM microstructural abnormalities in ALC.
2. METHODS
All study participants were recruited as part of a larger magnetic resonance (MR) neuroimaging and cognition study to measure the effects of chronic drinking and smoking on the brain. Treatment-seeking alcoholics (ALC) were recruited from the Substance Abuse Day Hospital at the San Francisco Veterans Administration Medical Center and the San Francisco Kaiser Permanente Chemical Dependence Recovery Program, whereas light drinking controls (LD) were recruited by word-of-mouth and from the community via advertisements. To maximize group differences on outcome measures, we selected from a larger sample 11 ALC (47.0 ± 7.6 years) at the higher end of the drinking severity scale (374 ± 143 drinks/month in the year before study), 10 of whom were male chronic smokers demonstrating a medium to high level of nicotine dependence (5.5 ± 2.5) on the Fagerstrom Test for Nicotine Dependence (Fagerstrom, 1991). At the time of study, ALC were abstinent from alcohol for 6 ± 3 days, which was corroborated by daily testing for alcohol consumption (breathalyzer) by treatment personnel. All ALC participants met Diagnostic and Statistical Manual of Mental Disorders – Forth Edition (DSM-IV) (American Psychiatric Association, 1994) criteria for alcohol dependence. Ten male LD (42.7 ± 9.4 years, 24 ± 26 drinks/month) were chosen from our larger sample to equate the groups on age (P = 0.26); two LD were smokers. Inclusion and exclusion criteria as well as neuropsychological and psychiatric evaluations were previously described (Durazzo et al., 2004). In short, participants were free of general medical, neurological, and psychiatric conditions known or suspected to influence brain morphology or cognition, with the following exceptions: five individuals had medically treated hypertension and four were positive for the hepatitis C antibody. All participants positive for the hepatitis C antibody were also hypertensive. No participant with hepatitis C had a level of active disease that required medical intervention (e.g., interferon). Among ALC participants, three had alcohol-induced mood disorders with depressive features and one had alcohol-induced psychotic disorder with hallucinations. The above medical and psychiatric comorbidities were allowed, as they are highly prevalent among individuals meeting criteria for alcohol abuse or dependence (Stinson et al., 2005; Hasin et al., 2007). No participant had a history of substance abuse or dependence other than alcohol or nicotine. All ALC completed a brief cognitive battery that included assessment of visuospatial learning and memory [Brief Visuospatial Memory Test-Revised; BVMT-R; (Benedict, 2005)] within one day of the MR examination. Lifetime alcohol consumption was assessed via the lifetime drinking history (Skinner and Sheu, 1982; Sobell and Sobell, 1992), from which we derived average number of drinks per month over 1, 3 and 8 years prior to enrollment, and average number of drinks per month over lifetime. The Institutional Review Boards of the University of California San Francisco and the San Francisco VA Medical Center approved all procedures, and informed consent was obtained from all participants prior to study.
2.1. MRI acquisition
All examinations were preformed on a 1.5 Tesla MR system (Siemens Vision, Erlangen, Germany) equipped with a standard head coil. A single shot EPI DWI sequence ((TR/TE/TI=5000/100/3000ms, (2.4 × 2.4 × 5) mm3, 20 contiguous slices, NEX=1) used a double refocusing spin echo acquisition, bipolar external diffusion gradients with six non-collinear encoding directions (x,y,z) = (1, 0, 1), (-1, 0, 1), (0, 1, 1), (0, 1, -1), (1, 1, 0), (-1, 1, 0) and five b-values (0, 160, 360, 640, and 1000 sec/mm2). Inversion recovery reduced contributions from CSF to the diffusion signal, double-refocusing RF pulses with bipolar gradients reduced geometric image distortions due to eddy currents (Reese et al., 2003), and the b = 0 image was acquired for normalizing diffusion measurements. Structural T1-weighted magnetization-prepared rapid acquisition gradient echo images ((TR/TE/TI = 10/7/300 msec, flip angle = 15°, (1 × 1 × 1.4) mm3 resolution)) were used for spatial coregistration to the b = 0 diffusion image.
2.2. DTI data processing
For voxelwise diffusion modeling, diffusion data were analyzed using FMRIB’s Diffusion Toolbox within FSL 3.3 (http://www.fmrib.ox.ac.uk/fsl) (Smith et al., 2004). The diffusion-weighted images were preprocessed by aligning to the b = 0 image using linear image registration for motion correction (Jenkinson et al., 2002). A simple least squares fit of the tensor model and diffusion tensor made use of the five b values, and FA, MD, as well as tensor eigenvalues that describe λ∥ and λ┴ were then calculated. The diffusion at each voxel was modeled with a Bayesian approach that produced a probability distribution along the principle diffusion direction later used for probabilistic tractography (Behrens et al., 2003b).
TBSS (Smith et al., 2006) was used for voxelwise analysis of whole brain WM DTI measures. In short, the group mean FA image was created and thinned to generate a mean FA skeleton, which is thought to represent the centers of all white matter tracts common to the group. All FA images were co-registered to each other using nonlinear registration (Rueckert et al., 1999). The average amount of warping that was needed to align all other images to each FA image was estimated. The one that had the smallest amount of average warping was selected as a “target” image which was thought to be the most “typical” one of all study participants. All FA images were then nonlinearly transformed into the space of the target FA image. For each individual, local FA maxima were found along the perpendicular direction to the mean FA image and then projected onto the group template skeleton (Smith et al., 2006). The final image was normalized to MNI space (http://imaging.mrc-cbu.cam.ac.uk/imaging/MniTalairach) using linear transformations, FLIRT (Jenkinson et al., 2002). Voxelwise analyses across the group of study participants were carried out for all voxels with FA ≥ 0.20 to exclude peripheral tracts where significant inter-subject variability and/or partial volume effects with grey matter exist. The WM tracts were then identified using publicly accessible white mater atlases (http://www.dtiatlas.org) and tractography reports (Ito et al., 2002; Lazar et al., 2003).
2.3. Statistics
All statistical analyses were performed on (1*1*1) mm3 MNI space and significant peak voxels are reported in MNI template coordinates.
Group comparisons
General linear model analyses of ALC and LD evaluated the local group differences of measured FA, MD, λ∥ and λ┴ values across the whole WM skeleton, after regressing out the effects of age. Permutation testing was used to calculate the t-statistics maps (Nichols and Holmes, 2002). Statistical significance inference used two different approaches to correct for multiple comparisons: suprathreshold cluster size testing (Nichols and Holmes, 2002) and false discovery rate (FDR) (Benjamini and Hochberg, 1995). In the suprathreshold cluster size test, we calculated the corrected peak threshold (t > 1.5, P < 0.05) where voxels with t-statistics above a predetermined threshold (computed by comparing to the null distribution of the maximal suprathreshold cluster size) were clustered and deemed significant (Nichols and Holmes, 2002). In FDR analyses, only those voxels were considered significant that had estimated t-values from permutation tests greater than the computed t for the given 5% FDR and were part of a spatially continuous cluster size of 200 isotropic voxels or more. This ensures that on average no more than 5% of all voxels are misclassified as false positives.
Regression analyses in ALC group
We evaluated whether the voxelwise diffusion parameters derived from ALC participants correlated with measures of drinking severity and neurocognition, after accounting for the effect of age. Statistical inference P values were corrected for suprathreshold cluster size test after permutation testing as described above (t > 1.5, P < 0.05).
2.4. Probabilistic tractography
Voxels with FA identified as significantly different between ALC and LD on t-statistics maps in MNI space (after correction for multiple comparisons using suprathreshold cluster testing) were used as the seed mask for probabilistic tractography (Behrens et al., 2003b). All the tracking was performed in each subject’s DTI native space. Linear transformation, FLIRT, was used to calculate the transformation matrices between diffusion and T1 (6 degrees of freedom) spaces, T1 and standard spaces (12 degrees of freedom). The mean group tractogram was averaged at the standard space, and the final group difference was projected onto the target structural T1 image for better comprehension of anatomic structures. By drawing direction samples through the probability distributions of the fiber direction, the estimates of fiber pathways through the FA seed mask were built up along principle diffusion directions. For each individual, 5000 sample streamlines were generated from each seed voxel. The sampling streamlines were terminated after they traveled 2000 steps, using a step length of 0.5 mm, which corresponds to a distance of 1 m. We did not use FA to constrain tracking, but limited how sharply pathways can turn to exclude implausible pathways. The curvature threshold, which is the cosine of the minimum allowable angle between two steps, was set to 0.2, corresponding to a local curvature of ±80°. The pathways were identified if the number of samples was larger than 50% of 5000 samples generated from each seed voxel within the generated pathways (Ciccarelli et al., 2006). The initial group probability maps of FA tracts were created by summing up the respective individual tract masks and by dividing by the subject numbers of each group; in this way, the voxel values in the group probability map represent the percentage of participants in whom a pathway is present in each individual of the group. The final group probability maps of FA tracts were then created by thresholding the initial group probability maps at 55%, such that only those pathways that appeared in more than 55% of the population were considered to represent the group mean.
3. RESULTS
3.1. Group comparisons
Table 1 summarizes major results from analyses that used permutation testing for group comparisons and FDR (5%) for correction of multiple comparisons. Listed are the brain locations of significant voxels, the names of the major fiber tract, the maximal t-values of a cluster and its size, as well as the position of the maximal t-values in MNI space. Significance was thresholded at P < 0.05 with a cluster of at least 200 isotropic voxels. Table 2 summarizes the results obtained from group comparisons using the cluster size test (t > 1.5). Listed are group data, the locations of the voxel with the maximal t-values of the cluster, its size and corrected P-values.
Table 1.
Regions, diffusion measures, names of major fibers of the main clusters with significant difference between ALC and LD corrected with FDR (5% and larger than 200 voxles), cluster size, the t-value of the peak in the cluster and its MNI coordinates.
| Location | Measures# | Major Fiber tracts* | t-MAX | Voxels(mm3) | t-MAX X (mm) | t-MAX Y (mm) | t-MAX Z (mm) |
|---|---|---|---|---|---|---|---|
| Ventro-medial prefrontal/Inferior frontal | FA | R gcc/acr | 5.15 | 827 | 17 | 23 | -18 |
| L gcc/acr | 4.35 | 278 | -13 | 35 | 8 | ||
| λ┴ | R acr | 3.26 | 214 | 13 | 35 | -18 | |
| Orbito-frontal | FA | R unc/arcu | 3.95 | 288 | 35 | 32 | -14 |
| L unc/arcu | 5.67 | 486 | -35 | 46 | -2 | ||
| Dorso-medial prefrontal | FA | R scr | 4.09 | 441 | 18 | 26 | 33 |
| MD | L scr | 3.3 | 202 | -20 | 14 | 36 | |
| L cs | 4.3 | 332 | -19 | -5 | 48 | ||
| λ∥ | R scr/cs | 3.98 | 235 | 19 | -15 | 57 | |
| L scr/cs | 6.89 | 113 | -23 | -26 | 51 | ||
| L scr | 4.24 | 375 | -27 | 17 | 29 | ||
| λ┴ | R scr | 3.78 | 295 | 22 | 20 | 34 | |
| R scr | 3.22 | 292 | 21 | -6 | 39 | ||
| L scr | 3.83 | 226 | -19 | 22 | 35 | ||
| L bcc | 4.3 | 310 | 6 | -17 | 27 | ||
| Dorso-lateral prefrontal | FA | R slf | 4.55 | 328 | 50 | 12 | 31 |
| L slf | 4.52 | 310 | -40 | -33 | 33 | ||
| MD | R slf | 6.32 | 214 | 46 | 34 | 9 | |
| R slf | 5.47 | 1800 | 45 | -12 | 27 | ||
| L slf | 4.94 | 1142 | -43 | -29 | 33 | ||
| λ∥ | R slf | 5.68 | 1669 | 45 | -18 | 39 | |
| R slf | 5.17 | 453 | 48 | 9 | 11 | ||
| L slf | 4.21 | 143 | -53 | -10 | 33 | ||
| λ┴ | R slf | 5.42 | 1188 | 45 | -12 | 27 | |
| R slf | 7.12 | 832 | 50 | 11 | 30 | ||
| L slf | 4.94 | 1142 | -43 | -29 | 33 | ||
| Superior/MiddleTemporal | FA | R ec/ifo | 4.71 | 514 | 35 | -10 | -10 |
| MD | R ec/ifo | 4.59 | 711 | 42 | -19 | -14 | |
| L ec/ifo | 3.88 | 266 | -27 | 19 | -6 | ||
| λ∥+ | R ec/ifo/unc | 4.42 | 220 | 32 | -2 | -28 | |
| λ∥ | L ec/ifo | 3.98 | 217 | -30 | -7 | 11 | |
| λ┴ | R ec/ifo | 5.12 | 1618 | 20 | -40 | -2 | |
| InferiorTemporal | FA | L ilf | 4.16 | 276 | -57 | -46 | 0 |
| λ∥ | L ilf | 4.56 | 248 | -39 | -56 | -14 | |
| L ilf | 6.05 | 834 | -42 | -23 | -6 | ||
| λ┴ | R ilf | 3.39 | 217 | 42 | -7 | -24 | |
| L ilf | 4.38 | 212 | -50 | 5 | -20 | ||
| Subcortical Region | FA | R alic | 4.21 | 498 | 25 | 12 | 17 |
| L alic | 3.87 | 488 | -22 | 20 | 7 | ||
| L plic | 3.64 | 218 | -20 | -16 | -7 | ||
| MD | L alic | 6.5 | 243 | -20 | 12 | 7 | |
| λ∥ | L plic | 3.58 | 201 | -27 | -24 | -7 | |
| λ┴ | L alic | 5.58 | 523 | -26 | -4 | 27 | |
| Limbic pathways | FA | R icg | 5.89 | 710 | 24 | -32 | -15 |
| L pcg | 6.22 | 217 | -10 | -56 | 15 | ||
| fx | 3.96 | 414 | 4 | -16 | 19 | ||
| MD | R icg | 4.44 | 209 | 16 | -46 | 1 | |
| L icg | 4.67 | 221 | -23 | -30 | -13 | ||
| R dcg | 4.46 | 204 | 10 | -22 | 38 | ||
| λ∥ | L dcg | 4.41 | 215 | -8 | -3 | 37 | |
| λ┴ | R icg | 5.12 | 1618 | 20 | -40 | -2 | |
| L fx/st | 6.05 | 834 | -42 | -23 | -6 | ||
| Occipital lobe | FA | R or | 6.01 | 305 | 19 | -71 | 6 |
| L sfo | 5.13 | 264 | -34 | -66 | 38 | ||
| λ∥ | R or/ifo | 4.15 | 214 | 20 | -90 | 18 | |
| λ┴ | R or | 5.23 | 341 | 21 | -57 | -3 | |
| Parietal lobe | MD | R scr/cs | 3.88 | 286 | 28 | 52 | 51 |
| L scr/cs | 4.73 | 1119 | -24 | -46 | 52 | ||
| λ∥ | R scr/cs | 4.71 | 318 | 22 | -57 | 43 | |
| L scr/cs | 4.68 | 633 | -20 | -60 | 60 | ||
| λ┴ | R scr/cs | 4.67 | 317 | 16 | -48 | 63 | |
| Cerebellum | λ┴ | Vermal projections | 3.57 | 211 | -2 | -60 | -16 |
LD > ALC: FA, ALC> LD: MD, λ┴ and λ∥ (except +)
acr = anterior region of corona radiata, alic = anterior limb of internal capsule, arcu = arcuate fasiculus, bcc = body of corpus callosum, cs = centrum semiovale, dcg = dorsal region of cingulum, ec = extreme capsule, fx = fornix, gcc = genu of corpus callosum, icg = inferior region of cingulum, ifo = inferior fronto-occipital fasciculus, ilf = inferior longitudinal fasciculus, or = optic radiation, pcg = posterior region of cingulum, plic = posterior limb of internal capsule, slf = superior longitudinal fasciculus, scr = superior region of corona radiata, st = stria terminalis, unc = unicinate fasciculus
Table 2.
Mean (± SD) of the DTI parameters in LD and ALC of the significant (p < 0.05) clusters and tended significant (+) clusters using cluster size test for multiple comparison correction. Cluster size, significance levels (corrected p-value for the cluster) and the location of its peak value in the cluster (MNI coordinates).
| Hemisphere | Measures* | LD(n=10) | ALC(n=11) | Voxels(mm3) | p-value | p-max X (mm) | p-max Y (mm) | p-max Z (mm) |
|---|---|---|---|---|---|---|---|---|
| Right | FA | 0.44 ± 0.13 | 0.38 ± 0.13 | 7650 | 0.02 | 25 | 19 | -23 |
| MD | 0.77± 0.02 | 0.87 ± 0.03 | 8810 | 0.05 | 46 | 35 | -3 | |
| λ∥ | 1.06± 0.02 | 1.12± 0.01 | 4361 | 0.02 | 46 | 35 | -3 | |
| λ┴+ | 0.64± 0.02 | 0.75 ± 0.03 | 5986 | 0.06 | 40 | -51 | -18 | |
| 0.56± 0.02 | 0.66± 0.03 | 5820 | 0.06 | 12 | 38 | -22 | ||
| 0.70± 0.03 | 0.81± 0.04 | 2988 | 0.11 | 27 | -2 | -19 | ||
| Left | FA+ | 0.45 ± 0.13 | 0.40 ± 0.13 | 1472 | 0.21 | -9 | -15 | -21 |
| MD | 0.77 ± 0.01 | 0.82 ± 0.02 | 10312 | 0.04 | -17 | 12 | -2 | |
| λ∥ | 1.17 ± 0.03 | 1.24± 0.03 | 4643 | 0.02 | -25 | -25 | -20 | |
| λ┴+ | 0.59± 0.02 | 0.67± 0.03 | 2993 | 0.11 | -21 | -33 | -18 | |
FA :dimensionless. MD, λ∥, λ┴: × 10 -3 mm2/s
3.1.1. Fractional Anisotropy (FA)
With both methods for multiple comparison correction, ALC had lower FA than LD, and in no region did ALC show significantly higher FA than LD. Fig. 1A is the t- statistics map of FA group comparisons overlaid on the MNI template in midsagittal (top) and coronal (bottom) views at the location of the anterior commissure with distance from the anterior commissure indicated in mm. Fig. 1B shows the significant voxels of FA group differences using FDR (t > 1.94, P < 0.026, df = 18, > 200 voxels) overlaid on the normalized mean FA image in select axial (top) and sagittal (bottom) sections. ALC had significantly lower FA than LD in regions of the following WM fiber tracts: the right anterior branch of the corona radiata (acr) in the inferior frontal lobe, the genu of the corpus callosum (cc) in the deep ventro-medial prefrontal region, the bilateral uncinate fasciculus (unc) and arcuate fasciculus (arcu) in the orbital frontal lobe, the right superior branch of the corona radiata (scr) in the dorso-medial prefrontal lobe, the superior longitudinal fasciculus (slf) in bilateral dorso-lateral prefrontal and parietal lobes, the right extreme capsule (ec) and right inferior fronto-occipital fasciculus (ifo) in the superior and middle temporal lobes, the left inferior longitudinal fasciculus (ilf) in the inferior temporal lobe, the bilateral anterior limbs of the internal capsule (alic) and the left posterior limb of the internal capsule (plic), the body of the fornix (fx), the bilateral inferior cingulum (icg) in the mesial temporal lobe, and the right optic radiation (or), left posterior cingulum (pcg) and left superior fronto-occipital fasciculus (sfo) in the occipital lobe.
Fig. 1.
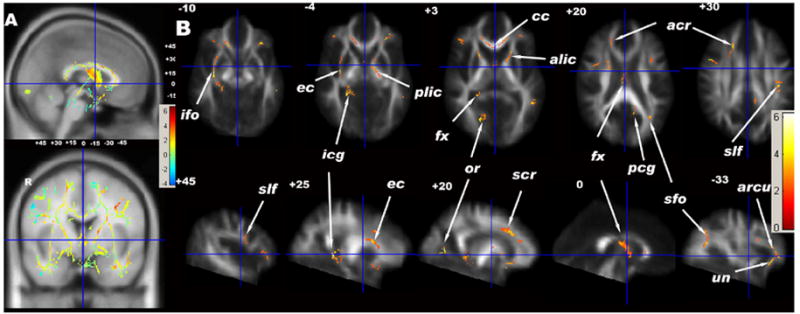
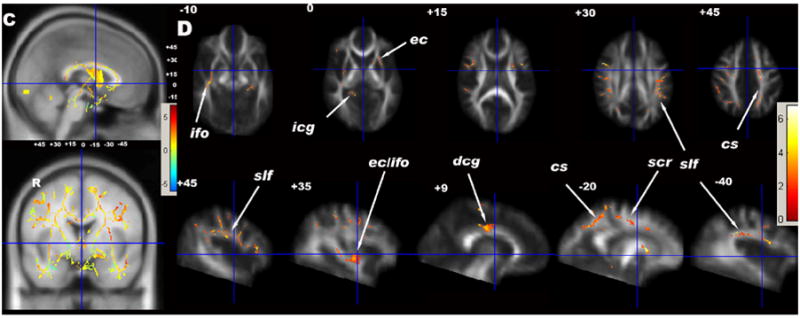
(A) t-statistical maps of FA group differences (LD vs ALC) of TBSS results in sagittal (top) and coronal (bottom) views overlaid on the MNI template (1*1*1 mm3). The small numbers are the distances (in mm) from the anterior commissure (centered at the cross bars), showing the positions of the axial and sagittal images in (B). (B) Significant FA group effects (greater in LD) of white matter voxels corrected using FDR (5%) and voxel size > 200 voxels. (C) t-statistical maps of MD group differences (ALC vs LD) of TBSS results in sagittal (top) and coronal (bottom) views overlaid on the MNI template (1*1*1 mm3). The small numbers are the distances (in mm) from the anterior commissure, showing the positions of the axial and sagittal images in (D). (D) Significant group effects (greater in ALC) of white matter voxels corrected using FDR (5%) and voxel size > 200 voxels. acr = anterior region of corona radiata, alic = anterior limb of internal capsule, arcu = arcuate fasciculus, cc = corpus callosum, cs = centrum semiovale, dcg = dorsal region of cingulum, ec = external/extreme capsule, fx = fornix, gcc = genu of corpus callosum, icg = inferior region of cingulum, ifo = inferior fronto-occipital fasciculus, or = optic radiation, pcg = posterior region of cingulum, plic = posterior limb of internal capsule, slf = superior longitudinal fasciculus, scr = superior region of corona radiata, unc = unicinate fasciculus.
Using the cluster size test for multiple comparisons, one large cluster of 7650 voxels in the right hemisphere had 14% lower FA in ALC than LD (t > 1.5, P = 0.02, df = 18) (see Table 2). The smaller cluster in the left hemisphere had 11% lower FA in ALC vs. LD, but was not statistically significant (t > 1.5, P = 0.21, df = 18). Fig. 2A shows the coronal, sagittal and axial projections of corrected P values of FA group differences using the cluster size test. The significant cluster in the right hemisphere encompassed most of the smaller clusters identified by the FDR method (see above) and included the genu of the corpus callosum (cc), the external capsule (ec), and several fibers in the prefrontal and orbito-frontal lobes. The smaller non-significant FA cluster in the left hemisphere centered on a region containing both limbs of the internal capsule (ic) (t > 1.5, P = 0.21, df = 18).
Fig. 2.
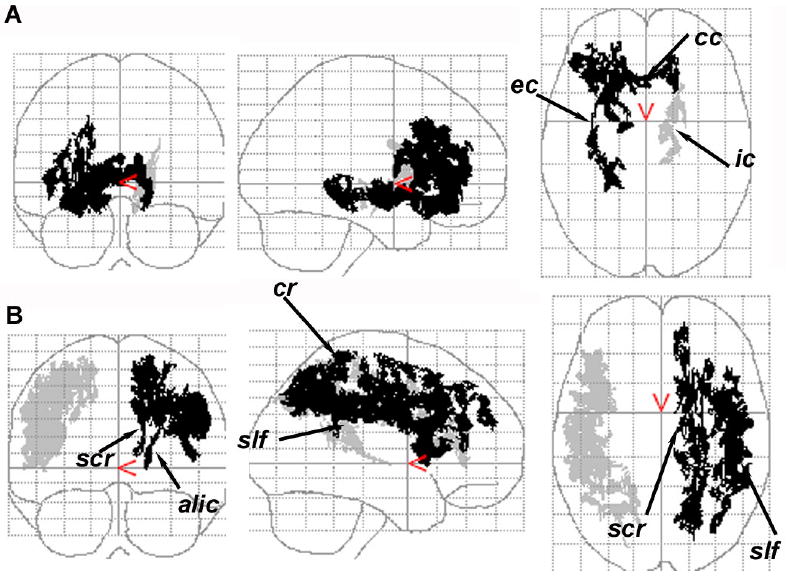
The coronal, sagittal, and axial projections of corrected p values of FA (A) and MD (B) group difference using the suprathreshold cluster size test for correction of multiple comparisons. (A) The significant FA cluster in the right hemisphere (dark, p = 0.02) and a smaller size cluster in the left hemisphere (p = 0.21). (B) Two MD clusters in the right (light, p = 0.05) and left (dark, p = 0.04) hemisphere with a relatively larger size in the left. alic = anterior limb of internal capsule, cs = centrum semiovale, ec = external/extreme capsule, ic = internal capsule, slf = superior longitudinal fasciculus, scr = superior region of corona radiata.
3.1.2. Mean Diffusivity (MD)
Using both methods for multiple comparison corrections, ALC had higher MD than LD. Fig. 1C is the t-statistic map of MD group comparisons and Fig. 1D shows voxels with significant MD differences between ALC and LD using the FDR correction method (t > 2.02, P < 0.022, df = 18, size > 200 voxels). Significant regions included the following WM fiber tracts: bilateral scr and centrum semiovale (cs) in frontal lobe and in the precuneus of parietal lobes, bilateral slf, ec and pcg, right dorsal cingulum (dcg) and part of left alic.
Using cluster size testing, one cluster in each hemisphere had higher MD in ALC than LD (right: +13%, t > 1.5, P = 0.05, df = 18; left: +6.5%, t > 1.5, P = 0.04, df = 18) (see Table 2). Fig. 2B shows the coronal, sagittal and axial projections of corrected P values of MD group differences using the cluster size test. The clusters on both sides encompassed the major fiber tracts identified by the FDR method, except ec. The spatial extent of these significant clusters was greater than those identified by the FDR method, including nearly the entire left scr and bilateral slf fiber tracts.
Fibers that had both high FA and low MD were mainly subcortical fibers of frontal (slf) and temporal lobes (ifo/unc, ec), cortico-striatal fibers (alic) (identified by both FDR and cluster size tests) as well as limbic fibers of the temporal lobe (pcg) (identified by FDR). Results of the cluster size test showed that MD differences were primarily found in association fibers of the subcortical WM, i.e. in scr, cs, and slf, while FA differences were primarily found among all fiber types, i.e. commissural fibers (e.g., cc), projection fibers (e.g., cortico-striatal fibers), and deep association fibers (e.g., ec) (Fig. 2).
3.1.3. Axial Diffusivity (λ∥)
Generally, ALC had greater λ∥ than LD using either method for multiple comparison correction (t > 1.8341, P < 0.033 for FDR, corrected P = 0.02, df = 18 for cluster size test). The regions where ALC had significant greater λ∥ than LD were similar to those where ALC had greater MD using either method for multiple comparison correction. In only one region, the junction of ifo and unc in the right amygdalo-hippocampal complex (AHC) of the temporal lobe, had ALC lower λ∥ than LD (by FDR).
3.1.4. Radial Diffusivity (λ┴)
ALC had greater λ┴ than LD via both multiple comparison correction methods. The regions of greater λ┴ by FDR (t > 1.9308, P < 0.027, df = 18) were similar to those where ALC had lower FA compared to LD, but included also the right cerebellar vermis. Cluster size testing revealed two clusters in the right hemisphere that tended to have higher λ┴ in ALC than LD (t > 1.5, P = 0.06, df = 18) and two other non-significant clusters of each hemisphere (t > 1.5, P = 0.11, df = 18) (see Table 2); these clusters overlapped spatially with regions of lower FA.
3.2. Voxelwise Regression Analyses within ALC
The mean and standard deviation of diffusion parameters calculated within the whole WM skeleton in ALC were as followed; FA = 0.36 ± 0.13 (dimensionless), MD = 0.88 ± 0.06, λ1 = 1.23 ± 0.06, λ2 = 0.80 ± 0.06 and λ3 = 0.59 ± 0.06 × 10 -3 mm2/s. We correlated voxelwise diffusion measures of the WM skeleton with measures of drinking severity and cognition. After corrections for multiple comparisons using the cluster size test, better visuospatial memory in ALC was associated with higher FA in regions of mainly commissural fibers (genu, body, splenium, major forceps and tapetum of cc), ec, acr, scr, slf (t > 1.5, P = 0.01, df = 18); and sagittal stratum (include ilf and ifo) and pcr (t > 1.5, P = 0.02, df = 18). A higher number of average drinks per month during the year prior to study was significantly related to higher λ∥ (t > 1.5, P = 0.05, df = 18), primarily in the regions of the bilateral cc, fx, plic, acr, scr, cs and slf. Additionally, higher average drinks per month over lifetime were significantly associated with higher λ3 in the regions of the right alic, ec and or in the sagittal stratum (t > 1.5, P = 0.05, df = 18).
3.3. Probabilistic Tractography
Figures 3A and B shows probabilistic fiber tracts of the “target” participant using as seed (starting) voxels those with lower FA in ALC than LD (by cluster size testing). The observed tracts connect critical nodes of reward system neurocircuitry and include the fiber bundles of the extreme capsule (ec) and ifo connecting to the inferior frontal region, the right medial forebrain bundle that projects from the midbrain to the nucleus accumbens (NAcc), the connection between substantia nigra and the culmen of the cerebellar vermis, as well as connections between hippocampal/parahippocampal gyrus, the midbrain and cerebellar vermis (Fig. 3A), fibers between the ventral pallidum and NAcc, connections between the midbrain, the dorsal pallidum and the dorsal thalamus (Fig. 3B). Cortico-striatal fiber bundles including the anterior limb of the right internal capsule, the anterior and superior regions of the corona radiata connecting to the prefrontal cortex as well as the mammillo-thalamic tract could also be tracked but are not shown in the figure.
Fig. 3.
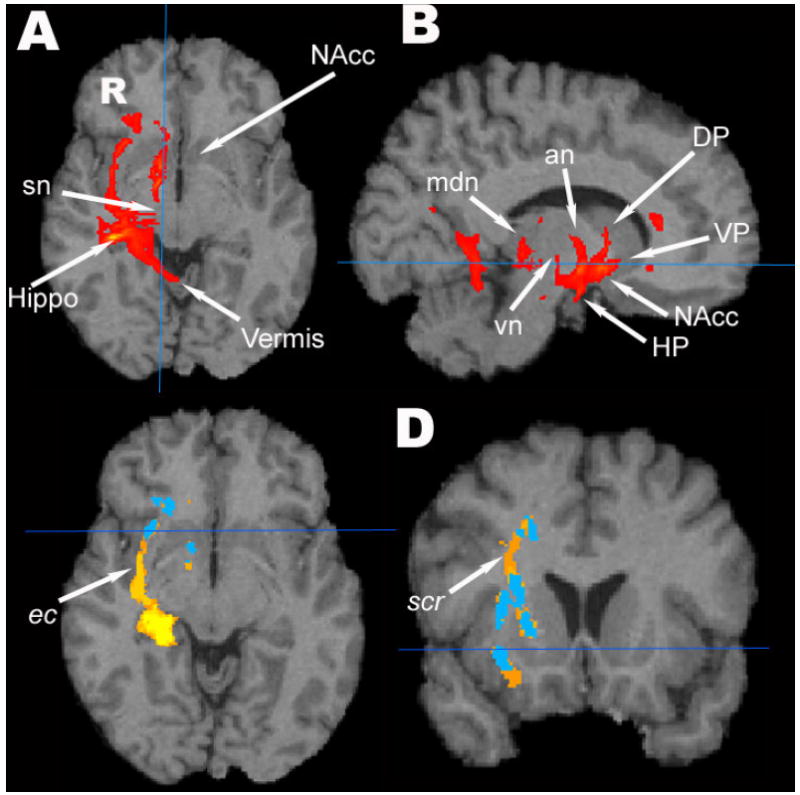
(A and B) The fiber pathways for one participant, the “target” of our TBSS calculations, using the FA group difference voxels as seed mask in probabilistic tractography. The tractogram is overlaid on the target participant’s T1w image. an = anterior thalamic nuclear group, DP = dorsal pallidum, HP= hypothalamus, Hippo = hippocampus, mdn = medio-dorsal thalamic nucleus, sn = substantia nigra, vn = ventral thalamic nuclear group, NAcc = nucleus accumbens, VP= ventral pallidum. (C and D) The group population pathways of ALC (blue) overlaid on population pathways of LD (yellow-orange) then overlaid on the target participant’s T1w image. The pathways of the extreme capsule (ec) and the superior region of corona radiata (scr) are seen in the LD group, but not in the ALC group.
Fig. 3C and D shows the group population probability maps (orange/yellow for LD, blue for ALC) constructed from the pathways identified in individual participants when using the group FA difference (cluster size test) as the seed masks for probabilistic tractography. The LD group had larger regions of common pathway locations than the ALC group, in particular a higher probability of WM tracts in the right ec and scr and adjacent to the right AHC.
4. DISCUSSION
This TBSS analysis of DTI data from alcohol dependent individuals reveals widespread injury to WM regions including major fiber tracts in the frontal lobe, mesial temporal lobe, and cortico-striatal regions. FA decreases in deep WM regions are generally due to increased λ┴, whereas MD increases in more subcortical WM regions are generally associated with higher λ∥. In ALC, reduced FA in regions of major commissural fibers and association fibers of the corona radiata and superior longitudinal fasciculus are associated with greater visuospatial memory deficits, while regional diffusion measures correlate with alcohol consumption. These findings suggest widespread and dose-dependent, functionally significant de- and/or dysmyelination as a major feature of alcohol dependence. This occurs in the presence or absence of regional axonal morphological abnormalities, sometimes in the same WM tract. In addition, probabilistic tractography that used TBSS-derived FA deficits in ALC vs. LD as seed points reveals major subsections of the neurocircuitry adversely affected in ALC that have been shown involved in impulse control, emotional regulation, reward, executive functions, and learning and memory (Mega and Cummings, 1994; Volkow et al., 2002; Chambers et al., 2003; Kalivas and Volkow, 2005; Sullivan and Pfefferbaum, 2005; Baler and Volkow, 2006). These in-vivo findings are largely consistent with histological studies and, taken together, they demonstrate ways of assessing functional consequences of chronic drinking on functionally significant neurocircuitry.
4.1. Interpretation of DTI changes in alcohol-related brain injury
Decreased FA can be due to a reduction in λ∥ and/or an increase in λ┴, while increased MD can be the result of increased λ∥ and/or λ┴. In our ALC, FA decreases were prominent in deep frontal and temporal WM, and in regions of limbic fibers. These regions also showed increased λ┴ with little change in λ∥, commonly interpreted to reflect demyelination (Song et al., 2003; Harsan et al., 2006). To the contrary, regions of increased MD in ALC, prominent in subcortical frontal WM, overlapped spatially with those of higher λ∥. Regions that showed both low FA and high MD are severely affected by alcoholism and are characterized by demyelination with (Cader et al., 2007) or without axonal injury (Song et al., 2003) and increased interstitial fluid (Pierpaoli et al., 2001; Pfefferbaum and Sullivan, 2005). Increased λ∥ in subcortical WM regions where degenerated frontal pathways intersect, such as the junction of slf and scr, are most likely due to more coherently oriented fibers (Pierpaoli et al., 2001). Alternatively, high λ∥ in non-crossing fiber tracts may be due to compensatory repair processes, possibly through increased intraaxonal microtubule-associated protein that facilitates both debris removal (McLane et al., 1992) and remyelination (Morell et al., 1998).
Interestingly, different microstructural changes can occur in adjacent sections of the same degenerated fiber tract: higher λ∥ was found in regions of several intersecting subcortical fibers (such as slf and scr), immediately adjacent to voxels of the same fiber tract with increased λ┴ reflecting de- and/or dysmyelination) (Song et al., 2003; Harsan et al., 2006). Using FDR, we only found one cluster at the junction of ec/ifo and unc adjacent to the right AHC that had significantly lower λ∥ in ALC vs. LD (max. t = 4.42). This cluster in the superior/middle temporal region (Table 1) also had markedly increased λ┴ (max. t = 5.12) and increased MD (max. t = 4.59), which suggests significant loss of both myelin and axons (Ito et al., 2002; Lazar et al., 2003) as well as increased interstitial fluid (Pierpaoli et al., 2001). In summary, brain injury in alcohol dependence is widespread and de-/dysmyelination is the main microstructural change in frontal, temporal, and cortico-striatal WM tracts. These findings are consistent with the documented WM volume loss in alcohol dependence and can explain reversibility of WM loss via remyelination during abstinence from alcohol.
4.2. Brain functions and neurocircuitry affected in alcoholism
Alcohol dependent samples commonly show deficiencies in a wide range of neurocognitive and motor functions (Oscar-Berman, 2000; Sullivan, 2000; Durazzo and Meyerhoff, 2007), some of which may be related to the observed fiber tract abnormalities. The association between lower visuospatial memory in the first week of abstinence and lower FA in the callosal splenium have been reported (Pfefferbaum et al., 2006a), and imply that impaired inter-hemispheric connections reduce visuospatial memory function in ALC. Furthermore, larger MD in the cs in the region of the left precuneus (Fig. 2) may be linked to deficits of higher-order cognitive functioning in alcoholism, because the precuneus is thought to be associated with self-centered mental strategies and episodic memory retrieval (Cavanna and Trimble, 2006). In addition, deficits in executive and motor functioning in ALC vs. LD may be related to the observed microstructural abnormalities in the internal capsule (including the corticospinal tract) (Fig. 1B), the superior cerebellar vermis, the dorso-medial prefrontal regions, supplementary motor area, and precentral lobe. The tractography results together with the TBSS analyses show most prominent WM injury in the AHC region (ifo, pcg), the insular region (ec), and in areas around cortico-striatal and subcortical pathways (alic, slf, cr). This pattern of injury may be associated with dysfunction in learning and memory (limbic systems, including the AHC, cingulum and fornix), reward anticipation (NAcc, VP), as well as frontally modulated impulse control, motivational states, salience evaluation, and cue-controlled cravings (Baler and Volkow, 2006). In summary, our demonstrations of localized WM fiber tract abnormalities in alcoholism are consistent with the concept of disrupted neurocircuitry involved in impulse control and emotional regulation that is either a consequence of chronic excessive drinking or ultimately results in compulsive drug seeking (Robinson and Berridge, 1993; Brady et al., 1998; Jentsch and Taylor, 1999; Lubman et al., 2004; Baler and Volkow, 2006; Yucel and Lubman, 2007).
4.3. Associations between drinking severity and DTI parameters
Daily maximal alcohol consumption has been reported to correlate negatively with WM volume in alcoholics (Kril et al., 1997), and greater drinking severity has been associated with faster volume recovery during abstinence of middle-aged alcoholics (Gazdzinski et al., 2005). Our result of a positive association of average monthly drinks in the last year before abstinence with λ∥ in the genu and splenium of the cc ((but not FA, MD, or λ┴) and in the internal capsule reflects recent alcohol effects. Because of the absence of change of intravoxel fiber orientation (FA) and radial diffusivity λ┴, this may suggest a reversible axonal change such as disintegration of the cytoskeleton (Putzke et al., 1998) or decreased axonal size, but not lower axonal density (Kjellstrom and Conradi, 1993). On the contrary, a positive association of average monthly drinks over life time with λ┴ in the regions of alic, ec and sagittal striatum, where ALC also had lower FA than LD, suggests that demyelination is the consequence of long-term heavy alcohol consumption.
4.4. Right hemisphere hypothesis and methodological considerations
The right hemisphere hypothesis postulates that functions controlled by the right hemisphere are more vulnerable to the long term effects of chronic alcohol consumption than those controlled by the left hemisphere (Ellis and Oscar-Berman, 1989; Demaree et al., 2005). Our cluster size analyses showed MD increases of similar statistical significances, spatial extent, and effect sizes in right and left hemispheres, but the MD increase in the right hemisphere (+13%) was twice the increase in the left hemisphere. The corresponding FA analyses showed somewhat larger reductions in the right (14%) vs. left hemisphere (11%), which were more widespread and statistically significant only in the right hemisphere. This was attributed to lower right λ∥ with only mild differences in λ┴. The lower statistical significance of FA on the left side was not due to noisier data or greater variability in the data as the standard errors for both clusters were comparable. Thus, although right-sided deficits of DTI metrics in ALC were more widespread and of somewhat greater magnitude than the left-sided deficits, the hemisphere effects for regional MD and FA measures were not statistically significant. Furthermore, the analyses using FDR for multiple comparison corrections yielded more symmetrically appearing bilateral DTI abnormalities. Therefore, there is little support for the right hemisphere hypothesis in the alcoholics of this small DTI data set.
The somewhat dissimilar hemispheric findings obtained by the two correction methods are likely related to methodological specifics. Since the suprathreshold cluster size test uses a family-wise error, the probability of even one false rejection, the resulting corrected local significance values can be regarded as fairly conservative estimates. In contrast, the FDR method allows an expected proportion, 5%, of the corrected significance values to be falsely positive, thus resulting in inflated false positive rates and a less conservative estimate of the false-negatives.
4.5. Limitations
Although the parameters derived from DTI can detect microstructural changes in the WM of alcohol-dependent individuals, they do not inform about the causes of this injury. As about 90% of our alcoholic participants in this cohort were chronic cigarette smokers vs. only 20% of our controls, and because chronic smoking in alcoholics has been associated with significant neurobiological injury (as reviewed in (Durazzo and Meyerhoff, 2007)), the observed group differences are likely due to a combination of both chronic smoking and alcohol consumption. However, in our regression analyses, none of our measures of smoking severity correlated significantly with FA and other diffusivity measures, suggesting little effect of smoking on outcome measures. Our selection of mostly smoking alcoholics and mostly non-smoking controls was driven by our desire to maximize potential group differences so that the potential influence of smoking status on DTI metrics in ALC was not examined. Rather than being a consequence of heavy drinking and smoking, our findings instead may be premorbid in nature. Another study limitation is the rather small cohort, which was chosen to keep computational time reasonable and to demonstrate the relative high power of the TBSS approach for detecting meaningful group differences. Our diffusion data was of suboptimal quality. First, the DTI data acquisition did not cover pons, medulla and large sections of the cerebellum. In addition, the low signal-to-noise ratio due to one acquisition (NEX) may introduce bias into FA and λ1 calculations and the low numbers of gradient directions may make DTI contrasts dependent on fiber orientation (Jones et al., 1999).
However, it has been shown that as long as sampling orientations are well balanced on an isotropic shell, the precision of DTI measures for a clinical scanner is comparable to the experimental error (Landman et al., 2007). Finally, although our probabilistic tractography results visualize major fiber tracts affected in AUD, we are well aware that probabilistic tractography is better performed with more than six diffusion directions (Jones, 2004). However, the aim of our tractography analysis was simply to compare the groups qualitatively on all the possible tracts passing through all voxels with FA group differences, but not to perform quantitative “connectivity-based seed-voxel classification” (Behrens et al., 2003a), where the target masks are pre-specified anatomical regions. Thus, the tractography results in this small sample, as reasonable as they may appear, clearly need further validation and are intended more as a demonstration of the tracking approach than a thorough analysis of affected pathways in alcoholism.
4.6. Conclusions
This study demonstrates the use of TBSS for detecting widespread WM microstructural changes in AUD. Specifically, voxel-wise TBSS detects significant microstructural abnormalities in major regions of the motivational neurocircuitry of alcohol dependent individuals. The specific WM abnormalities observed in these one-week-abstinent individuals are largely consistent with the literature on alcohol-related neurobiological and neurocognitive abnormalities, with neuropathologic findings, and specifically with chronic alcohol-related injury to neurocircuitry that subserves cognitive control, motivational drives, salience, memory and learning, as well as impulse control. The cross-sectional findings in this rather small cohort clearly call for replication in a larger sample, for evaluation of potential smoking effects among alcoholics, and for extension to a longitudinal follow-up to assess potential recovery from microstructural injury during abstinence from abused substances.
Acknowledgments
NIH AA10788 (DJM) and the Veteran’s Administration research service supported this project. We thank Mary Rebecca Young and Bill Clift of the San Francisco VA Substance Abuse Day Hospital, and Dr. David Pating, Karen Moise, and their colleagues at the San Francisco Kaiser Permanente Chemical Dependency Recovery Program for their valuable assistance in recruiting research participants. We also thank Dr. Hemanth Thayyullathil for assistance with data analyses, as well as Drs. Michael W. Weiner, Norbert Schuff, Wang Zhan, and Yu Zhang for valuable discussions. Last not least, we thank our study volunteers, who made this research possible.
Footnotes
Publisher's Disclaimer: This is a PDF file of an unedited manuscript that has been accepted for publication. As a service to our customers we are providing this early version of the manuscript. The manuscript will undergo copyediting, typesetting, and review of the resulting proof before it is published in its final citable form. Please note that during the production process errors may be discovered which could affect the content, and all legal disclaimers that apply to the journal pertain.
References
- Baler RD, Volkow ND. Drug addiction: the neurobiology of disrupted self-control. Trends in Molecular Medicine. 2006;12:559–566. doi: 10.1016/j.molmed.2006.10.005. [DOI] [PubMed] [Google Scholar]
- Beaulieu C. The basis of anisotropic water diffusion in the nervous system - a technical review. NMR in Biomedicine. 2002;15:435–455. doi: 10.1002/nbm.782. [DOI] [PubMed] [Google Scholar]
- Behrens TE, Johansen-Berg H, Woolrich MW, Smith SM, Wheeler-Kingshott CA, Boulby PA, Barker GJ, Sillery EL, Sheehan K, Ciccarelli O, Thompson AJ, Brady JM, Matthews PM. Non-invasive mapping of connections between human thalamus and cortex using diffusion imaging. Nat Neurosci. 2003a;6:750–757. doi: 10.1038/nn1075. [DOI] [PubMed] [Google Scholar]
- Behrens TE, Woolrich MW, Jenkinson M, Johansen-Berg H, Nunes RG, Clare S, Matthews PM, Brady JM, Smith SM. Characterization and propagation of uncertainty in diffusion-weighted MR imaging. Magnetic Resonance in Medicine. 2003b;50:1077–1088. doi: 10.1002/mrm.10609. [DOI] [PubMed] [Google Scholar]
- Benedict RH. Effects of using same- versus alternate-form memory tests during short-interval repeated assessments in multiple sclerosis. J Int Neuropsychol Soc. 2005;11:727–736. doi: 10.1017/S1355617705050782. [DOI] [PubMed] [Google Scholar]
- Benjamini Y, Hochberg Y. Controlling the False Discovery Rate: A Practical and Powerful Approach to Multiple Testing. Journal of the Royal Statistical Society: Series B. 1995;57:289–300. [Google Scholar]
- Bowirrat A, Oscar-Berman M. Relationship between dopaminergic neurotransmission, alcoholism, and Reward Deficiency syndrome. American Journal of Medical Genetics Part B, Neuropsychiatric Genetics. 2005;132:29–37. doi: 10.1002/ajmg.b.30080. [DOI] [PubMed] [Google Scholar]
- Brady KT, Myrick H, McElroy S. The relationship between substance use disorders, impulse control disorders, and pathological aggression. The American Journal on Addictions. 1998;7:221–230. [PubMed] [Google Scholar]
- Cader S, Johansen-Berg H, Wylezinska M, Palace J, Behrens TE, Smith S, Matthews PM. Discordant white matter N-acetylasparate and diffusion MRI measures suggest that chronic metabolic dysfunction contributes to axonal pathology in multiple sclerosis. Neuroimage. 2007;36:19–27. doi: 10.1016/j.neuroimage.2007.02.036. [DOI] [PubMed] [Google Scholar]
- Carlen PL, Wilkinson DA, Wortzman G, Holgate R. Partially reversible cerebral atrophy and functional improvement in recently abstinent alcoholics. The Canadian Journal of Neurological Sciences. 1984;11:441–446. doi: 10.1017/s0317167100045972. [DOI] [PubMed] [Google Scholar]
- Cavanna AE, Trimble MR. The precuneus: a review of its functional anatomy and behavioural correlates. Brain. 2006;129:564–583. doi: 10.1093/brain/awl004. [DOI] [PubMed] [Google Scholar]
- Chambers RA, Taylor JR, Potenza MN. Developmental neurocircuitry of motivation in adolescence: a critical period of addiction vulnerability. The American Journal of Psychiatry. 2003;160:1041–1052. doi: 10.1176/appi.ajp.160.6.1041. [DOI] [PMC free article] [PubMed] [Google Scholar]
- Ciccarelli O, Behrens TE, Altmann DR, Orrell RW, Howard RS, Johansen-Berg H, Miller DH, Matthews PM, Thompson AJ. Probabilistic diffusion tractography: a potential tool to assess the rate of disease progression in amyotrophic lateral sclerosis. Brain. 2006;129:1859–1871. doi: 10.1093/brain/awl100. [DOI] [PubMed] [Google Scholar]
- Demaree HA, Everhart DE, Youngstrom EA, Harrison DW. Brain lateralization of emotional processing: historical roots and a future incorporating “dominance”. Behavioral and Cognitive Neuroscience Reviews. 2005;4:3–20. doi: 10.1177/1534582305276837. [DOI] [PubMed] [Google Scholar]
- Durazzo TC, Gazdzinski S, Banys P, Meyerhoff DJ. Cigarette smoking exacerbates chronic alcohol-induced brain damage: a preliminary metabolite imaging study. Alcoholism, Clinical and Experimental Research. 2004;28:1849–1860. doi: 10.1097/01.alc.0000148112.92525.ac. [DOI] [PubMed] [Google Scholar]
- Durazzo TC, Meyerhoff DJ. Neurobiological and neurocognitive effects of chronic cigarette smoking and alcoholism. Frontiers in Bioscience. 2007;12:4079–4100. doi: 10.2741/2373. [DOI] [PubMed] [Google Scholar]
- Ellis RJ, Oscar-Berman M. Alcoholism, aging, and functional cerebral asymmetries. Psychological Bulletin. 1989;106:128–147. doi: 10.1037/0033-2909.106.1.128. [DOI] [PubMed] [Google Scholar]
- Fagerstrom KO. Towards better diagnoses and more individual treatment of tobacco dependence. Br J Addict. 1991;86:543–547. doi: 10.1111/j.1360-0443.1991.tb01805.x. [DOI] [PubMed] [Google Scholar]
- Gass A, Niendorf T, Hirsch JG. Acute and chronic changes of the apparent diffusion coefficient in neurological disorders--biophysical mechanisms and possible underlying histopathology. Journal of the Neurological Sciences. 2001;186(Suppl 1):S15–23. doi: 10.1016/s0022-510x(01)00487-7. [DOI] [PubMed] [Google Scholar]
- Gazdzinski S, Durazzo TC, Studholme C, Song E, Banys P, Meyerhoff DJ. Quantitative brain MRI in alcohol dependence: preliminary evidence for effects of concurrent chronic cigarette smoking on regional brain volumes. Alcoholism, Clinical and Experimental Research. 2005;29:1484–1495. doi: 10.1097/01.alc.0000175018.72488.61. [DOI] [PubMed] [Google Scholar]
- Gulani V, Webb AG, Duncan ID, Lauterbur PC. Apparent diffusion tensor measurements in myelin-deficient rat spinal cords. Magnetic Resonance in Medicine. 2001;45:191–195. doi: 10.1002/1522-2594(200102)45:2<191::aid-mrm1025>3.0.co;2-9. [DOI] [PubMed] [Google Scholar]
- Harsan LA, Poulet P, Guignard B, Steibel J, Parizel N, de Sousa PL, Boehm N, Grucker D, Ghandour MS. Brain dysmyelination and recovery assessment by noninvasive in vivo diffusion tensor magnetic resonance imaging. Journal of Neuroscience Research. 2006;83:392–402. doi: 10.1002/jnr.20742. [DOI] [PubMed] [Google Scholar]
- Hasin DS, Stinson FS, Ogburn E, Grant BF. Prevalence, correlates, disability, and comorbidity of DSM-IV alcohol abuse and dependence in the United States: results from the National Epidemiologic Survey on Alcohol and Related Conditions. Arch Gen Psychiatry. 2007;64:830–842. doi: 10.1001/archpsyc.64.7.830. [DOI] [PubMed] [Google Scholar]
- Ito R, Mori S, Melhem ER. Diffusion tensor brain imaging and tractography. Neuroimaging Clinics of North America. 2002;12:1–19. doi: 10.1016/s1052-5149(03)00067-4. [DOI] [PubMed] [Google Scholar]
- Jenkinson M, Bannister P, Brady M, Smith S. Improved optimization for the robust and accurate linear registration and motion correction of brain images. Neuroimage. 2002;17:825–841. doi: 10.1016/s1053-8119(02)91132-8. [DOI] [PubMed] [Google Scholar]
- Jentsch JD, Taylor JR. Impulsivity resulting from frontostriatal dysfunction in drug abuse: implications for the control of behavior by reward-related stimuli. Psychopharmacology (Berl) 1999;146:373–390. doi: 10.1007/pl00005483. [DOI] [PubMed] [Google Scholar]
- Jones DK. The effect of gradient sampling schemes on measures derived from diffusion tensor MRI: a Monte Carlo study. Magn Reson Med. 2004;51:807–815. doi: 10.1002/mrm.20033. [DOI] [PubMed] [Google Scholar]
- Jones DK, Horsfield MA, Simmons A. Optimal strategies for measuring diffusion in anisotropic systems by magnetic resonance imaging. Magn Reson Med. 1999;42:515–525. [PubMed] [Google Scholar]
- Kalivas PW, Volkow ND. The neural basis of addiction: a pathology of motivation and choice. The American Journal of Psychiatry. 2005;162:1403–1413. doi: 10.1176/appi.ajp.162.8.1403. [DOI] [PubMed] [Google Scholar]
- Kjellstrom C, Conradi NG. Decreased axonal calibres without axonal loss in optic nerve following chronic alcohol feeding in adult rats: a morphometric study. Acta Neuropathologica (Berl) 1993;85:117–121. doi: 10.1007/BF00227757. [DOI] [PubMed] [Google Scholar]
- Klingberg T, Vaidya CJ, Gabrieli JD, Moseley ME, Hedehus M. Myelination and organization of the frontal white matter in children: a diffusion tensor MRI study. Neuroreport. 1999;10:2817–2821. doi: 10.1097/00001756-199909090-00022. [DOI] [PubMed] [Google Scholar]
- Kril JJ, Halliday GM, Svoboda MD, Cartwright H. The cerebral cortex is damaged in chronic alcoholics. Neuroscience. 1997;79:983–998. doi: 10.1016/s0306-4522(97)00083-3. [DOI] [PubMed] [Google Scholar]
- Landman BA, Farrell JA, Jones CK, Smith SA, Prince JL, Mori S. Effects of diffusion weighting schemes on the reproducibility of DTI-derived fractional anisotropy, mean diffusivity, and principal eigenvector measurements at 1.5T. Neuroimage. 2007;36:1123–1138. doi: 10.1016/j.neuroimage.2007.02.056. [DOI] [PubMed] [Google Scholar]
- Lazar M, Weinstein DM, Tsuruda JS, Hasan KM, Arfanakis K, Meyerand ME, Badie B, Rowley HA, Haughton V, Field A, Alexander AL. White matter tractography using diffusion tensor deflection. Human Brain Mapping. 2003;18:306–321. doi: 10.1002/hbm.10102. [DOI] [PMC free article] [PubMed] [Google Scholar]
- Lubman DI, Yucel M, Pantelis C. Addiction, a condition of compulsive behaviour? Neuroimaging and neuropsychological evidence of inhibitory dysregulation. Addiction. 2004;99:1491–1502. doi: 10.1111/j.1360-0443.2004.00808.x. [DOI] [PubMed] [Google Scholar]
- McLane JA, Atkinson MB, McNulty J, Breuer AC. Direct measurement of fast axonal organelle transport in chronic ethanol-fed rats. Alcoholism, Clinical and Experimental Research. 1992;16:30–37. doi: 10.1111/j.1530-0277.1992.tb00631.x. [DOI] [PubMed] [Google Scholar]
- Mega MS, Cummings JL. Frontal-subcortical circuits and neuropsychiatric disorders. The Journal of Neuropsychiatry and Clinical Neurosciences. 1994;6:358–370. doi: 10.1176/jnp.6.4.358. [DOI] [PubMed] [Google Scholar]
- Morell P, Barrett CV, Mason JL, Toews AD, Hostettler JD, Knapp GW, Matsushima GK. Gene expression in brain during cuprizone-induced demyelination and remyelination. Molecular and Cellular Neurosciences. 1998;12:220–227. doi: 10.1006/mcne.1998.0715. [DOI] [PubMed] [Google Scholar]
- Neil JJ, Shiran SI, McKinstry RC, Schefft GL, Snyder AZ, Almli CR, Akbudak E, Aronovitz JA, Miller JP, Lee BC, Conturo TE. Normal brain in human newborns: apparent diffusion coefficient and diffusion anisotropy measured by using diffusion tensor MR imaging. Radiology. 1998;209:57–66. doi: 10.1148/radiology.209.1.9769812. [DOI] [PubMed] [Google Scholar]
- Nichols TE, Holmes AP. Nonparametric permutation tests for functional neuroimaging: a primer with examples. Human Brain Mapping. 2002;15:1–25. doi: 10.1002/hbm.1058. [DOI] [PMC free article] [PubMed] [Google Scholar]
- Oscar-Berman M. Neuropsychological vulnerabilities in chronic alcoholism. In: Noronha A, Eckardt M, Warren K, editors. Review of NIAAA’s Neuroscience and Behavioral Research Portfolio. NIAAA; Bethesda: 2000. pp. 437–472. [Google Scholar]
- Pfefferbaum A, Adalsteinsson E, Sullivan EV. Dysmorphology and microstructural degradation of the corpus callosum: Interaction of age and alcoholism. Neurobiology of Aging. 2006a;27:994–1009. doi: 10.1016/j.neurobiolaging.2005.05.007. [DOI] [PubMed] [Google Scholar]
- Pfefferbaum A, Adalsteinsson E, Sullivan EV. Supratentorial profile of white matter microstructural integrity in recovering alcoholic men and women. Biological Psychiatry. 2006b;59:364–372. doi: 10.1016/j.biopsych.2005.06.025. [DOI] [PubMed] [Google Scholar]
- Pfefferbaum A, Rosenbloom MJ, Adalsteinsson E, Sullivan EV. Diffusion tensor imaging with quantitative fibre tracking in HIV infection and alcoholism comorbidity: synergistic white matter damage. Brain. 2007;130:48–64. doi: 10.1093/brain/awl242. [DOI] [PubMed] [Google Scholar]
- Pfefferbaum A, Sullivan EV. Microstructural but not macrostructural disruption of white matter in women with chronic alcoholism. Neuroimage. 2002;15:708–718. doi: 10.1006/nimg.2001.1018. [DOI] [PubMed] [Google Scholar]
- Pfefferbaum A, Sullivan EV. Disruption of brain white matter microstructure by excessive intracellular and extracellular fluid in alcoholism: evidence from diffusion tensor imaging. Neuropsychopharmacology. 2005;30:423–432. doi: 10.1038/sj.npp.1300623. [DOI] [PubMed] [Google Scholar]
- Pfefferbaum A, Sullivan EV, Hedehus M, Adalsteinsson E, Lim KO, Moseley M. In vivo detection and functional correlates of white matter microstructural disruption in chronic alcoholism. Alcoholism, Clinical and Experimental Research. 2000;24:1214–1221. [PubMed] [Google Scholar]
- Pfefferbaum A, Sullivan EV, Mathalon DH, Shear PK, Rosenbloom MJ, Lim KO. Longitudinal changes in magnetic resonance imaging brain volumes in abstinent and relapsed alcoholics. Alcoholism, Clinical and Experimental Research. 1995;19:1177–1191. doi: 10.1111/j.1530-0277.1995.tb01598.x. [DOI] [PubMed] [Google Scholar]
- Pierpaoli C, Barnett A, Pajevic S, Chen R, Penix LR, Virta A, Basser P. Water diffusion changes in Wallerian degeneration and their dependence on white matter architecture. Neuroimage. 2001;13:1174–1185. doi: 10.1006/nimg.2001.0765. [DOI] [PubMed] [Google Scholar]
- Pierpaoli C, Basser PJ. Toward a quantitative assessment of diffusion anisotropy. Magnetic Resonance in Medicine. 1996;36:893–906. doi: 10.1002/mrm.1910360612. [DOI] [PubMed] [Google Scholar]
- Putzke J, De Beun R, Schreiber R, De Vry J, Tolle TR, Zieglgansberger W, Spanagel R. Long-term alcohol self-administration and alcohol withdrawal differentially modulate microtubule-associated protein 2 (MAP2) gene expression in the rat brain. Brain Research. Molecular Brain Research. 1998;62:196–205. doi: 10.1016/s0169-328x(98)00253-8. [DOI] [PubMed] [Google Scholar]
- Reese TG, Heid O, Weisskoff RM, Wedeen VJ. Reduction of eddy-current-induced distortion in diffusion MRI using a twice-refocused spin echo. Magnetic Resonance in Medicine. 2003;49:177–182. doi: 10.1002/mrm.10308. [DOI] [PubMed] [Google Scholar]
- Robinson TE, Berridge KC. The neural basis of drug craving: an incentive-sensitization theory of addiction. Brain Research. Brain Research Reviews. 1993;18:247–291. doi: 10.1016/0165-0173(93)90013-p. [DOI] [PubMed] [Google Scholar]
- Rueckert D, Sonoda LI, Hayes C, Hill DL, Leach MO, Hawkes DJ. Nonrigid registration using free-form deformations: application to breast MR images. IEEE Transactions on Medical Imaging. 1999;18:712–721. doi: 10.1109/42.796284. [DOI] [PubMed] [Google Scholar]
- Skinner HA, Sheu WJ. Reliability of alcohol use indices. The Lifetime Drinking History and the MAST. Journal of Studies on Alcohol. 1982;43:1157–1170. doi: 10.15288/jsa.1982.43.1157. [DOI] [PubMed] [Google Scholar]
- Smith SM, Jenkinson M, Johansen-Berg H, Rueckert D, Nichols TE, Mackay CE, Watkins KE, Ciccarelli O, Cader MZ, Matthews PM, Behrens TE. Tract-based spatial statistics: voxelwise analysis of multi-subject diffusion data. Neuroimage. 2006;31:1487–1505. doi: 10.1016/j.neuroimage.2006.02.024. [DOI] [PubMed] [Google Scholar]
- Smith SM, Jenkinson M, Woolrich MW, Beckmann CF, Behrens TE, Johansen-Berg H, Bannister PR, De Luca M, Drobnjak I, Flitney DE, Niazy RK, Saunders J, Vickers J, Zhang Y, De Stefano N, Brady JM, Matthews PM. Advances in functional and structural MR image analysis and implementation as FSL. Neuroimage. 2004;23(Suppl 1):S208–219. doi: 10.1016/j.neuroimage.2004.07.051. [DOI] [PubMed] [Google Scholar]
- Sobell LC, Sobell MB. Timeline Follow-Back: a technique for assessing self-reported alcohol consumption. In: Litten R, Allen J, editors. Measuring Alcohol Consumption. The Humana Press Inc; 1992. pp. 41–72. [Google Scholar]
- Song SK, Sun SW, Ju WK, Lin SJ, Cross AH, Neufeld AH. Diffusion tensor imaging detects and differentiates axon and myelin degeneration in mouse optic nerve after retinal ischemia. Neuroimage. 2003;20:1714–1722. doi: 10.1016/j.neuroimage.2003.07.005. [DOI] [PubMed] [Google Scholar]
- Song SK, Sun SW, Ramsbottom MJ, Chang C, Russell J, Cross AH. Dysmyelination revealed through MRI as increased radial (but unchanged axial) diffusion of water. Neuroimage. 2002;17:1429–1436. doi: 10.1006/nimg.2002.1267. [DOI] [PubMed] [Google Scholar]
- Sotak CH. Nuclear magnetic resonance (NMR) measurement of the apparent diffusion coefficient (ADC) of tissue water and its relationship to cell volume changes in pathological states. Neurochemistry International. 2004;45:569–582. doi: 10.1016/j.neuint.2003.11.010. [DOI] [PubMed] [Google Scholar]
- Stinson FS, Grant BF, Dawson DA, Ruan WJ, Huang B, Saha T. Comorbidity between DSM-IV alcohol and specific drug use disorders in the United States: results from the National Epidemiologic Survey on Alcohol and Related Conditions. Drug Alcohol Depend. 2005;80:105–116. doi: 10.1016/j.drugalcdep.2005.03.009. [DOI] [PubMed] [Google Scholar]
- Sullivan EV. Human brain vulnerability to alcoholism: evidence from neuroimaging studies. In: Noronha A, Eckardt M, Warren K, editors. Review of NIAAA’s Neuroscience and Behavioral Research Portfolio. NIAAA; Bethesda: 2000. pp. 473–508. [Google Scholar]
- Sullivan EV. Compromised pontocerebellar and cerebellothalamocortical systems: speculations on their contributions to cognitive and motor impairment in nonamnesic alcoholism. Alcoholism, Clinical and Experimental Research. 2003;27:1409–1419. doi: 10.1097/01.ALC.0000085586.91726.46. [DOI] [PubMed] [Google Scholar]
- Sullivan EV, Harding AJ, Pentney R, Dlugos C, Martin PR, Parks MH, Desmond JE, Chen SH, Pryor MR, De Rosa E, Pfefferbaum A. Disruption of frontocerebellar circuitry and function in alcoholism. Alcoholism, Clinical and Experimental Research. 2003;27:301–309. doi: 10.1097/01.ALC.0000052584.05305.98. [DOI] [PubMed] [Google Scholar]
- Sullivan EV, Pfefferbaum A. Diffusion tensor imaging in normal aging and neuropsychiatric disorders. European Journal of Radiology. 2003;45:244–255. doi: 10.1016/s0720-048x(02)00313-3. [DOI] [PubMed] [Google Scholar]
- Sullivan EV, Pfefferbaum A. Neurocircuitry in alcoholism: a substrate of disruption and repair. Psychopharmacology (Berl) 2005;180:583–594. doi: 10.1007/s00213-005-2267-6. [DOI] [PubMed] [Google Scholar]
- Takahashi M, Hackney DB, Zhang G, Wehrli SL, Wright AC, O’Brien WT, Uematsu H, Wehrli FW, Selzer ME. Magnetic resonance microimaging of intraaxonal water diffusion in live excised lamprey spinal cord. Proceedings of the National Academy of Sciences of the United States of America. 2002;99:16192–16196. doi: 10.1073/pnas.252249999. [DOI] [PMC free article] [PubMed] [Google Scholar]
- Volkow ND, Fowler JS, Wang GJ, Goldstein RZ. Role of dopamine, the frontal cortex and memory circuits in drug addiction: insight from imaging studies. Neurobiology of Learning and Memory. 2002;78:610–624. doi: 10.1006/nlme.2002.4099. [DOI] [PubMed] [Google Scholar]
- Werring DJ, Toosy AT, Clark CA, Parker GJ, Barker GJ, Miller DH, Thompson AJ. Diffusion tensor imaging can detect and quantify corticospinal tract degeneration after stroke. Journal of Neurology, Neurosurgery, and Psychiatry. 2000;69:269–272. doi: 10.1136/jnnp.69.2.269. [DOI] [PMC free article] [PubMed] [Google Scholar]
- Yeh PH, Gazdzinski S, Durazzo TC, Sjostrand K, Meyerhoff DJ. Hierarchical linear modeling (HLM) of longitudinal brain structural and cognitive changes in alcohol-dependent individuals during sobriety. Drug and Alcohol Dependence. 2007 doi: 10.1016/j.drugalcdep.2007.05.027. [DOI] [PubMed] [Google Scholar]
- Yucel M, Lubman DI. Neurocognitive and neuroimaging evidence of behavioural dysregulation in human drug addiction: implications for diagnosis, treatment and prevention. Drug and Alcohol Review. 2007;26:33–39. doi: 10.1080/09595230601036978. [DOI] [PubMed] [Google Scholar]