Abstract
Precipitates of polyelectrolyte complexes were transformed into rugged shapes suitable for bioimplants by ultracentrifugation in the presence of high salt concentration. Salt ions dope the complex, creating a softer material with viscous fluid-like properties. Complexes that were compacted under the centrifugal field (CoPECs) were made from poly(diallyldimethyl ammonium), PDADMA, as polycation, and poly(styrene sulfonate), PSS, or poly(methacrylic acid), PMAA, as polyanion. Dynamic mechanical testing revealed a rubbery plateau at lower frequencies for PSS/PDADMA with moduli that decreased with increasing salt concentration, as internal ion pair cross-links were broken. CoPECs had significantly lower modulii compared to similar polyelectrolyte complexes prepared by the “multilayering” method. The difference in mechanical properties was ascribed to higher water content (located in micropores) for the former and, more importantly, to their nonstoichiometric polymer composition. The modulus of PMAA/PDADMA CoPECs, under physiological conditions, demonstrated dynamic mechanical properties that were close to those of the nucleus pulposus in an intervertebral disk.
Introduction
Hydrogels are water-swollen polymeric networks.1−4 Cross-links are introduced either by covalent bonding or by physical interactions, such as hydrogen bonding, Coulombic interactions, or van der Waals forces. Covalent gels are stable, whereas physical gels exhibit a greater sensitivity to the conditions of the surrounding environment. In covalent gels the number of cross-links is usually irreversible, whereas in the physical gels it can be tuned with the pH, temperature, or ionic strength. Soft biological tissues, such as cartilage5,6 or intervertebral disks,(2) are based on hydrogel matrices comprising extensive physical cross-links.
Macroscopic polyelectrolyte gels of chitosan, hyaluronan, and alginate have been studied for medical and pharmaceutical applications, such as drug delivery, wound healing, or cell immobilization.(7) In the early 90s, Decher and co-workers8,9 described a method for constructing ultrathin films of polyelectrolyte complex using pairs of oppositely charged polyelectrolytes. This versatile technique consists of the alternating deposition of polyelectrolytes on a substrate,10,11 resulting in so-called polyelectrolyte multilayers, PEMUs. Planar films or capsules have been obtained depending on the geometry of the substrate. PEMUs have been deposited on surfaces to improve the biocompatibility of materials12,13 and to control the behavior of cells grown on them.14−16
The density of cross-links in a gel determines its mechanical properties. PEMUs are essentially a thin-film morphology of polyelectrolyte complexes, PECs,17−19 where the cross-links are created by ion pairing between oppositely charged repeat units on polyelectrolytes. The density of these ion pair cross-links depends on the salt concentration of the solution to which they are exposed. By increasing the salt concentration of this solution, cross-links between polymer/polymer ion pairs, or “intrinsic” sites, are broken and replaced by polymer/counterion pairs, or “extrinsic” sites. This “doping” of a polyelectrolyte complex with a univalent salt can be described by the following equilibrium(20)
where Pol+ and Pol− are respective polycation and polyanion repeat units, and A− and C+ are the associated counterions. The subscript c refers to components in the complex phase. The equilibrium doping, or swelling, constant, Kdop, is defined as
where a is the activity of the relevant ion, and y and 1 − y are the respective fractions of extrinsic and intrinsic sites. The salt concentration is a powerful tool to control the cross-linking density and, therefore, the material properties of PECs. In the 60s, Michaels and others17,18,21 reported the swelling and the progressive transition of polyelectrolyte complexes from a glassy state to a rubbery one when exposed to electrolyte solutions. Yet no quantitative mechanical measurements were reported. More recently, the softening effect of salt has been described for various PEMUs.22−26 We described a systematic measurement of the static mechanical properties of a PEMU according to classical theories of rubber elasticity.(23)
We recently reported favorable mechanical damping properties for PEMUs.(24) While reproducible, dense films of PEC are routinely available by the multilayering method, when the same polyelectrolytes are mixed in solution to produce solution-precipitated PECs in larger quantities the products are diffuse blobs. In the present work, we describe a processing method for producing large-scale, resilient, formable articles of polyelectrolyte complex that are suitable for bioimplants. We term these complexes compact polyelectrolyte complexes, CoPECs. The immediate targets are replacement materials for connective structures between bones, which need to be tough, elastic, hydrated, and biocompatible. In addition, their mechanical properties should mimic as closely as possible those of the tissue (in the healthy state) they are replacing. In our method, we subject complexes to significantly higher salt concentrations than those they would experience during their intended application. Doping, per eq 1, by the additional salt ions induces plasticization, temporarily breaking the ion pairs and allowing the complex to flow under a centrifugal field. When the extreme salt concentration is removed, the complexes revert to a higher-modulus elastic state. To demonstrate the potential for in vivo use of CoPECs, we show that a CoPEC made with poly(methacrylic acid) (PMAA) and PDADMAC exhibits properties similar to those of the nucleus pulposus of an intervertebral disk.(27)
Materials and Methods
Poly(4-styrenesulfonic acid) (Mw = 7.5 × 10⁴ g/mol, Mw/Mn = 1.4) and poly(diallyldimethylammonium chloride) (Mw = 40 × 104 − 50 × 104 g/mol, Mw/Mn = 2.09) were both used as received from Aldrich. Poly(methacrylic acid) (Mw = 8.0 × 10⁴ g/mol) was purchased from Scientific Polymer Products. Sodium chloride (Fisher) was used to vary the ionic strength. All solutions were prepared in deionized water (Barnstead, E-pure, Milli-Q). For PSS/PDADMA, polyelectrolyte solutions were 0.5 M (with respect to the monomer unit) in 2.5 M NaCl. The pH of the solutions was adjusted to between 6.5−7.0 with 1 M NaOH or HCl. Complexes were prepared by mixing 20 mL of each polyelectrolyte solution under stirring. Precipitates were centrifuged using polycarbonate thick wall centrifuge tubes and an ultracentrifuge (Beckman XL-90) equipped with a type 70Ti rotor (tube angle 25°, Beckman) at 188000 g for 4 h at 25 °C. The CoPECs made in 2.5 M NaCl were immersed in NaCl solutions with concentrations ranging from 0.00 to 2.5 M for 48 h. PMAA/PDADMA CoPECs were prepared in the same way, except the concentrations of the polyelectrolyte solutions were fixed at 0.3 M, the pH was adjusted to 7.0, and CoPECs were made directly in Milli-Q water without any added salt, as the salt released from the complexation produced a physiologically relevant ionic strength of about 0.15 M NaCl. These CoPECs were annealed in 0.15 M NaCl.
Weight measurements allowed the determination of water and salt content in the CoPECs annealed under different [NaCl]. The mass of a CoPEC in the swollen state is the sum of the masses of polymers, salt (counterions), and water
where mpolymer, mNaCl(x), and mH2O(x) are the respective contributions of the polymer, salt, and water as a function of salt concentration, x. The index s refers to the swollen state. While the mass of the polymer is independent of solution salt concentration, the water and the salt content vary. The water content of the complex was determined for each salt concentration by drying (110 °C under vacuum to constant mass)
where the index d refers to the dry state. The salt content can be estimated from the difference in dry weight between salt-swollen and water-rinsed (x → 0) CoPECs
CoPECs were cut into pieces of msCoPEC(x) in the range 1−3 g and dabbed dry with a paper wipe before weighing. These pieces of gel were immersed in 50 mL of water for 2 days before weighing them to obtain msCoPEC(0). Some samples before and after immersion in water were dried at 80 °C under vacuum for 2 h to determine the water content mH2O(x) for each salt concentration. All experiments were repeated twice.
Mechanical shear tests were carried out on a controlled stress and strain Bohlin Gemini 150 rheometer with a parallel plate configuration (diameter = 20 mm) in a humidity enclosure chamber. Temperature was maintained at 37.0 ± 0.1 °C. Control and data collection were carried out with Bohlin software R6.50.5.6.
A compressive strain of about 10% was applied to ensure gripping of the samples and full planar contact. A relaxation time of a few minutes allowed the axial force to approach equilibrium. Dynamic oscillatory shear experiments, based on the sinusoidal variation of the strain (γ) and the stress (σ) with an angular frequency (ω), allowed the determination of the viscoelastic properties of CoPECs. The sinusoidal shear strain signal is γ = γ0eiωt. If the value of γ0 is small enough, the corresponding shear stress output is σ = σ0eiωt. This is the linear viscoelastic region (LVR) of the material. The complex shear modulus (G*) can be defined for the material as
where G′ is the storage modulus and G′′ is the loss modulus, representing, respectively, the real and the imaginary part of the complex shear modulus. The linear viscoelastic properties can be also described by the values of the magnitude of the shear complex modulus (|G*|) and the phase shift angle (δ) between the stress and the strain
The value of |G*| gives a measure of the shear stiffness of the material under dynamic conditions. Tan(δ) indicates the elastic or viscous nature of the material. δ varies between 0° (Hookean solid) and 90° (Newtonian fluids).(28) A dynamic angular frequency sweep (5 × 10⁻⁴ ≤ ω ≤ 188 rad/s) was achieved using a value of γ0 located in the LVR for all the frequency ranges. Samples for microscopy (10 μm thick) were sectioned with Accu-Edge stainless steel blades using a microtome under cryogenic conditions (−20 °C) and images were recorded, while the PEC was immersed in water, on a Nikon Eclipse Ti microscope equipped with a photometrics CoolSNAP HQ2 camera at 100× magnification in epifluorescence mode. A 450−490 nm excitation and a 500−550 nm emission filters were used in a 41017 Endow GFP bandpass emission filter cube. The complex was not stained.
Results and Discussion
Saloplasticity
All solid materials exhibit some combination of viscous and elastic response when deformed. In a permanently networked polymer a force exists that will restore the material to its original dimensions when stress is removed. Thus, the decades-old observation of “rubbery” properties in polyelectrolyte complexes(18) does not necessarily imply that PECs can be reformed into new shapes. For irreversible deformation into new shapes with similar mechanical properties, cross-links must be broken and remade. Due to the reversible salt-induced control of (physical) cross-link density, it is possible to remove cross-links during processing.
An additional requirement for processing is that residual cross-links must be able to break and reform under the time scale of the reshaping step. This implies a certain amount of interdiffusion in PECs. It is known that the addition of salt permits “frozen” polyelectrolyte complexes to become more mobile. A classic example is the exchange of polymers in a solution of “quasisoluble” polyelectrolyte complexes: the addition of salts transforms the complex from nonlabile (no exchange) to labile.(29) Similarly, we have demonstrated polyelectrolyte interdiffusion on the surface,(20) and in the bulk,(30) of PEMUs was accelerated by the presence of salt. The enhancement of interdiffusion is strongly nonlinear with salt addition, which prompted the Wageningen group to introduce phase diagrams defined by “glass transitions” between associated and dissociated states.(31) We prefer to think of transformations between nonlabile and labile PECs as ion-induced plasticization.
Temperature is a convenient and traditional parameter for molding polymeric materials. Thermoplastic polymers flow above a glass or melting transition temperature. We have not found any evidence of such thermal transitions in PECs (using differential scanning calorimetry on hydrated samples, data not shown), which are essentially polymeric salts, although higher temperature would certainly enhance interdiffusion and doping(32) of PECs. Doping by salt provides an alternate processing parameter, unique to materials held together by ion pairing cross-links. Because salt does for PECs what temperature does for thermoplastics, we term the salt-induced softening of PECs “saloplasticity.” Definition: a saloplastic material comprises ionic cross-links and may be permanently reshaped when sufficient cross-links are broken, for example, by exposure to a solution of sufficiently high salt concentration.
The degree of doping required for saloplastic deformation of a PEC probably depends on a number of variables, such as hydrophilicity and charge density of the constituent polymers. For the PSS/PDADMA system, it was empirically found that solution NaCl concentrations greater than about 2 M at r.t. were required to efficiently reshape the complex. When Kdop = 0.27 for NaCl is used,(33) and approximating activities for concentration, yields y ∼ 0.63 for 2 M NaCl and y ∼ 0.7 for 2.5 M NaCl. It is likely that whatever conditions of salt concentration, salt type, solvent, temperature, and polymers are chosen, y should be substantially greater than 0.5 for saloplastic processing.
Composition of a PSS/PDADMA CoPEC
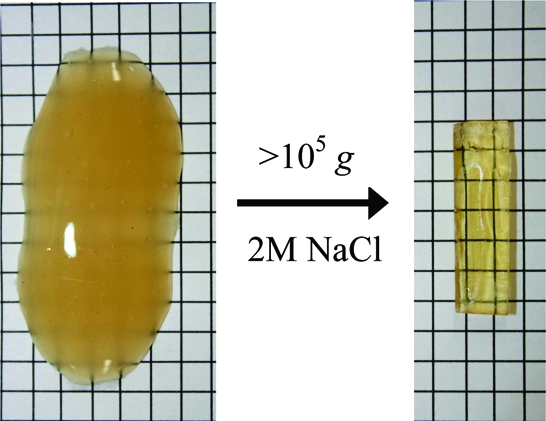
Centrifugation is commonly used to separate PECs from the aqueous phase, but the product is simply an opaque, amorphous blob of roughly the same consistency as the precipitate. During a solid-state NMR experiment we spun a PSS/PDADMA sample in 2 M salt at several kHz. After the sample was removed, we noticed it had been transformed into a clear, amber plug. The centrifugal fields described in are ultrahigh (>105g) and the PEC turns from a diffuse, off-white, scattering blob into a solid, tough, transparent solid that can be cut into shapes.
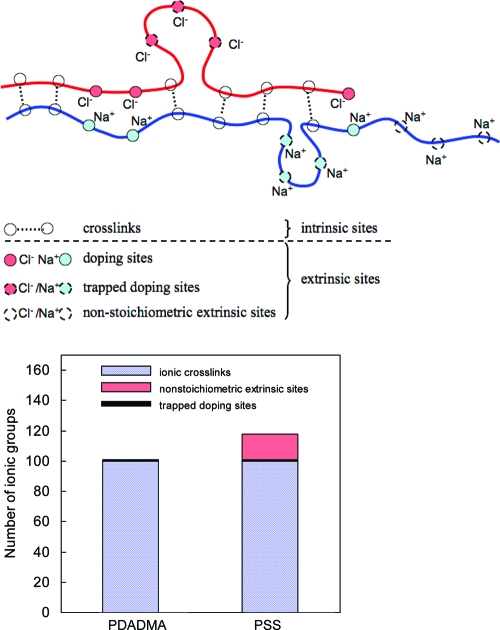
CoPECs are composed of a polymer matrix, counterions (salt), and water. Charges on polyelectrolytes are compensated either by a repeat unit from the oppositely charged partner (intrinsic) or by salt counterions (extrinsic). Extrinsic sites can have different origins. Some of the extrinsic sites are due to the doping of the cross-links in the gel network as eq 1 predicts. Additional extrinsic sites are introduced by a nonstoichiometric ratio between the polyelectrolyte ionic groups. Understanding the properties of a PEC requires comprehensive knowledge of the distribution of extrinsic versus intrinsic sites. Elemental analysis was performed on a dried PSS/PDADMAC CoPEC sample, prepared under 2.5 M NaCl, and rinsed in water for 48 h. The amounts of sulfur and nitrogen were 9.84 and 3.7 wt %, respectively, corresponding to a molar ratio of 1.17:1 PSS/PDADMA. In other words, the PSS/PDADMA CoPEC made at 2.5 M NaCl exhibits a 17% molar excess (based on the polyelectrolyte repeat units) of PSS, contrary to the 1:1 ratio expected for polyelectrolyte complexation.(34) Furthermore, a small quantity of chloride, 0.62 wt %, was also revealed in the elemental analysis. The presence of chloride in PEC annealed in water was surprising, because all the ionic groups of the PDADMA were expected to be involved in a cross-link. This chloride content suggests the presence of some residual doping sites in the polymer matrix, possibly resulting from some topological constraints that hinder the formation of a cross-link. Scheme 1 presents all the possible interactions between the ionic groups carried by the polyelectrolyte chains in the PEC matrix. The distribution of the ionic groups of both polyelectrolytes is also given for a given number of 100 cross-links.
Scheme 1. Representation of all Types of Charge Compensation in a Water-Rinsed PSS/PDADMA Complex.
Ionic crosslinks are paired polyelectrolyte repeat units. Doping sites are reversibly formed extrinsic charges according to eq 1. Trapped doping sites are extrinsic sites where the polyelectrolyte charges cannot pair because of kinetic constraints on reorganizing polymer chains. Nonstoichiometric extrinsic charge results from non-1:1 stoichiometry of polyelectrolytes in the complex. In this case, PSS is in excess.
In PECs, including PEMUs, the ratio between the opposite ionic groups is usually assumed to be close to 1:1, though some structural studies have indirectly indicated significant nonstoichiometry.35,36 Kabanov(29) and Dautzenberg et al.(34) state that nonstoichiometric PECs require specific experimental conditions, such as a strong difference in molecular weight between polyelectrolytes, significant nonstoichiometry in addition, or high dilution, none of which are present in our system. It is not possible to use elemental analysis to determine the ratio between the ionic groups of each polyelectrolyte in multilayers because only small amounts of material (ng to μg) are available. Using radioanalytical methods, we found no residual salt and thus concluded that the polyelectrolyte stoichiometry in a multilayer built in 0.1 M NaCl was 1:1.(37) This finding was somewhat contradicted by our subsequent FTIR measurements of counterions in PSS/PDADMA PEMUs built in 1.0 M NaCl, which revealed about 3 mol % residual salt.(38) In the CoPEC, prepared in 2.5 M NaCl, this percentage is greater and lies around 18% (trapped doping sites and nonstoichiometric sites). It is possible that nonstoichiometry in PECs (and PEMUs) becomes more significant at higher salt concentrations. Indeed, we found that PSS partially precipitated in 4.5 M NaCl, whereas PDAMAC remained soluble at this same [NaCl], suggesting that concentrated NaCl solutions are worse solvents for PSS than for PDADMAC.
Water and Salt Content for a PSS/PDADMA CoPEC
Water and salt contents of a PSS/PDADMA CoPEC treated with NaCl solutions of concentrations varying from 0.0 to 2.5 M were determined by weight measurements. The masses of wet and dry materials for doped and undoped PEC are known and the difference yields water and salt content (see ). The total mass of a CoPEC, mCoPEC(x), which varies with salt concentration (eq 3), was normalized to the mass of the dry CoPEC treated with pure water, mdCoPEC(0), which corresponds to the mass of the polymer matrix plus the residual salt contained in the nonstoichiometric extrinsic sites and the doping trapped sites. On soaking in pure water, the number of cross-links is at a maximum (see eq 2). Because no dissolution of the CoPEC was observed in the different treatment solutions, this mass can be assumed to be constant. The weight ratios are defined as
 |
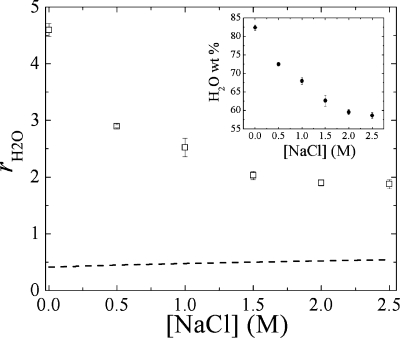
As shown in Figure 1, total water content as a function of [NaCl] ranges from 60 to 80%. By comparison, the quantity of water contained in a PSS/PDADMA PEMU built at 1.0 M NaCl is usually lower and is around 30%.(33) PEMUs based on hydrophilic polyelectrolytes that can diffuse rapidly over several micrometers into the film during construction exhibit higher water content values: around 75% at 0.15 M NaCl.39,40 A high water content makes CoPECs suitable for use as replacements for soft biological tissues that exhibit similar water contents.
Figure 1.
Weight ratio of water to polymer content for PSS/PDADMA CoPEC treated with NaCl solutions of various concentration (◻). Inset (●) shows water content as a weight % of the CoPEC. The dashed line is the theoretical weight ratio that comes from hydrating the polyelectrolyte ion pairs only (6.9 H2O per polyelectrolyte ion pair and 5.6 H20 per counterion-compensated site). The difference between the experimental and the theoretical values is due to the presence of the pores.
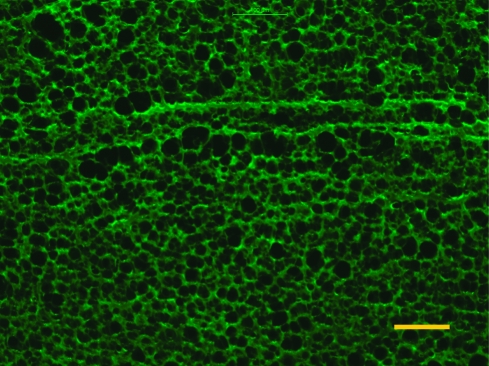
rH2O(x) decreases from about 5 for pure water to 2 in 2.5 M NaCl, meaning the matrix of PSS/PDADMA made at 2.5 M NaCl can absorb between 2 and 5 times its weight of water by varying the salt concentration of the solution to which it is exposed. This value can be compared to a theoretical one calculated using the composition of the polymer matrix determined previously with the elemental analysis, and by taking a water of hydration of 6.9 molecules H2O per cross-link and 5.6 H2O per extrinsic sites.(33) A Kdop of 0.27 was used(33) to calculate hydration water from doping the PSS/PDADMA CoPEC. A large difference between the experimental and the theoretical values can be observed. This difference is due to the presence of pores in the complex. A micrograph of a 10 μm slice of PSS/PDADMA CoPEC in water is shown in Figure 2.
Figure 2.
Epifluorescence micrograph of a 10 μm thick slice of PSS/PDADMA prepared in 2.5 M NaCl, centrifuged, and then washed in water: 450−490 nm excitation and 500−550 nm emission filter cube. The scale bar is 100 μm.
Extensive porosity is clearly observed. As the salt concentration increases, the volume of the pores decreases (see Figure 1). These are roughly the same size as micrometer diameter PEMU capsules, which were shown to exhibit excess osmotic pressure inside the capsule due to excess polyelectrolyte(41) as is also thought to be the case with strongly swollen, hydrated polylysine/hyaluronic acid multilayers.(42) It is probable that the pores in Figure 2 contain much of the excess PSS, which generates a differential osmotic pressure (relative to solution) at lower salt concentrations. Given the propensity of polyelectrolytes to pair 1:1 (at lower salt concentrations) and to phase separate, by pore formation or decomposition,(43) it is also reasonable to suppose that excess PSS appears on the inner surface of the pores.
We also observed dehydration of PSS/PDADMA multilayers (they have minimal pore volume) with increasing [NaCl],20,44 but at sufficiently high salt concentration, the PEMU was rehydrated because of the additional water brought into the film by doping.(33) For the CoPEC described in Figure 1 the starting water content is simply too high for the doping process to rehydrate the PEC. Any water not directly hydrating polyelectrolytes is considered pore water. From Figure 1, the polymer hydration water increases slightly, but remains at r ∼ 0.5. The pore volume is given by
 |
where d is the density of PSS/PDADMA (ca. 1.2 g cm−3).
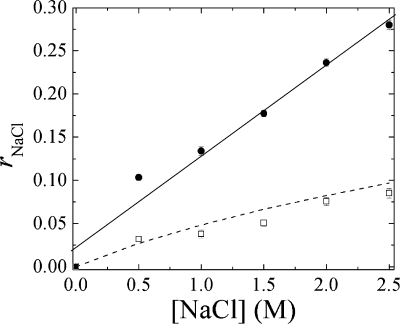
Upon reviewing Scheme 1 and Figure 2, the total ion content given by eq 5 contains contributions from salt in pores, mNaCl,pore(x), salt from doping mNaCl,dop(x), and (sodium) ions from polyelectrolyte nonstoichiometry mNa,nonst. The latter does not depend on solution salt concentration. Figure 3 depicts the relative NaCl content versus the solution salt concentration in a PSS/PDADMA CoPEC. Because of the drying method used, all the experimental points include about 1.0% (r = 0.01) from trapped NaCl (elemental analysis provided 0.62% Cl, which is 1.02% NaCl) and 1.26% (r = 0.0126) from the Na+ counterions balancing excess PSS.
Figure 3.
Experimental NaCl content (●) in a PSS/PDADMA CoPEC. The solid line is a guide to the eye showing an intercept of about 0.023, which is from nonstoichiometric and trapped ions. The theoretical value of rNaCl expected from doping only is shown as a dotted line. When the estimated NaCl content in pore volume, and the nonstoichiometric and trapped ions are subtracted, the remainder (◻) is close to NaCl expected from doping. The theoretical value of rNaCl was calculated assuming Kdop = 0.27.
The pore content of salt, rNaCl,pore, is approximated by
When this contribution is subtracted from rNaCl in Figure 3, along with the r = 0.023 intercept, the remainder corresponds more closely to the expected salt brought in by doping alone.
Samples of CoPEC exhibit informative changes in optical properties when they are immersed in different salt concentrations. A CoPEC prepared in 2.5 M NaCl is clear and transparent after the centrifugation step, whereas it turns white and opaque when it is soaked in NaCl solutions of lower concentration. These observations are consistent with a porous structure, wherein the refractive index of the doped complex is matched with the solution at high salt concentrations (n is ca. 1.4 for 3 M NaCl(45)). At lower salt concentrations, a refractive index difference between pore and complex leads to scattering. Light scattering in hydrogels has been used to track their formation and response.46−48
A porous morphology may well be driven by the nonstoichiometric composition of the complex. Many studies on the morphology of PEMUs have shown that a shift in the balance of negative and positive polyelectrolyte charge can lead to major phase separations in films. The most striking example is when pH is used to control the state of protonation in PEMUs made with weak polyacids or polybases, such as PAA. At the extreme, complete decomposition of complex is observed when the pH changes.(49) For more rugged systems, such as those made with poly(allylamine), significant porosity transitions are seen.(50) If the excess polyelectrolyte charge that appears on a pH shift is limited, it may be extruded to the surface of the complex,(43) changing the surface charge on the complex.(51) We believe that in the CoPECs studied here, excess PSS appears on the outer surface of the complex and on the inner surface of the pores. Additional PSS resides inside the pores, generating osmotic pressure. When the solution osmotic pressure increases, at higher salt concentrations, the excess osmotic pressure of the PSS in the pores is masked and water leaves the CoPEC, as seen in Figure 1.
Dynamic Mechanical Properties of PSS/PDADMA CoPECs
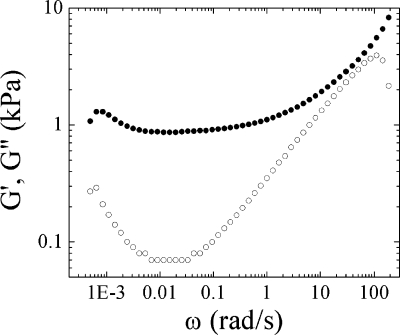
As the mechanical properties of a gel depend on cross-link density, the dynamic mechanical properties of CoPECs were characterized by rheometry in a plate−plate geometry. All samples were mounted in an environmental chamber. The CoPECs were immersed in salt solution of fixed concentration and the temperature maintained at 37 °C. G′ and G′′ for a PSS/PDADMA CoPEC exposed to 2.5 M NaCl are shown in Figure 4.
Figure 4.
Dynamic storage modulus G′ (●) and loss modulus G′′ (○) at 37 °C as a function of the angular frequency, ω (rad/s), for PSS/PDADMA CoPECs in 2.5 M NaCl.
Although G′ and G′′ decreased at the lowest angular frequencies, no liquid-like behavior was observed. At higher frequencies (>10 rad/s), the moduli become similar and increase with the frequency: G′ ∼ G′′ ∼ ωΔ with a Δ ≈ 0.5. In this region, the shortest relaxation processes in the complexes take place. From where G′ and G′′ converge, these relaxations are apparently on the order of 10’s of ms, consistent with stress-relaxation results of PEMUs.(23) At such a time scale, the movement of short chain sections containing only few monomers is feasible. If the cross-link density is low enough, these sections are not sensitive to the network structure. Thus, the behavior of these sections can be described by Rouse’s model(52) that predicts G′(ω) = G′′(ω) ∝ ω1/2 (Figure 4).
At intermediate angular frequencies, between 0.002 and 1 rad/s, the complex exhibits mainly elastic response. G′ has a weak frequency dependence and it is significantly greater than G′′, although the viscous response is not negligible, having a phase angle between 4 and 12°. In this zone, termed the rubbery plateau, G′ is constant, equal to the equilibrium shear modulus, Ge. It was shown that physical cross-linked gels also follow the rubber elasticity theory of a network,(53) where Ge is described by the following:
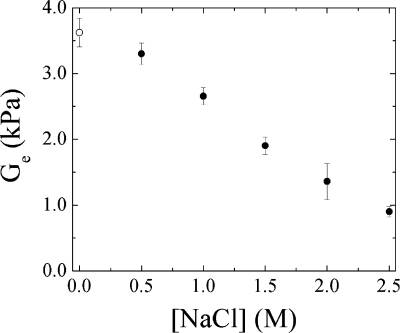
where Φ is a correction factor approaching unity for isotropic systems, v is the density of elastically active chains, which is proportional to the cross-link density, R is the ideal gas constant, and T is the absolute temperature. Ge is directly proportional to the number of cross-links in the material. For all salt concentrations, except [NaCl] = 0, a rubbery plateau was observed for the PSS/PDADMA CoPEC. Ge, taken from the plateau, was used to infer the cross-link density in the material in response to salt concentrations between 0.5 and 2.5 M using eq 11. Figure 5 depicts Ge, recorded at 0.003 rad/s, as a function of salt concentration. Figure 5 also includes G′ for the CoPEC in water at this frequency.
Figure 5.
Equilibrium shear modulus in the rubbery plateau (●), Ge at 37 °C, and an angular frequency of 0.003 rad/s for a PSS/PDADMA CoPEC in 0.5 to 2.5 M NaCl solutions. For comparison, the value of G′ at 0.003 rad/s for the CoPEC immersed in water (○) is displayed.
Ge decreases with salt concentration. The cross-links are progressively replaced by counterion-doped sites and the CoPEC becomes softer. In this concentration range, we estimate the cross-link density falls from 72 to 35%.(23) The decrease of Ge is linear in response to the decrease in cross-links deduced from Figure 5. This result implies that the change in water content (Figure 1), which should lead to an increase in modulus, has a minor impact on Ge in comparison to the effect of cross-link density.
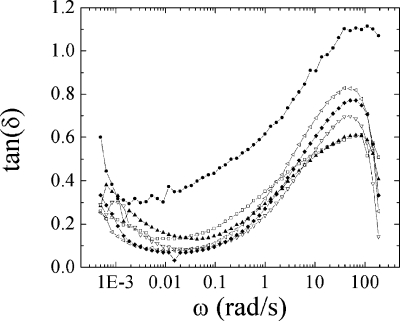
The salt concentration also influences the loss modulus. Response to salt concentration is weak in the rubbery plateau since the material is essentially elastic but it becomes important at higher frequencies. Figure 6 summarizes the frequency dependence of tan(δ) for all the salt concentrations.
Figure 6.
Tan(δ) as a function of frequency at 37 °C for PSS/PDADMA CoPECs immersed in salt concentrations of 0.0 M (●), 0.5 M (◻), 1.0 M (▲), 1.5 M (▽), 2.0 M (◆), 2.5 M (left-facing open triangle).
The frequency response is similar for all salt concentrations. Figure 6 also shows anomalous response in salt-free water, which displays a tan(δ) value greater than the complexes immersed in NaCl solutions. Two regimes are seen in the behavior of tan(δ). At low frequencies (<1 rad/s), the low values of tan(δ) are consistent with the presence of a rubbery plateau for all the salt concentrations. At higher frequencies, tan(δ) increases as the material dissipates energy. The maximum tan(δ) values, reached just before entering the nonlinear viscoelastic region (characterized by the rapid decrease of tan(δ)), increase with increasing NaCl concentration. This characteristic behavior at high frequencies was also observed with PSS/PDADMA multilayers.(24) Decreasing cross-link density in the complex, whether in the PEMU or CoPEC morphology, provides for better dissipation of energy into the material. Thus, their damping properties can also be controlled by the ionic strength of the surrounding solution. The anomalous properties of the CoPEC in water suggest exceptionally good damping properties over a wide range of frequencies in the absence of salt. Under these conditions, the complex is hyperswollen with water (contains about 80% by weight H2O, see Figure 1).
Various techniques, none frequency dependent, such as nanoindentation,54−59 quartz crystal microbalance,60,61 or capillary wave(62) experiments on film morphologies and deformation with atomic force microscopy22,25,63,64 or under osmotic pressure41,65 on capsule morphologies have been used to determine the mechanical properties of PEMUs. There is a significant difference in the magnitude of moduli for PEMUs found in most of these studies and the G values for CoPECs reported here. Generally, Ge values for multilayers built with classic systems such as PSS/PDADMA or PSS/PAH lie in the range 0.001−1 GPa. For example, we found Ge = 0.3 MPa for a PSS/PDADMA PEMU in 1 M NaCl (at r.t.), which is almost 3 orders greater than Ge for the same material as a CoPEC in the same salt concentration (at 37 °C, Figure 5). While this difference can be partially explained by the slightly higher temperature, much higher water content, and the microporosity of the CoPEC, we believe that the majority of the discrepancy is due to the nonstoichiometric composition of the CoPEC. When Figures 1 and 5 are compared, it is clear that changes in the extrinsic site concentration (doping) overwhelm effects on Ge due to changes in water content. The 17% excess of PSS effectively introduces a high “baseline” doping level in CoPECs even when they are immersed in pure water. In other words, the excess PSS plasticizes the CoPEC and decreases the cross-link density.
CoPECs of PMAA/PDADMA as Candidates for the Replacement of the Nucleus Pulposus
Gels with moduli in the range of kPa are of widespread interest as biomaterials. Many native tissues have moduli in this range, including nasal cartilage,(66) the kidney cortex,(67) and the adventitial layer.(68) CoPECs exhibit properties that fit many of the requirements of materials to replace these tissues. The conditions cannot be tuned by salt concentration, because they must be fixed at physiological conditions (37 °C, pH ca. 7 and about 0.15 M NaCl), but the properties of a CoPEC can be matched to those of the tissue by proper selection of composition.
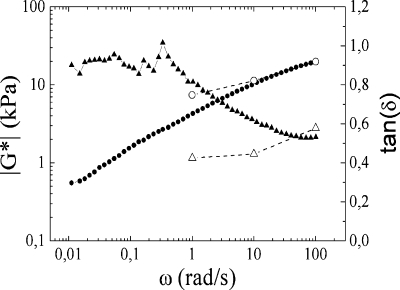
The intervertebral disk is composed of a nucleus pulposus surrounded by an annulus fibrosus. The latter is a tough skin, while the nucleus pulposus is a softer shock absorbing material with a water content between 70−80%, where |G*| from 1 to 100 rad/s lies between 7 and 20 kPa, with a loss angle between 23 and 30° for in vivo conditions.(27) After experimentation with a few combinations of polycations and polyanions, it was found that CoPECs made from PMAA and PDADMA were suitable for mimicking the properties of the nucleus pulposus. These CoPECs are well doped in 0.15 M NaCl, as are PEMUs of similar composition. The pH was fixed at 7.0 during synthesis and use to maintain the weak acid functionality on PMAA in the ionized state, and the ionic strength was likewise constant at 0.15 M NaCl. The water content of the PMAA/PDADMA CoPEC under these conditions was about 82 wt %. The mechanical properties of this complex, |G*|, and tan(δ) are shown in Figure 7.
Figure 7.
Dynamic complex modulus |G*| (●) and the tan of the loss angle (▲) at 37 °C as a function of the angular frequency, ω, (rad/s) for a PMAA/PDADMA CoPEC made and soaked in 0.15 M NaCl concentration. For comparison, the values of |G*| (○) and tan(δ) (△) obtained by Iatridis et al.(27) for a nondegenerated human lumbar nucleus pulposus are also plotted.
The properties are different from the PSS/PDADMA CoPECs. A rubbery behavior is no longer observed. At low frequencies G′ and G′′ are similar and low. However, the complex has a solid-like behavior with δ < 45°. From 1 to 100 rad/s, values of observed |G*| are close to those determined by Iatridis et al.(27) for the nucleus pulposus in the human intervertebral disk. |G*| is between 3 and 20 kPa. The loss angle is of the same magnitude but increases to higher values at lower frequencies for the CoPEC. A small amount of cross-linking may reduce the fluid-like properties of the CoPEC at low frequencies to better match the natural material.
Conclusions
We have described a technique for preparing useful macroscopic physical hydrogels from a blend of synthetic polyanion and polycation using aqueous processing conditions. As an example, we were able to approach the dynamic mechanical properties of the intervertebral nucleus pulposus with a PMAA/PDADMA CoPEC. Further study of the literature indicates striking similarities with other tissues. For example, articular cartilage employs (negatively charged) proteoglycans to generate osmotic pressure within the tissue.(69) While this work has focused on two-component compact polyelectrolyte complexes, a limitless combination of various proportions of positive and negative components is possible, including mixtures of two or more polyanions(43) or polycations and other components traditionally used to construct PEMUs.(14) The CoPEC morphology extends the composition of polyelectrolyte multilayers, which have shown useful damping properties, into larger forms that may be shaped or extruded into new biomaterials. Like PEMUs, the mechanical properties of CoPECs depend on doping or the internal balance between extrinsic and intrinsic charge.
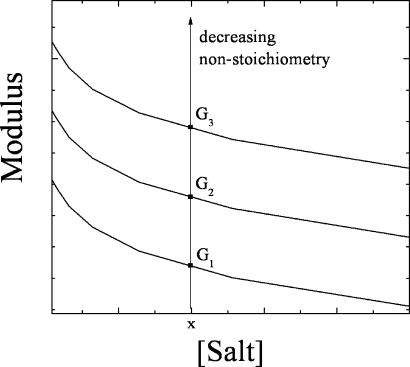
We have demonstrated, or reinforced, some thought-provoking concepts. The first is the idea that polymer charge nonstoichiometry has an enormous impact on mechanical properties of systems cross-linked by ion pairs. This finding is a dimension for control of mechanical properties in addition to the following: polymer composition, charge density, pH, doping level (salt concentration), void volume, water content, the presence of other physical (e.g., hydrogen bonding) or chemical cross-links, and temperature. The concept is illustrated by Scheme 2, which shows a family of saloplastic curves for different polymer charge stoichiometries. As the charge stoichiometry approaches 1:1, the material approaches its highest modulus at a given salt concentration. Second, micropore formation within the PEMU is probably driven and stabilized by excess polyelectrolyte charge. Porosity is advantageous to the use of CoPECs as biomaterials: natural connective tissue is opaque (or at least translucent) as a result of void volume. Porosity supports vascular or nerve growth where nutrient transport is required. The mechanical damping properties of a polymer/fluid microcomposite may also be superior to a more uniform material, since a viscosity component is required for efficient damping. Internal osmotic pressure generated by excess charged (bio)macromolecules keeps the material expanded.
Scheme 2. Proposed Influence of the Stoichiometry between the Charged Groups of each Polyelectrolyte inside the Complex on the Equilibrium Modulus.
Materials of each stoichiometry exhibit decreasing modulus with increasing salt. The closer the CoPEC is to 1:1 stoichiometry, the greater the modulus.
Acknowledgments
The authors are grateful to Prof. S. Ramakrishnan for help with the rheometer setup and to H.H. Hariri, X. Jia, M.Z. Markarian, and M.D. Moussallem for the TOC art and the photomicrograph. This work was supported by grants from the National Science Foundation (Grant DMR0309441), the National Institutes of Health (Grant R01EB006158), and a Fulbright grant for C.H.P.
Funding Statement
National Institutes of Health, United States
References
- Peppas N. A.Hydrogels in Medicine and Parmacy. Properties and Applications; CRC Press: Boca Raton, 1987; Vol 3. [Google Scholar]
- Bao Q. B.; McCullen G. M.; Higham P. A.; Dumbleton J. H.; Yuan H. A. Biomaterials 1996, 17, 1157–1167. [DOI] [PubMed] [Google Scholar]
- Thomas J.; Lowman A.; Marcolongo M. J. Biomed. Mater. Res. 2003, 67A, 1329–1337. [DOI] [PubMed] [Google Scholar]
- Hutmacher D. W. J. Biomater. Sci., Polym. Ed. 2001, 12, 107–124. [DOI] [PubMed] [Google Scholar]
- Muir H. Bioessays 1995, 17, 1039–1048. [DOI] [PubMed] [Google Scholar]
- Roughley P. J.; Lee E. R. Microsc. Res. Tech. 1994, 28, 385–397. [DOI] [PubMed] [Google Scholar]
- Petrak K. J. Bioact. Compat. Polym. 1986, 1, 202–219. [Google Scholar]
- Decher G.; Hong J. D. Ber. Bunsen-Ges. Phys. Chem. 1991, 95, 1430–1434. [Google Scholar]
- Decher G.; Lvov Y.; Schmitt J. Thin Solid Films 1994, 244, 772–777. [Google Scholar]
- Decher G.; Schlenoff J. B.. Multilayer Thin Films: Sequential Assembly of Nanocomposite Materials; Wiley: New York, 2003. [Google Scholar]
- Decher G. Science 1997, 277, 1232–1237. [Google Scholar]
- Podsiadlo P.; Paternel S.; Rouillard J. M.; Zhang Z. F.; Lee J.; Lee J. W.; Gulari L.; Kotov N. A. Langmuir 2005, 21, 11915–11921. [DOI] [PubMed] [Google Scholar]
- Boura C.; Menu P.; Payan E.; Picart C.; Voegel J. C.; Muller S.; Stoltz J. F. Biomaterials 2003, 24, 3521–3530. [DOI] [PubMed] [Google Scholar]
- Salloum D. S.; Olenych S. G.; Keller T. C. S.; Schlenoff J. B. Biomacromolecules 2005, 6, 161–167. [DOI] [PubMed] [Google Scholar]
- Schneider A.; Francius G.; Obeid R.; Schwinte P.; Hemmerle J.; Frisch B.; Schaaf P.; Voegel J. C.; Senger B.; Picart C. Langmuir 2006, 22, 1193–1200. [DOI] [PubMed] [Google Scholar]
- Olenych S. G.; Moussallem M. D.; Salloum D. S.; Schlenoff J. B.; Keller T. C. S. Biomacromolecules 2005, 6, 3252–3258. [DOI] [PubMed] [Google Scholar]
- Michaels A. S.; Miekka R. G. J. Phys. Chem. 1961, 65, 1765–1773. [Google Scholar]
- Michaels A. S. Ind. Eng. Chem. 1965, 57, 32–40. [Google Scholar]
- Sukhishvili S. A.; Kharlampieva E.; Izumrudov V. Macromolecules 2006, 39, 8873–8881. [Google Scholar]
- Dubas S. T.; Schlenoff J. B. Langmuir 2001, 17, 7725–7727. [Google Scholar]
- Yano O.; Wada Y. J. Appl. Polym. Sci. 1980, 1723. [Google Scholar]
- Lebedeva O. V.; Kim B.-S.; Vasilev K.; Vinogradova O. I. J. Colloid Interface Sci. 2005, 284, 455–462. [DOI] [PubMed] [Google Scholar]
- Jaber J. A.; Schlenoff J. B. J. Am. Chem. Soc. 2006, 128, 2940–2947. [DOI] [PubMed] [Google Scholar]
- Jaber J. A.; Schlenoff J. B. Chem. Mater. 2006, 18, 5768–5773. [Google Scholar]
- Lulevich V. V.; Vinogradova O. I. Langmuir 2004, 20, 2874–2878. [DOI] [PubMed] [Google Scholar]
- Heuvingh J.; Zappa M.; Fery A. Langmuir 2005, 21, 3165–3171. [DOI] [PubMed] [Google Scholar]
- Iatridis J. C.; Setton L. A.; Weidenbaum M.; Mow V. C. J. Biomech. 1997, 30, 1005–1013. [DOI] [PubMed] [Google Scholar]
- Ferry J. D.Viscoelastic Properties of Polymers, 2nd ed.; Wiley: New York, 1970. [Google Scholar]
- Kabanov V. A. In Multilayer Thin Films: Sequential Assembly of Nanocomposite Materials; Decher, G., Schlenoff, J. B., Eds.; Wiley: New York, 2003. [Google Scholar]
- Jomaa H. W.; Schlenoff J. B. Macromolecules 2005, 38, 8473–8480. [Google Scholar]
- Kovaceviv D.; van der Burgh S.; de Keizer A.; Cohen Stuart M. A. Langmuir 2002, 18, 5607–5612. [Google Scholar]
- Bucur C. B.; Sui Z.; Schlenoff J. B. J. Am. Chem. Soc. 2006, 128, 13690–13691. [DOI] [PubMed] [Google Scholar]
- Schlenoff J. B.; Rmaile A. H.; Bucur C. B. J. Am. Chem. Soc. 2008, 130, 13589–13597. [DOI] [PubMed] [Google Scholar]
- Dautzenberg H.; Jaeger W.; Kötz J.; Philipp B.; Seidel C.; Stscherbina D.. Polyelectrolytes: Formation, Characterization and Application; Hanser: Munich, 1994. [Google Scholar]
- Schmitt J.; Gruenewald T.; Decher G.; Pershan P. S.; Kjaer K.; Löshe M. Macromolecules 1993, 26, 7058–7063. [Google Scholar]
- Riegler H.; Essler F. Langmuir 2002, 18, 6694–6698. [Google Scholar]
- Schlenoff J. B.; Ly H.; Li M. J. Am. Chem. Soc. 1998, 120, 7626–7634. [Google Scholar]
- Farhat T. R.; Schlenoff J. B. J. Am. Chem. Soc. 2003, 125, 4627–4636. [DOI] [PubMed] [Google Scholar]
- Burke S. E.; Barrett C. J. Biomacromolecules 2005, 6, 1419–1428. [DOI] [PubMed] [Google Scholar]
- Porcel C.; Lavalle P.; Ball V.; Decher G.; Senger B.; Voegel J. C.; Schaaf P. Langmuir 2006, 22, 4376–4383. [DOI] [PubMed] [Google Scholar]
- Vinogradova O. I.; Andrienko D.; Lulevich V. V.; Nordschild S.; Sukhorukov G. B. Macromolecules 2004, 37, 1113–1117. [Google Scholar]
- Mjahed H.; Voegel J. C.; Senger B.; Chassepot A.; Rameau A.; Ball V.; Schaaf P.; Boulmedais F. Soft Matter 2009, 5, 2269–2276. [Google Scholar]
- Sui Z.; Schlenoff J. B. Langmuir 2004, 20, 6026–6031. [DOI] [PubMed] [Google Scholar]
- Jaber J. A.; Schlenoff J. B. Langmuir 2007, 23, 896–901. [DOI] [PubMed] [Google Scholar]
- CRC Handbook of Chemistry and Physics, 87th ed.; Lide D. R., Ed.; CRC Press: Cleveland, 2007; Vol. 129. [Google Scholar]
- Kara S.; Pekcan O. Polymer 2000, 41, 6335–6339. [Google Scholar]
- Pekcan O.; Catalgil-Giz H.; Caliskan M. Polymer 1998, 39, 4453–4456. [Google Scholar]
- Zhou X. J.; Weng L. H.; Zhang J. M.; Shen D. Y.; Xu J. J. Polym. Sci., Part B: Polym. Phys. 2003, 41, 2290–2295. [Google Scholar]
- Sukhishvili S. A.; Granick S. J. Am. Chem. Soc. 2000, 122, 9550–9551. [Google Scholar]
- Mendelsohn J. D.; Barrett C. J.; Chan V. V.; Pal A. J.; Mayes A. M.; Rubner M. F. Langmuir 2000, 16, 5017–5023. [Google Scholar]
- Sui Z. J.; Schlenoff J. B. Langmuir 2003, 19, 7829–7831. [Google Scholar]
- Rouse P. E. J. Chem. Phys. 1953, 21, 1272–1280. [Google Scholar]
- Treloar L. R. G.The Physics of Rubber Elasticity, 3rd ed.; Clarendon Press: Oxford, 1975. [Google Scholar]
- Richert L.; Engler A. J.; Discher D. E.; Picart C. Biomacromolecules 2004, 5, 1908–1916. [DOI] [PubMed] [Google Scholar]
- Pavoor P. V.; Bellare A.; Strom A.; Yang D. H.; Cohen R. E. Macromolecules 2004, 37, 4865–4871. [Google Scholar]
- Nolte A. J.; Rubner M. F.; Cohen R. E. Macromolecules 2005, 38, 5367–5370. [Google Scholar]
- Francius G.; Hemmerle J.; Ball V.; Lavalle P.; Picart C.; Voegel J. C.; Schaaf P.; Senger B. J. Phys. Chem. C 2007, 111, 8299–8306. [Google Scholar]
- Francius G.; Hemmerle J.; Ohayon J.; Schaaf P.; Voegel J. C.; Picart C.; Senger B. Microsc. Res. Tech. 2006, 69, 84–92. [DOI] [PubMed] [Google Scholar]
- Mermut O.; Lefebvre J.; Gray D. G.; Barrett C. J. Macromolecules 2003, 36, 8819–8824. [Google Scholar]
- Salomäki M.; Laiho T.; Kankare J. Macromolecules 2004, 37, 9585–9590. [Google Scholar]
- Lukkari J.; Salomäki M.; Aaritalo T.; Loikas K.; Loiko T.; Laiho T.; Kankare J. Langmuir 2002, 18, 8496–8502. [Google Scholar]
- Safouane M.; Miller R.; Möhwald H. J. Colloid Interface Sci. 2005, 292, 86–92. [DOI] [PubMed] [Google Scholar]
- Dubreuil F.; Elsner N.; Fery A. Eur. Phys. J. E 2003, 12, 215–221. [DOI] [PubMed] [Google Scholar]
- Vinogradova O. I.; Lebedeva O. V.; Vasilev K.; Gong H. F.; Garcia-Turiel J.; Kim B. S. Biomacromolecules 2005, 6, 1495–1502. [DOI] [PubMed] [Google Scholar]
- Gao C.; Donath E.; Moya S.; Dudnik V.; Möhwald H. Eur. Phys. J. E 2001, 5, 21–27. [Google Scholar]
- Frank E. H.; Grodzinsky A. J. J. Biomech. 1987, 20, 629–639. [DOI] [PubMed] [Google Scholar]
- Erkamp R. Q.; Wiggins P.; Skovoroda A. R.; Emelianov S. Y.; O’Donnell M. Ultrason. Imaging 1998, 20, 17–28. [DOI] [PubMed] [Google Scholar]
- Carter F. J.; Frank T. G.; Davies P. J.; McLean D.; Cuschieri A. Med. Imaging Anal. 2001, 5, 231–236. [DOI] [PubMed] [Google Scholar]
- Urban J. P. G.; Maroudas A.; Bayliss M. T.; Dillon J. Biorheology 1979, 16, 447–464. [DOI] [PubMed] [Google Scholar]


