Abstract
Objective
Apply ultrasound (US) imaging techniques to better describe the characteristics of myofascial trigger points (MTrPs) and the immediately adjacent soft tissue.
Design
Descriptive (exploratory) study.
Setting
Biomedical research center.
Participants
9 subjects meeting Travell and Simons’s criteria for MTrPs in a taut band in the upper trapezius.
Interventions
(None)
Main Outcome Measures
MTrPs were evaluated by 1) physical examination, 2) pressure algometry, and 3) three types of ultrasound imaging including grayscale (2D US), vibration sonoelastography (VSE), and Doppler.
Methods
Four sites in each patient were labeled based on physical examination as either active MTrP (spontaneously-painful, A-MTrP), latent MTrP (non-painful, L-MTrP), or normal myofascial tissue. US examination was performed on each subject by a team blinded to the physical findings. A 12-5 MHz US transducer was used. VSE was performed by color Doppler variance imaging while simultaneously inducing vibrations (~92Hz) with a handheld massage vibrator. Each site was assigned a tissue imaging score (TIS) as follows: 0 = uniform echogenicity and stiffness; 1 = focal hypoechoic region with stiff nodule; 2 = multiple hypoechoic regions with stiff nodules. Blood flow in the neighborhood of MTrPs was assessed using Doppler imaging. Each site was assigned a blood flow waveform score (BFS) as follows: 0 = normal arterial flow in muscle; 1 = elevated diastolic flow; 2 = high-resistance flow waveform with retrograde diastolic flow.
Results
MTrPs appeared as focal, hypoechoic regions on 2D US, indicating local changes in tissue echogenicity, and as focal regions of reduced vibration amplitude on VSE, indicating a localized stiff nodule. MTrPs were elliptical in shape, with a size of 0.16 ± 0.11 cm2. There were no significant differences in size between A-MTrPs and L-MTrPs. Sites containing MTrPs were more likely to have higher TIS compared to normal myofascial tissue (p<0.002). Small arteries (or enlarged arterioles) near A-MTrPs showed retrograde flow in diastole indicating a highly resistive vascular bed. A-MTrP sites were more likely to have higher BFS compared to L-MTrPs (p<0.021).
Conclusions
Preliminary findings show that, under the conditions of this investigation, US imaging techniques can be used to distinguish myofascial tissue containing MTrPs from normal myofascial tissue (lacking trigger points). Ultrasound enables visualization and some characterization of MTrPs and adjacent soft tissue.
Keywords: Ultrasonography, Sonoelastography, Rehabilitation, Myofascial Pain Syndromes, Trigger Points, Myofascia
Introduction
Chronic pain is a critical public health problem1.A vast number of patients in specialty pain management centers and 95% of people with chronic pain disorders suffer from Myofascial Pain Syndrome (MPS)2. MPS is a common, non-articular musculoskeletal disorder, characterized by myofascial trigger points (MTrPs) – hard, palpable, discrete, localized nodules located within taut bands of skeletal muscle and painful on compression. MTrPs can be either active or latent3. An active MTrP (A-MTrP) is associated with spontaneous pain in which pain is present without palpation. This spontaneous pain can be at the site of the MTrP or remote from it. However, firm palpation of the A-MTrP increases pain locally and usually reproduces the subject’s remote pain4. A latent MTrP (L-MTrP) is not associated with spontaneous pain, although pain can often be elicited in an asymptomatic subject by a mechanical stimulus such as finger pressure over the L-MTrP5. In someone with a spontaneous pain complaint, thorough palpation of the myofascial tissue is required to identify and differentiate an A-MTrP from a L-MTrP. Pain elicited by palpation of an L-MTrP in a symptomatic subject is qualitatively different from the subject’s pain complaint.
Despite the high prevalence of MPS1, 2, 6–9, its pathophysiology is unclear. We do not know if the nodules are a result of ongoing anatomical and physiological abnormalities, or if they occur independently of other abnormalities in surrounding soft tissue. The current diagnostic standard for myofascial pain is based on palpation for the presence of trigger points in a taut band of skeletal muscle and an associated symptom cluster that includes referred pain patterns3. Unfortunately, few physicians receive training in the clinical diagnosis of myofascial pain. Moreover, the physical examination has been reported to be unreliable10, and until recently, there has been no clearly demonstrable underlying pathology associated with the physical findings of trigger points and taut bands11–15.
Current approaches for pain relief involve needling (with or without injection) and massage therapy. The lack of objective clinical outcome measures has been a barrier for critically evaluating the efficacy of these therapeutic methods. All of these factors have led to a lack of consensus on myofascial pain as a clinical entity and have contributed to the uncertainty about the pathogenesis and pathophysiology of trigger points16. Therefore, there is a need to develop objective, repeatable and reliable diagnostic tests for evaluation and treatment outcome measures for MTrPs. Such measures can be used to properly diagnose and understand the natural history of MTrPs and to determine the underlying mechanisms relevant to the development and resolution of myofascial pain.
Diagnostic ultrasound (US) is used extensively for non-invasive real-time imaging of muscle, tendon, fascia, blood vessels and other soft tissues and is suitable for use in a medical office setting. US has the potential to characterize viscoelastic properties of myofascial tissue15, to quantify hemodynamic changes due to compression of blood vessels, to provide dynamic measures of tissue performance (e.g. muscle contraction), and to demonstrate structure/function correlations17–19. US is a low-risk method for obtaining descriptive information of tissue (e.g. presence of fat, fiber, fluid) and its mechanical properties20, 21. To the best of our knowledge, Doppler US, which is routinely used clinically for vascular applications, has not been used to study MTrPs. Vibration sonoelastography (VSE) has been validated as a method to image palpably stiff nodules in tissue22. When an external vibration stimulus is applied, any localized regions of stiffer tissue vibrate with lower amplitude compared to less stiff surrounding tissue23. The US color variance mode can be used to image the relative distribution of vibration amplitude in the myofascial tissue and identify any localized regions of stiffness. Several studies have demonstrated the feasibility of VSE. Transient VSE has been used to quantify the anisotropic properties of muscle and to measure the shear elastic moduli of relaxed and contracted states of both the quadriceps24 and biceps brachii25 muscles. Magnetic resonance elastography has been used for investigating taut bands13.
In this study, we investigated the feasibility of US imaging for visualizing trigger points and surrounding soft tissue. We believe that US imaging techniques will be capable of distinguishing MTrPs and adjacent structures from normal myofascial tissue and will provide objective descriptions of the underlying tissue abnormalities associated with MTrPs, which may help decipher the pathophysiology and the pathogenesis of painful MTrPs.
Methods
Study Population
This descriptive study was carried out at the Rehabilitation Medicine Department of the National Institutes of Health, Clinical Research Center. Subjects with acute cervical pain (< 3 months duration) were eligible and met inclusion criteria if found to have an A-MTrP in one or both upper trapezii. All subjects underwent a thorough musculoskeletal evaluation so as to rule out potential causes of their symptoms other than MTrPs. The exclusion criteria were: subjects with muscle pain due to fibromyalgia, atypical facial neuralgia and history of myopathy; neck and shoulder conditions including cervical radiculopathy, lumbosacral myopathy, history of cervical spine or shoulder surgery and history of trigger point injections in the upper trapezius; and subjects with cancer or HEENT infections. Based on their history and physical findings in the upper trapezius muscles, 9 subjects were diagnosed with myofascial pain and recruited. All but two had unilateral pain symptoms. The Institutional Review Board of the National Institute of Dental and Craniofacial Research approved this study, and each participant provided informed consent to participate in the study.
Clinical Examination
Subjects underwent a physical examination by an experienced physiatrist (JPS), who determined the presence or absence of MTrPs in the upper trapezius muscle according to the standard clinical criteria defined by Travell and Simons3. In this study any local region of myofascial tissue in which nodules were absent to palpation was defined as “normal” or uninvolved.
For our design we sought to identify 2 sites per side on each subject including a variety of A-MTrP, L-MTrP, and normal sites. Each subject was to have at least one normal site among the 4. Palpation was in the central region of the upper trapezius muscle within 6 cm of the muscle’s midline (approximately mid-way between the cervical vertebrae and the acromion process). Up to 2 nodules were found by the examiner in each upper trapezius and identified as either an A-MTrP or L-MTrP. If less than 2 nodules were identified, palpation continued until the examiner was satisfied that only one nodule or none was present in the muscle. The examiner then marked “dummy” sites in the same general vicinity as the nodules and recorded them as “normal.” This process resulted in 2 marked sites on each upper trapezius (4 total per subject). Pressure algometrya was performed on each of the four sites to determine the pain pressure threshold (PPT), i.e. the amount of pressure that produces the sensation of pain. Only the examiner knew the clinical status and classifications of the marked sites; i.e., the sonography team (SS, TG) was blinded to clinical status, algometry results, and identity of all sites. Approximately 30 min elapsed between PPT procedures and sonography.
Gray Scale Imaging
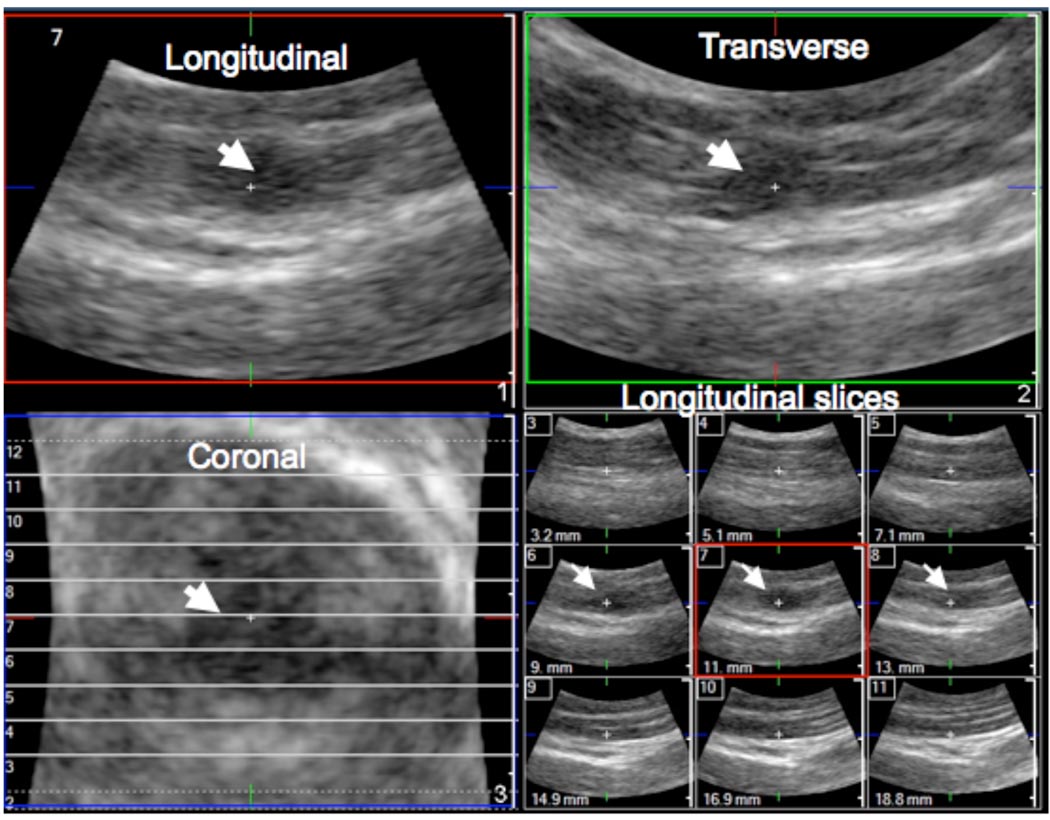
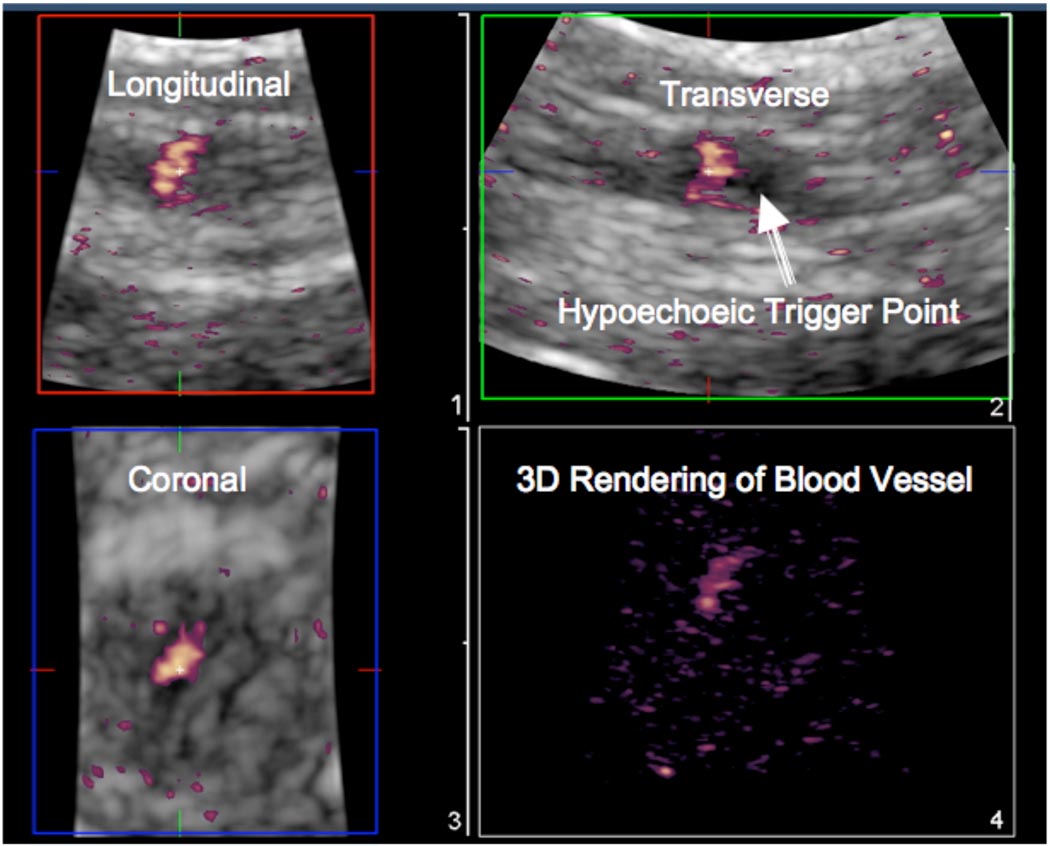
Each participant underwent an US examination using a Philips iU22b clinical US system with a 12-5 MHz linear array L12-5 transducer targeted at the four sites palpated during the clinical examination. An experienced sonographer (with more than 18 years of experience) performed all US examinations. The upper trapezius was visualized in the longitudinal and transverse views with the subject sitting upright in a comfortable position. On 2D grayscale imaging, MTrPs in the upper trapezius appeared as focal hypoechoic (darker) areas with heterogeneous echotexture. Because a single 2D image did not fully capture the 3D area of the trigger point and surrounding soft tissue, 3D imaging was also performed by manually sweeping the transducer over the upper trapezius along the transverse and longitudinal planes. A mechanically-scanned 9-3 MHz 3D transducer (3D9-3v) was used for real-time 3D imaging of trigger points in the upper trapezius of the subjects.
Elastography Imaging
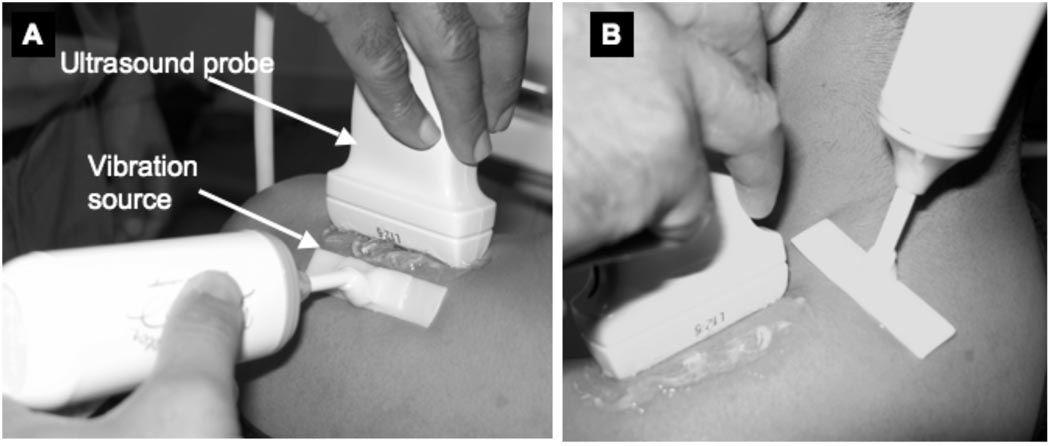
Ultrasound vibration sonoelastography (VSE) utilizes an external vibration source <1000 Hz in conjunction with Doppler techniques to identify localized regions of increased tissue stiffness. This methodology has been described in detail elsewhere22. In this study vibrations were induced in the upper trapezius muscle using an external hand-held vibrating massager (model NC70209c) modified with a flat attachment head (Figure 1). This vibration source was placed approximately 2–3 cm from each of the four sites to be imaged. Color variance mode was then used to image the site while the massager induced vibrations of ~92 Hz in the muscle.
Figure 1.
Design for a vibration source that can be used for vibration sonoelastography imaging of the upper trapezius. This design can induce vibrations uniformly over a broad area both along the muscle fibers (A) and transverse to the muscle fibers (B).
Doppler Imaging
We investigated circulation at the sites of A-MTrPs, L-MTrPs and within normal myofascial tissue by using Doppler US to image blood vessels. The peak systolic velocity and the minimum diastolic velocity blood flow velocities were measured in the ascending branch of the transverse cervical artery and any other arteries or enlarged arterioles that were found in the neighborhood of palpable trigger points. The resistive index, RI, is commonly used for vascular diagnosis, and is defined as the ratio of the difference in peak systolic and minimum diastolic velocities to the peak systolic velocity, and is an indication of the resistance of the end-organ vascular bed. In muscle, normally RI=1, indicating no diastolic flow. Elevated diastolic flow (RI<1) indicates decreased vascular bed resistance, while negative diastolic flow (RI<1) indicates increased vascular bed resistance.
Ordinal Imaging Score
Two ordinal scores were devised to describe tissue and blood flow characteristics of the imaged sites. The tissue imaging score (TIS), based on gray-scale and elastography imaging, was given a range from 0 (normal, uniform echogenicity and stiffness) to 2 (abnormal structure with multiple focal hypoechoic and stiff nodules). The blood flow waveform score (BFS), based on the Doppler flow waveform, was given a range from 0 (normal arterial flow) to 2 (abnormal high resistance flow with retrograde diastolic flow). Table 2 lists the scoring criteria.
Two investigators (TG and SS) independently quantified the size of the MTrPs from the acquired US images. An ellipse was manually fitted to the most prominent MTrP and the area was computed using the measurement tool available on the ultrasound scanner.
Statistical Analysis
Pain pressure thresholds (PPTs) were compared among sites containing A-MTrPs, L-MTrPs, and normal myofascial tissue using t-tests subject to Bonferroni correction. The nonparametric Kruskall-Wallis test was used to compare the tissue imaging score (TIS) and the blood flow score (BFS) among sites containing A-MTrPs, L-MTrPs, and normal myofascial tissue. Pearson’s correlation coefficient was used to assess the inter-rater reliability of the MTrP size measurement. For all tests, p<0.05 was considered significant.
Results
The age range of the 9 subjects (2 men and 7 women) was 23–55 years. Ultrasound data were acquired from 33 sites in the upper trapezius of the 9 subjects (2 sites in one subject and 1 site in another subject could not be imaged due to scheduling restrictions). Based on the physical examination, 13 sites were classified as A-MTrPs, 6 sites were classified as L-MTrPs and 14 sites were classified as normal. 11 of the 13 A-MTrPs, 5 of the 6 L-MTrPs and 1 of the 14 normal sites were found at a more medial location on the upper trapezius (relative to the midline of the body), while the rest were found at a more lateral location. Pressure algometry was performed at 30 of these sites (algometry was not performed in one patient).
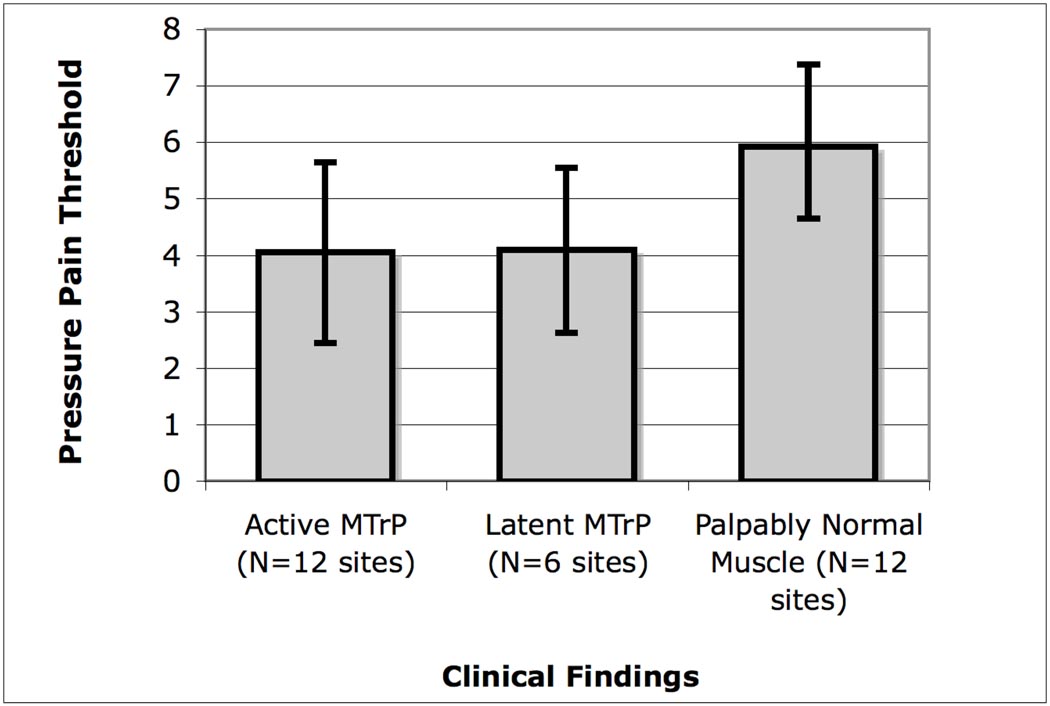
PPTs determined using pressure algometry showed that sites with A- and L-MTrPs had a significantly lower threshold compared to palpably normal sites (p<0.01) (Figure 2). The pressure pain thresholds were not significantly different between A-MTrPs and L-MTrPs.
Figure 2.
Pain pressure thresholds (PPTs, in lb) measured using pressure algometry demonstrated lower thresholds in active and latent MTrPs compared to palpably normal muscle (N>A,L; p<0.007). The error bars correspond to standard deviations.
On ultrasound imaging, MTrPs in the upper trapezius muscle appeared as elliptically-shaped focal areas of hypoechogenecity that corresponded with the location of the palpable nodule in all the subjects examined (Figure 3A). The size of MTrPs was 0.16 ± 0.11 cm2 (mean ± standard deviation for both examiners and for all subjects). In our images, trigger points often appear to co-exist with multiple nodules in close proximity (Figure 3B). There were no significant differences in size between A-MTrPs (0.16 ± 0.11 cm2) and L-MTrPs (0.15 ± 0.13 cm2). There was good agreement between the examiners (Pearson’s r = 0.78, p<0.001, excluding one outlying case where the first examiner identified a single large MTrP, while the second examiner identified two smaller MTrPs).
Figure 3.
Gray scale imaging of a trigger point in the upper trapezius. (A) An isolated MTrP appears as a well-defined focal hypoechoic nodule. (B) A series of four hypoechoic MTrPs in the upper trapezius.
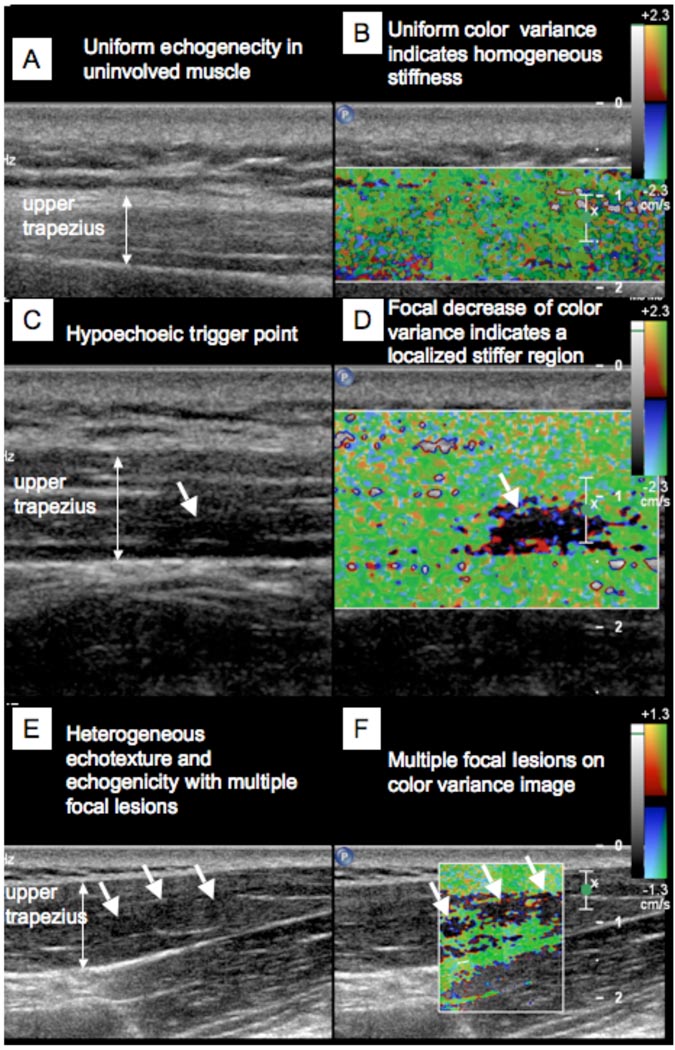
In 3D imaging, the discrete trigger point was clearly visible in the longitudinal, transverse and coronal images (Figure 4). The echotexture in the nodule was heterogeneous and markedly different from a control area in the upper trapezius muscle found to be palpably normal on physical examination. The palpably normal tissue appeared isoechoic with homogeneous echotexture (compare Figures 5(A) and (C)).
Figure 4.
3D imaging of trigger points. A mechanically-scanned 3D probe (3D9-3v) was used for 3D imaging in a subject with a latent trigger point. The MTrP is clearly identified (arrows) in all three planes as well as in a multi-slice view.
Figure 5.
Simultaneous 2D grayscale and color variance imaging. (A and B) Normal upper trapezius muscle. The normal muscle appears isoechoic and has uniform color variance (TIS=0). (C and D) Muscle with a palpable MTrP. A hypoechoic region and a well-defined focal decrease of color variance indicating a localized stiffer region is visible (TIS=1). (E and F) Muscle with a palpable MTrP. Multiple hypoechoic regions and multiple focal nodules are visible (TIS=2).
On color variance imaging, MTrPs appeared as focal areas of reduced vibration amplitude. Figure 5(D) shows the color variance image of the upper trapezius muscle with a palpable MTrP indicated by an arrow. The area of reduced vibration amplitude corresponds with the hypoechoic regions observed on 2D gray scale imaging for all subjects. Figure 5(B) shows the color variance image of the upper trapezius muscle that was normal on physical examination. The entire region of the muscle appears to vibrate with approximately uniform amplitude, as indicated by the uniform color. In some regions single, well-defined, nodules were apparent, and, in some, multiple focal nodules could be observed (Figures 5(E), 5(F)).
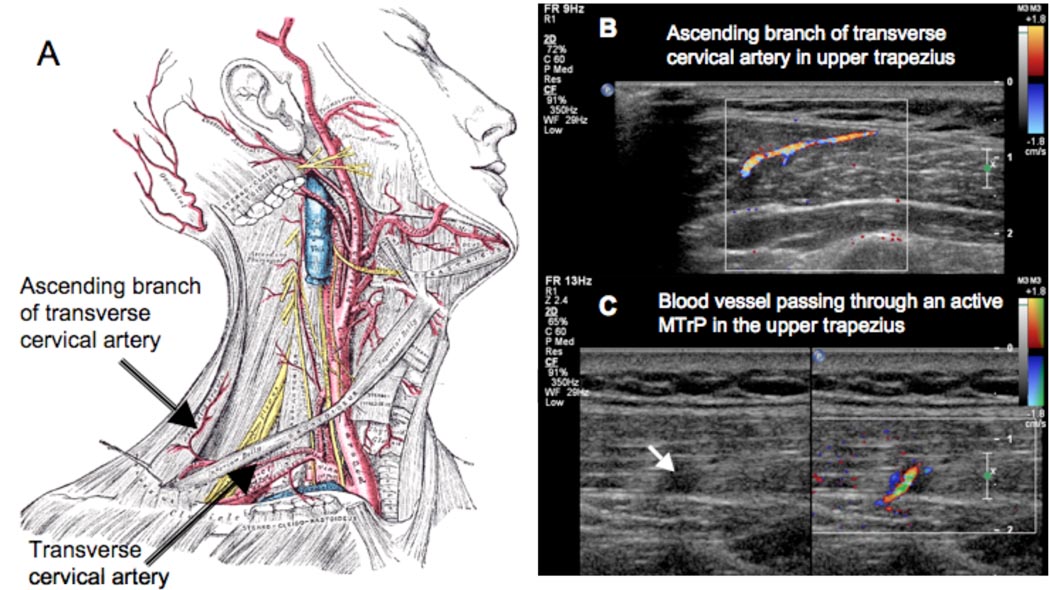
Color Doppler and duplex Doppler examination of the upper trapezius in our subject sample revealed differences between A- and L-MTrPs. Prominent blood vessels were found at 27 of the 33 sites. In some cases, the blood vessel passed directly through a trigger point (Figure 6 and 7). In 9 out of 13 sites (69%) with A-MTrPs, we observed unique Doppler flow waveform (Figure 8(A)) with retrograde diastolic flow. Intriguingly, retrograde diastolic flow was observed in only 1 out of 6 sites (16.7%) with an L-MTrP. Only one palpably normal site out of 14 (7%) showed sustained retrograde diastolic flow. This site was adjacent to a site with an A-MTrP.
Figure 6.
3D color Doppler imaging of blood vessels passing through trigger points. A mechanically-scanned 3D probe (3D9-3v) was used for 3D imaging in a subject with a latent trigger point. The blood vessel is clearly visualized in all three planes.
Figure 7.
(A) The main blood supply to the upper trapezius is through the ascending branch of the transverse cervical artery. (B) The ascending branch can be visualized using color Doppler imaging. The blood flow waveform in the ascending branch or other branches arising from this vessel can provide an indication of the flow resistance in the perfused tissue. (C) A blood vessel passing through an active MTrP.
Figure 8.
(A) Subject with an active (symptomatic) MTrP visible as a hypoechoic region on the grayscale image, and an artery running through the MTrP visible on color Doppler (the Doppler sample volume is placed inside the MTrP). High-resistance blood flow waveform with retrograde diastolic flow was observed in the artery. (B) The same subject had a latent (non-symptomatic) MTrP on the contralateral side with an artery running through it, which showed elevated diastolic flow but no retrograde diastolic flow. (C) Four waveform shapes observed in our studies. C.1 shows arterial flow in muscle with no diastolic flow (BFS=0). C.2 shows elevated flow in diastole (BFS=1). C.3 shows oscillatory high-resistance flow with retrograde flow in early diastole (BFS=2). C.4 shows sustained retrograde flow in diastole (BFS=2).
To quantify these findings, we utilized a composite ordinal scoring system with the variables TIS and BFS as shown in Table 1. The number of sites and their scores based on ultrasound imaging for active, latent and normal sites in the upper trapezius muscle are shown in Figure 9. Palpable trigger points identified on physical examination had a significantly higher tissue imaging score (TIS) compared to normal myofascial tissue (p<0.002 using the nonparametric Kruskall-Wallis test), indicating that the imaging findings correlated with the physical finding. TIS was not significantly different between A-MTrPs and L-MTrPs. However, A-MTrPs had a significantly higher blood flow waveform score (BFS) compared to L-MTrPs in the upper trapezius (p<0.021, Kruskall-Wallis), indicating that A-MTrPs are associated with blood flow abnormalities. BFS was not significantly different between L-MTrPs and normal sites.
Table 1.
Ordinal Imaging Scores
| Tissue Imaging Score (TIS) | Blood Flow Waveform Score (BFS) | ||
|---|---|---|---|
| Score | Criterion | Score | Criterion |
| 0 | No focal lesion on echo or stiffness image (includes heterogeneity) |
0 | Normal muscle flow, no visible blood vessel (Resistive index, RI*=1) |
| 1 | Evidence of focal lesion on both echo and stiffness image |
1 | Elevated blood flow in diastole (Resistive index, RI<1) |
| 2 | Multiple focal lesions or marked heterogeneity on both echo and stiffness image |
2 | Oscillatory flow or sustained retrograde flow in diastole (Resistive index, RI>1) |
RI = Resistive Index, see text for definition
Figure 9.
Distribution of scores based on ultrasound imaging for active, latent and normal sites in upper trapezius muscle. Muscle with palpable trigger points on clinical exam (either active or latent) had a significantly higher tissue imaging score (TIS) compared to palpably normal muscle (p<0.002). 100% of A- and L-MTrPs had a TIS =1 or 2, compared to 36% of normal sites. Active trigger points had a significantly higher blood flow waveform score (BFS) compared to latent trigger points (p<0.029). 69% of active sites had a BFS=2 compared to 16.7% of latent sites.
Discussion
This study was undertaken to determine whether a non-invasive, easily accessible and relatively inexpensive technology could be used to characterize MTrPs. Our preliminary findings indicate that palpable nodules (identified as either A- or L-MTrPs) appear as one or more focal nodules on grayscale and color variance US imaging and are absent in palpably normal myofascial tissue. Some hypoechoic regions were observed even when nodules were not palpable. We did not investigate the ultrasonic characteristics of taut bands in this study. A- and L-MTrPs demonstrated different and distinct blood flow waveform patterns. Significantly more A-MTrPs than L-MTrPs were associated with retrograde flow in diastole, which would be indicative of a highly resistive vascular bed.
The A-MTrP has two clinical attributes that must be investigated in order to elucidate the pathogenesis and pathophysiology of myofascial pain. One attribute is a motor dysfunction of the myofascial tissue characterized by a constant, discrete hardness, usually palpable as a nodularity in a taut band within the belly of the muscle. The other attribute is a sensory abnormality characterized primarily by tenderness and spontaneous pain, which can be localized to the immediate area of the nodularity/taut band, or be distant from it and referred to another part of the body.
Several promising lines of scientific study (i.e. histological, neurophysiological, biochemical, and somatosensory) have attempted to explain the pathophysiological basis of these clinical attributes11, 12, 26–30. Findings from these studies support Simons’ Integrated Hypothesis, which postulates that an “energy crisis” perpetuates an initial sustained sarcomere contracture, which leads to increased local metabolic demands in the presence of compromised capillary circulation.
This leads to local hypoxia and/or tissue damage. Shah et al. found and confirmed the presence of elevated levels of inflammatory mediators, catecholamines, neuropeptides and pro-inflammatory cytokines in the vicinity of A-MTrPs11, 12. These biochemicals are known to be associated with persistent pain states, myofascial tenderness, intercellular signalling and inflammation. These attributes may help explain the sensory abnormalities associated with A-MTrPs31.
Results of 2D US imaging confirms that significant tissue abnormalities and morphological changes are associated with MTrPs. Differences in echogenicity and stiffness of the MTrP compared to the surrounding tissue suggest a disruption of normal muscle fiber structure and a change in local tissue characteristics. The hypoechoic and stiffer nodules may be indicative of contraction knots resulting from increased muscle fiber contraction and recruitment, local injury and/or localized regions of ischemia. To date, we know of only one other study that attempted to objectively characterize the physical features of MTrPs. In this study by Chen et al. 32, Magnetic Resonance Elastography (MRE) was used to measure the viscoelastic properties of skeletal muscle. MRE uses a modified gradient echo pulse sequence to image the propagation of induced vibration shear waves. Although they were able to demonstrate that the shear wave propagation pattern in a taut band of the upper trapezius differs from palpably normal myofascial tissue, the MTrP itself was not identified within the taut band. Imaging ultrasound may be a better method to localize the MTrP, while simultaneously investigating the neighboring tissue structure and vasculature. 2D ultrasound combined with VSE provides both visual imaging and objective measurements of the physical characteristics and mechanical properties of the MTrP. We believe that this novel application of imaging US will provide significant methodological improvement over MRE, enabling cost-effective imaging and longitudinal monitoring of MTrPs in an office-based setting. Using a transient vibration source, the velocity of the propagating shear wave could be measured using ultrasound, which would allow further quantification of the tissue stiffness24. Ultrasound provides new and exciting possibilities for identifying physical characteristics of MTrPs on human subjects in vivo, non-invasively and at low cost.
Another advantage of imaging US is the ability to investigate the vasculature and blood flow characteristics in and around MTrPs. Results of our blood flow investigation associate blood flow disturbances with the pathophysiology of MTrPs. Doppler flow waveforms of arteries in the neighborhood of MTrPs showed high-resistance blood flow with retrograde diastolic flow in the region of the A-MTrPs, which differed from the blood flow around L-MTrPs and normal uninvolved myofascial tissue. An increase in vascular resistance in A-MTrPs is consistent with blood vessel compression due to sustained contracture at a trigger point or constriction due to oxidative stress or hypoxia. The blood vessel compression may be sufficient to cause the local hypoperfusion, hypoxia, and other pathophysiological developments leading to the pain, tenderness and nodularity of an A-MTrP.
Jarvholm, et al.33 found that high intramuscular pressure in the supraspinatus muscle significantly impeded local muscle blood flow, which would lead to hypoperfusion and local ischemia. Measurements of the pO2 in myogeloses (which presumably are accumulations of several MTrPs) showed that the pO2 is extremely low (close to zero) at the center of a MTrP area34. The low pO2 is likely to be associated with a lack of ATP, a condition that may contribute to the local hypercontractions (contractures) found in this area. ATP is needed to break the bonds between the myofilaments and to end the muscle contraction. The available data on myofascial pain suggest that, in fact, pain associated with A-MTrPs may be caused indirectly by decreased blood flow to the MTrP. The hypoperfusion may lead to the observed low pO2 and the contractures. A low pO2 is known to be a powerful factor for the release of bradykinin, which is a sensitizing agent for muscle nociceptors.
The ultrasound techniques presented in this paper can be used to identify anatomical and physiological abnormalities associated with MTrPs. Identification of abnormalities, and their characterizations, will help establish objective, diagnostic criteria, which would be expected to be more reliable, sensitive and specific than physical examination alone. Changes in these objective measures in response to treatment, such as alteration in the blood flow and/or change in the size, appearance or stiffness of trigger points, could then be used as treatment outcome measures. Further studies will be needed to confirm these findings and their clinical usefulness.
Limitations
We believe that our observations of echogenicity, stiffness and blood flow may enable differentiation of A-MTrPs from L-MTrPs through ultrasound visualization. However, this study is exploratory and descriptive, and the findings are from a small number of subjects. Therefore, universal generalization to MPS and MTrPs is premature.
In addition, there are some technical difficulties, which we are currently addressing. For example, the operator technique (amount of pressure and the angle at which the US transducer head is held to scan the tissue) is difficult to control. We are attempting to standardize the scan technique for future investigations. While our methodology was designed to keep the sonography team blinded to the clinical findings, unintentional bias cannot be ruled out because the nodules were readily visualized on imaging. Our study did not include a control group of pain-free subjects. All but two subjects had unilateral symptoms and the contralateral side in the same subject was used as the control. However, some bias due to the anatomical location of the MTrPs cannot be ruled out. Finally, inter- and intra-observer variabilities were not assessed in this feasibility study. Nonetheless, we believe that the reported findings expand the understanding of MTrPs and bring us closer towards a model of the pathophysiology of the MTrP and its surrounding milieu.
Conclusion
Under the conditions of this investigation, gray scale echogenicity or color variance imaging based on relative stiffness were used to differentiate palpable nodules in soft tissue (either active or latent) from normal myofascial tissue, and blood flow waveform characteristics were used to differentiate between A- and L-MTrPs. Our preliminary findings show that ultrasound, a convenient, accessible and low-risk technique, can be a useful method for differentiating MTrPs from surrounding tissue.
Acknowledgments
Supported by the Intramural Research Program, National Institutes of Health (NIH), the Clinical Center and Office of the Director, NIH
List of Abbreviations
- A-MTrP
Active myofascial trigger point
- BFS
Blood flow score
- HEENT
Head eye ear nose and throat
- L-MTrP
Latent myofascial trigger point
- MPS
Myofascial pain syndrome
- MRE
Magnetic resonance elastography
- MTrP
Myofascial trigger point
- PPT
Pain pressure threshold
- RI
Resistive index
- TIS
Tissue imaging score
- US
Ultrasound imaging
- VSE
Vibration sonoelastography
Footnotes
Preliminary results were presented at the 30th Annual International Conference of the IEEE Engineering in Medicine and Biology Society, August 20–24, 2008, and at the 69th Annual Assembly of the AAPMR, November 20–23, 2008.
- Pain Diagnostics and Thermography, 233 E Shore Rd, Ste 108, Great Neck, NY 11023-2433.
- Philips Healthcare USA, 22100 Bothell Everett Highway, Bothell, WA 98021-8431.
- North Coast Medical, Inc., 18305 Sutter Boulevard, Morgan Hill, CA 95037-2845.
References
- 1.Gerwin RD. Classification, epidemiology, and natural history of myofascial pain syndrome. Curr Pain Headache Rep. 2001;5(5):412–420. doi: 10.1007/s11916-001-0052-8. [DOI] [PubMed] [Google Scholar]
- 2.Fishbain DA, Goldberg M, Meagher BR, Steele R, Rosomoff H. Male and female chronic pain patients categorized by DSM-III psychiatric diagnostic criteria. Pain. 1986;26(2):181–197. doi: 10.1016/0304-3959(86)90074-6. [DOI] [PubMed] [Google Scholar]
- 3.Simons DG, Travell JG, Simons PT. Travell and Simons' Myofascial Pain and Dysfunction: The Trigger Point Manual. Vol 1. Upper Half of Body. 2nd ed. Baltimore: Williams and Wilkins; 1999. [Google Scholar]
- 4.Fernandez-de-Las-Penas C, Simons D, Cuadrado ML, Pareja J. The role of myofascial trigger points in musculoskeletal pain syndromes of the head and neck. Curr Pain Headache Rep. 2007;11(5):365–372. doi: 10.1007/s11916-007-0219-z. [DOI] [PubMed] [Google Scholar]
- 5.Lucas KR. The impact of latent trigger points on regional muscle function. Curr Pain Headache Rep. 2008;12(5):344–349. doi: 10.1007/s11916-008-0058-6. [DOI] [PubMed] [Google Scholar]
- 6.Fernandez-de-Las-Penas C, Alonso-Blanco C, Cuadrado ML, Gerwin RD, Pareja JA. Myofascial trigger points and their relationship to headache clinical parameters in chronic tension-type headache. Headache. 2006;46(8):1264–1272. doi: 10.1111/j.1526-4610.2006.00440.x. [DOI] [PubMed] [Google Scholar]
- 7.Rosomoff HL, Fishbain DA, Goldberg M, Santana R, Rosomoff RS. Physical findings in patients with chronic intractable benign pain of the neck and/or back. Pain. 1989;37(3):279–287. doi: 10.1016/0304-3959(89)90192-9. [DOI] [PubMed] [Google Scholar]
- 8.Calandre EP, Hidalgo J, Garcia-Leiva JM, Rico-Villademoros F. Trigger point evaluation in migraine patients: an indication of peripheral sensitization linked to migraine predisposition? Eur J Neurol. 2006;13(3):244–249. doi: 10.1111/j.1468-1331.2006.01181.x. [DOI] [PubMed] [Google Scholar]
- 9.Skootsky SA, Jaeger B, Oye RK. Prevalence of myofascial pain in general internal medicine practice. West J Med. 1989;151(2):157–160. [PMC free article] [PubMed] [Google Scholar]
- 10.Hsieh CY, Hong CZ, Adams AH, Platt KJ, Danielson CD, Hoehler FK, et al. Interexaminer reliability of the palpation of trigger points in the trunk and lower limb muscles. Arch Phys Med Rehabil. 2000;81(3):258–264. doi: 10.1016/s0003-9993(00)90068-6. [DOI] [PubMed] [Google Scholar]
- 11.Shah JP, Danoff JV, Desai MJ, Parikh S, Nakamura LY, Phillips TM, et al. Biochemicals associated with pain and inflammation are elevated in sites near to and remote from active myofascial trigger points. Arch Phys Med Rehabil. 2008;89(1):16–23. doi: 10.1016/j.apmr.2007.10.018. [DOI] [PubMed] [Google Scholar]
- 12.Shah JP, Phillips TM, Danoff JV, Gerber LH. An in vivo microanalytical technique for measuring the local biochemical milieu of human skeletal muscle. J Appl Physiol. 2005;99(5):1977–1984. doi: 10.1152/japplphysiol.00419.2005. [DOI] [PubMed] [Google Scholar]
- 13.Chen Q, Bensamoun S, Basford JR, Thompson JM, An KN. Identification and quantification of myofascial taut bands with magnetic resonance elastography. Arch Phys Med Rehabil. 2007;88(12):1658–1661. doi: 10.1016/j.apmr.2007.07.020. [DOI] [PubMed] [Google Scholar]
- 14.Simons DG. New views of myofascial trigger points: etiology and diagnosis. Arch Phys Med Rehabil. 2008;89(1):157–159. doi: 10.1016/j.apmr.2007.11.016. [DOI] [PubMed] [Google Scholar]
- 15.Sikdar S, Shah JP, Gilliams E, Gebreab T, Gerber LH. Assessment of myofascial trigger points (MTrPs): A new application of ultrasound imaging and vibration sonoelastography. Conf Proc IEEE Eng Med Biol Soc. 2008;1:5585–5589. doi: 10.1109/IEMBS.2008.4650480. [DOI] [PubMed] [Google Scholar]
- 16.Wheeler AH. Myofascial pain disorders: theory to therapy. Drugs. 2004;64(1):45–62. doi: 10.2165/00003495-200464010-00004. [DOI] [PubMed] [Google Scholar]
- 17.Chi-Fishman G HJ, Cintas HM, Sonies BC, Gerber LH. Ultrasound imaging distinguishes between normal and weak muscle. Arch Phys Med Rehabil. 2004;85(6):980–986. doi: 10.1016/j.apmr.2003.07.008. [DOI] [PubMed] [Google Scholar]
- 18.Hicks JE ST, Jones BL, Linzer RT, Gerber LH. Diagnostic Ultrasound: Its Use in the Evaluation of Muscle. Archives of Physical Medicine Rehabilitation. 1984;65:129–131. [PubMed] [Google Scholar]
- 19.Saltzstein RJ DJ, Shawker TH, Jones BL, Gerber L. Ultrasound Sector Scanning Used to Define Changes in Muscle Configuration. Scandinavian Journal on Rehabilitation Medicine. 1989;21:209–212. [PubMed] [Google Scholar]
- 20.Sikdar S, Beach KW, Vaezy S, Kim Y. Ultrasonic technique for imaging tissue vibrations: preliminary results. Ultrasound Med Biol. 2005;31(2):221–232. doi: 10.1016/j.ultrasmedbio.2004.10.003. [DOI] [PubMed] [Google Scholar]
- 21.Shamdasani V, Bae U, Sikdar S, Yoo YM, Karadayi K, Managuli R, et al. Research interface on a programmable ultrasound scanner. Ultrasonics. 2008;48(3):159–168. doi: 10.1016/j.ultras.2007.11.009. [DOI] [PubMed] [Google Scholar]
- 22.Taylor LS, Porter BC, Rubens DJ, Parker KJ. Three-dimensional sonoelastography: principles and practices. Phys Med Biol. 2000;45(6):1477–1494. doi: 10.1088/0031-9155/45/6/306. [DOI] [PubMed] [Google Scholar]
- 23.Gao L, Parker KJ, Alam SK, Lernel RM. Sonoelasticity imaging: theory and experimental verification. J Acoust Soc Am. 1995;97(6):3875–3886. doi: 10.1121/1.412399. [DOI] [PubMed] [Google Scholar]
- 24.Levinson SF, Shinagawa M, Sato T. Sonoelastic determination of human skeletal muscle elasticity. J Biomech. 1995;28(10):1145–1154. doi: 10.1016/0021-9290(94)00173-2. [DOI] [PubMed] [Google Scholar]
- 25.Gennisson JL, Cornu C, Catheline S, Fink M, Portero P. Human muscle hardness assessment during incremental isometric contraction using transient elastography. J Biomech. 2005;38(7):1543–1550. doi: 10.1016/j.jbiomech.2004.07.013. [DOI] [PubMed] [Google Scholar]
- 26.Mense S, Simons DG, Hoheisel U, Quenzer B. Lesions of rat skeletal muscle after local block of acetylcholinesterase and neuromuscular stimulation. J Appl Physiol. 2003;94(6):2494–2501. doi: 10.1152/japplphysiol.00727.2002. [DOI] [PubMed] [Google Scholar]
- 27.Reitinger A, Radner H, Tilscher H, Hanna M, Windisch A, Feigl W. Morphologische Untersuchung an Triggerpunkten. Manuelle Medizin. 1996;34:256–262. [Google Scholar]
- 28.Windisch A, Reitinger A, Traxler H, Radner H, Neumayer C, Feigl W, et al. Morphology and histochemistry of myogelosis. Clin Anat. 1999;12(4):266–271. doi: 10.1002/(SICI)1098-2353(1999)12:4<266::AID-CA5>3.0.CO;2-G. [DOI] [PubMed] [Google Scholar]
- 29.Kuan TS, Hsieh YL, Chen SM, Chen JT, Yen WC, Hong CZ. The myofascial trigger point region: correlation between the degree of irritability and the prevalence of endplate noise. Am J Phys Med Rehabil. 2007;86(3):183–189. doi: 10.1097/PHM.0b013e3180320ea7. [DOI] [PubMed] [Google Scholar]
- 30.Niddam DM, Chan RC, Lee SH, Yeh TC, Hsieh JC. Central modulation of pain evoked from myofascial trigger point. Clin J Pain. 2007 Jun;23(5):440–448. doi: 10.1097/AJP.0b013e318058accb. [DOI] [PubMed] [Google Scholar]
- 31.Shah JP, Gilliams EA. Uncovering the biochemical milieu of myofascial trigger points using in vivo microdialysis: an application of muscle pain concepts to myofascial pain syndrome. J Bodyw Mov Ther. 2008;12(4):371–384. doi: 10.1016/j.jbmt.2008.06.006. [DOI] [PubMed] [Google Scholar]
- 32.Chen Q, Basford J, An KN. Ability of magnetic resonance elastography to assess taut bands. Clin Biomech (Bristol, Avon) :2008. doi: 10.1016/j.clinbiomech.2007.12.002. [DOI] [PMC free article] [PubMed] [Google Scholar]
- 33.Jarvholm U, Styf J, Suurkula M, Herberts P. Intramuscular pressure and muscle blood flow in supraspinatus. Eur J Appl Physiol Occup Physiol. 1988;58(3):219–224. doi: 10.1007/BF00417252. [DOI] [PubMed] [Google Scholar]
- 34.Strobel ES, Krapf M, Suckfull M, Bruckle W, Fleckenstein W, Muller W. Tissue oxygen measurement and 31P magnetic resonance spectroscopy in patients with muscle tension and fibromyalgia. Rheumatol Int. 1997;16(5):175–180. doi: 10.1007/BF01330292. [DOI] [PubMed] [Google Scholar]


