

Summary
There is emerging evidence from healthy individuals, as well as direct and indirect evidence from psychiatric and neurological patients with disease-related hippocampal atrophy, linking the cortisol awakening response (CAR) to hippocampal volume. Type 2 diabetes mellitus (T2DM) is a metabolic disease that is also accompanied by hippocampal atrophy, and therefore can serve as a model for ascertaining the relationship between CAR and hippocampal volume. We contrasted a group of 18 individuals with T2DM with 12 matched controls on MRI-based hippocampal volume and salivary diurnal cortisol profile including CAR. Individuals with T2DM had smaller hippocampal volumes and exhibited a blunting of the CAR relative to controls, while diurnal cortisol was not affected. Across all subjects, fasting insulin and hippocampal volume were associated with the CAR, independent of diagnosis. Our findings support the hypothesis that hippocampal integrity is an important predictor of the CAR.
Keywords: Cortisol awakening response, Hippocampus, Hypothalamic, pituitary, adrenocortical axis, Type 2 diabetes mellitus, Insulin
1. Introduction
In recent years, the cortisol awakening response (CAR) has been increasingly used as an index of adrenocortical activity in psychiatric and non-psychiatric populations. The characteristics of the CAR are well-described; it represents a rise in cortisol of 50–75% with peak levels about 30 min post-wakeup (Clow et al., 2004). However, the underlying regulatory mechanisms for this post-wake-up response remain unclear. More is known about the impact of various factors, such as age, gender, oral contraceptive use, menstrual cycle phase, wake-up time, and smoking status on the CAR, but results have not been uniform. Briefly, increasing age has been associated with an attenuated CAR (Kudielka and Kirschbaum, 2003), albeit not consistently (Pruessner et al., 1997). There are some gender-based differences in CAR, with women maintaining higher cortisol levels after peak levels have been reached (Pruessner et al., 1997; Wuest et al., 2000; Schlotz et al., 2004). However, menstrual cycle phase and oral contraceptive use do not seem to impact the CAR (Kirschbaum et al., 1999). Findings with respect to the impact of wake-up time on CAR appear mixed, with earlier wake-up times correlating with a higher CAR in some (Kudielka and Kirschbaum, 2003; Federenko et al., 2004), but not all (Pruessner et al., 1997; Hucklebridge et al., 1999) studies. Similarly, smoking has been shown to either have no effect on the CAR (Pruessner et al., 1997) or result in an increased CAR (Badrick et al., 2007). Please see Fries et al. (in press) for a review on the CAR.
In addition to the above-mentioned factors associated with the CAR, in the last few years a link between hippocampal integrity and the CAR has been postulated. For example, among healthy individuals smaller hippocampal volume is associated with a reduced CAR (Pruessner et al., 2005, 2007). Furthermore, patients with selective hippocampal lesions (Buchanan et al., 2004) and patients with severe global amnesia caused by damage in the frontal and temporal lobes (Wolf et al., 2005) exhibit a blunted CAR. However, the study of hippocampal lesion patients failed to find a direct association between hippocampal volume (assessed with MRI) and the CAR, and the study of global amnesia patients did not assess hippocampal volumes.
In psychiatric conditions such as depression and PTSD, both hippocampal volume loss (Videbech and Ravnkilde, 2004; Smith, 2005) and blunting of the CAR (Rohleder et al., 2004; Huber et al., 2006) have been reported. However, none of these studies conducted both CAR and hippocampal volume assessments in the same set of study subjects, which does not allow any comment on possible associations. Nevertheless, by considering the results of studies in healthy individuals together with those of lesion populations and the indirect evidence among psychiatric populations, some authors have suggested that hippocampal integrity per se may be crucial for an intact CAR. However, it remains unclear how milder forms of hippocampal atrophy, as have been described in type 2 diabetes mellitus (T2DM), impact on the CAR.
T2DM is a metabolic disorder, characterized by insulin resistance and hyperglycemia (Quinn, 2002). Risk factors for developing T2DM include age (Panagiotakos et al., 2008), physical inactivity (Dyck et al., 2008), obesity (Ferrannini et al., 1997) and genetic predisposition (Busch and Hegele, 2001). T2DM is associated with lipid abnormalities (Goldberg and Capuzzi, 2001), hypertension (Bloomgarden, 2001) and impairments in cognition (Awad et al., 2004). Importantly, there are two studies in the literature reporting hippocampal volume loss in T2DM (den Heijer et al., 2003; Gold et al., 2007). Given the role of the hippocampus in HPA axis feedback regulation (Jacobson and Sapolsky, 1991) and the close link between cortisol and glucose metabolism (Khani and Tayek, 2001), it is not all that surprising there is also some indication for HPA axis disturbances in T2DM, although the order of events remains unclear. Both unstimulated plasma levels (Lee et al., 1999), as well as dexamethasone-suppressed cortisol levels (Bruehl et al., 2007) have been shown to be elevated in T2DM, although this has not been uniformly reported (Andrews et al., 2002). In addition, elevated evening free cortisol salivary levels have been observed in T2DM relative to controls (Liu et al., 2005). Therefore, the purpose of this study was to ascertain the CAR and diurnal salivary cortisol profile in T2DM and determine whether it is associated to hippocampal volume.
2. Methods and materials
2.1. Participants and procedure
30 volunteers (18 diabetics, 12 non-diabetic controls) participated in the study. They were referred by collaborating endocrinologists or responded to advertisements on the Internet. None had evidence of neurological, medical (except dyslipidemia, or hypertension), or psychiatric conditions. Head trauma, depression, and substance abuse were exclusion criteria. All participants came to our laboratory on 3 separate days and received a physical examination (see Bruehl et al., 2007) and an MRI scan of the brain. The study was approved by the local institutional board of research associates. All participants gave informed written consent. They were compensated for their participation and have not been included in prior reports. Group descriptors are shown in Table 1.
Table 1.
Description of subject groups (mean ± S.D.).
| Control group (n = 12) | T2DM group (n = 18) | |
|---|---|---|
| Age (year) | 62.97 ± 6.75 | 57.71 ± 8.17 |
| Gender (F/M) | 4/8 | 8/10 |
| Education (year) | 16.25 ± 1.60 | 14.60 ±.54 |
| Time from T2DM diagnosis (year) | n.a. | 5.92 ± 3.76 |
| BMI (kg/m2)* | 26.14 ± 5.29 | 33.63 ± 5.96 |
| Hypertension (%) | 50 | 76 |
| Glucose (mg/dl)* | 80.83 ± 8.86 | 136.06 ± 55.37 |
| Insulin* | 6.92 ± 3.32 | 19.57 ± 13.05 |
| HbA1c (%)* | 5.34 ± 0.54 | 8.07 ± 2.01 |
| Current or past htn meds (%)* | 33 | 72 |
| On anti-diabetic meds (y/n) | n.a. | 17/1 |
| Smoking (y/n) | 1/11 | 3/15 |
p < 0.05.
2.2. Definition of T2DM
Participants with diabetes fulfilled one or more of the following: (1) fasting blood glucose >125 mg/dl on two separate occasions, (2) 2-h blood glucose level >200 mg/dl during a 75-g oral glucose tolerance test, or (3) a prior diagnosis of T2DM. Diabetics were being treated with hypoglycemic agents and/or by lifestyle modification but not with insulin or insulin secretagogues.
2.3. Definition of hypertension
Hypertension was defined based on NCEP guidelines as (1) systolic value ≥130 mm Hg, or (2) diastolic value ≥85 mm Hg, or (3) use of anti-hypertensive medication.
2.4. Cortisol assessment
On their first visit, participants received Salivette sampling devices (Salivette; Sarstedt, Nuembrecht, Germany) and were instructed by one of the investigators (HB) to ensure the sampling protocol was well-understood and to clarify any questions. Furthermore, written instructions about the saliva collection protocol were handed out along with the Salivettes. Samples were collected at home at wake-up, 15, 30, 60 min post-wake-up, and at 11 a.m. and 3 and 8 p.m. In addition to the very specific instructions given to all participants, they were also provided with a schedule for them to enter the actual time of sample collections, whether on schedule or to note any deviations from the recommended schedule. The entries on this schedule were used to monitor compliance with the collection schedule. Participants were asked to not eat or drink anything, brush their teeth, or smoke during collection of the first four samples and for 30 min before collection of each of the last three samples. Participants stored the samples in their freezer and brought them to the laboratory on their next visit, where they were stored at −20 °C until analysis.
The increase in cortisol between wake-up and 30 min afterwards (CAR) was computed by subtracting the baseline from the 30 min value (Clow et al., 2004). In addition, the area under the curve (AUCi) was also computed using the trapezoidal method (Pruessner et al., 2003).
2.5. Assays
Glucose, insulin, and glycated hemoglobin (HbA1c) were measured using our certified hospital clinical laboratory. Free salivary cortisol was analyzed by chemi-luminescence assay (CLIA) with a sensitivity of 0.25 nmol/l (IBL, Hamburg, Germany).
2.6. Neuroimaging
All participants were scanned on a 1.5-T Siemens Avanto system. A magnetization-prepared rapid gradient echo acquisition (TR 1300 ms, TE 4.38 ms, 192 slices, slice thickness 1.2 mm with no gap; FOV 250 mm × 250 mm, matrix 256 × 128, flip angle 15°) was used to acquire structural images. Signal-intensity was normalized, and regions of interest (ROI) of the hippocampus, superior-temporal-gyrus, intracranial vault, and frontal lobe were manually outlined using our highly reliable (all inter-rater intra-class correlation coefficients greater than 0.94) parcellation methods (Convit et al., 1997, 1999, 2001) (please see Gold et al., 2007 for details). Volumes (in cm3) of those ROIs were determined by summing across all slices and multiplying by the slice thickness. Global and cortical atrophy (CSF within the entire brain and prefrontal cortex, respectively) were ascertained by utilizing a threshold procedure to yield volumes of the CSF component in cm3. All image processing was done using our in-house developed imaging software MIDAS.
All our MRI-based volume measurements were done blind to subject identity or group membership. Given that we studied both men and women and in order to adjust for individual variability in head size, the brain volumes derived were residualized to the intracranial vault volume.
Fast fluid-attenuated inversion recovery (FLAIR) images were collected to quantify white matter disease and rule out primary neurological disease using the following image acquisition parameters: TR 9000 ms, TE 97 ms, acquisition matrix 154 × 256, FOV 210 × 210, slice thickness 3 mm; 50 slices, no gaps. White matter disease was rated utilizing the modified Fazekas scale, which assigns scores ranging from 0 to 3 for periventricular and deep white matter (Scheltens et al., 1993).
2.7. Statistical analysis
Student’s t-tests and χ2 tests were used for comparing groups on demographic and medical descriptors. Univariate ANOVA was used to compare groups on the CAR and cortisol AUCi.
A two factor mixed design ANOVA with diabetes status as the between-subject factor and time after awakening (0, +15, +30, +60 min) as the within-subject factor was used to compare the slope of the CAR in both groups. Similarly, a two factor mixed design ANOVA with diagnosis as the between-subject factor and time of day (11 a.m., 3 and 8 p.m.) as the within-subject factor was used to analyze the diurnal cortisol profile. Greenhouse Geisser corrections were made when sphericity assumptions were violated.
To determine the relative contribution of hippocampal volume to the CAR and ascertain if the CAR was influenced by other diabetes-specific factors, we ran linear regression analysis with the CAR as the dependent variable. After controlling for diabetes diagnosis, body-mass-index (BMI), HbA1c (a proxy for mean glucose levels over the past 2–3 months), insulin, hypertension, hypertension medication and ICV-adjusted hippocampal volume were entered in one block in a stepwise fashion. Based on the outcome of this analysis, we created a final model with diabetes diagnosis, insulin, and ICV-adjusted hippocampal volume as the three independent factors, which were then entered in hierarchical blocks.
Associations between variables were established using Pearson’s correlations. Covariates were added as appropriate.
Data were analyzed using SPSS software, version 12.
3. Results
3.1. Medical
Diabetic participants tended to be younger (p = 0.076) and, as expected had significantly higher fasting glucose and insulin levels as well as higher percent HbA1c, greater BMI, and more lipid abnormalities than controls (all p < 0.05). Please refer to Table 1.
3.2. Salivary cortisol: CAR profile and diurnal profile
ANOVA of the CAR profile revealed a significant main effect of time (F = 5.063, p = 0.003), indicative of cortisol rhythmicity. Furthermore, we found a significant interaction of time and diagnosis for the CAR profile (F = 4.720, p = 0.004). The CAR was significantly smaller in the diabetic group (controls CAR: 8.05 ± 8.32 nmol/l vs. T2DM CAR: −0.52 ± 6.70 nmol/l, F = 9.701, p = 0.004), showing that diabetic subjects did not have the typically expected peak at 30 min post-wakeup. This blunting of the CAR was independent of age, gender, and wakeup time, which are all parameters that can potentially affect the CAR.
In addition, to integrate all morning samples, we also computed the cortisol area under the curve (AUCi) for the first four saliva samples and found that the diabetic group had a smaller AUCi, even though the p-value just fell short of significance (controls AUCi: 208 ± 354 vs. T2DM AUCi: −34 ± 287, F = 4.117, p = 0.052).
With respect to the diurnal profile, we found a significant main effect of time (F = 5.998, p = 0.017), indicative of the expected decline of cortisol levels throughout the day. There was no significant main effect of diagnosis or diagnosis by time interaction in regard to the diurnal profile. Fig. 1 clearly shows the blunting of the CAR in the diabetic group (filled circles), whereas the rest of the diurnal cortisol profile did not differ between groups.
Fig. 1.
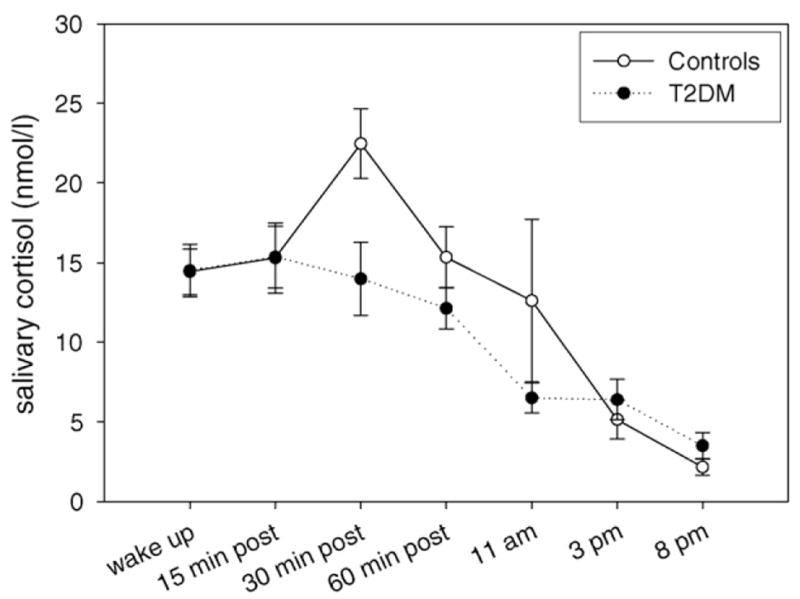
Cortisol trajectory (mean ± S.E.M.) in the T2DM (filled circles) and the control (open circles) group.
3.3. White matter hyperintensities
Only three participants (one control, two diabetics) received a score of two on periventricular, and two diabetic participants had a score of two on deep white matter ratings. The diabetic and control group did not differ with respect to periventricular (χ2 = 1.010, p = 0.603), or deep white matter (χ2 = 2.460, p = 0.292) hyperintensities.
3.4. Brain volumetry
We did not observe any lateralization effects and therefore averaged left and right hemispheres. As can be seen in Table 2, individuals with T2DM had significantly smaller mean ICV-adjusted hippocampal volumes than controls, while they did not differ on the other brain volumes measured. The smaller ICV-adjusted hippocampal volume in the diabetic group thus appears to be specific. Please note that although the volumes in the table are the raw (non-ICV-adjusted) values, which are presented for ease of reference and to allow comparison to other studies, the t-and p-values are derived from ICV-adjusted (residualized) volumes.
Table 2.
Brain volumes in cm3 (average of left- and right-hemispheres; mean ± S.D.).
| ROI (cm3) | Control group (n = 12) | T2DM group (n = 18) | t | p |
|---|---|---|---|---|
| Hippocampus* | 2.88 ± 0.25 | 2.69 ± 0.19 | 2.346 | 0.032 |
| Superior temporal gyrus | 11.40 ± 1.39 | 11.39 ± 1.80 | −0.164 | 0.871 |
| Global atrophy | 120.95 ± 50.15 | 114.48 ± 49.26 | 0.098 | 0.923 |
| Cortical atrophy | 21.29 ± 11.02 | 20.57 ± 9.41 | 0.447 | 0.658 |
| ICV | 1220.53 ± 139.26 | 1201.38 ± 133.20 | 0.379 | 0.708 |
p < 0.05.
3.5. Associations between hippocampal volume and T2DM-associated factors in the diabetic group
Within the diabetic group, ICV-adjusted hippocampal volume strongly correlated with duration of disease (r = −0.569, p = 0.014), HbA1c (r = −0.565, p = 0.015), and BMI (r = −0.499, p = 0.035), however, the association to BMI became non-significant, when we controlled for glycemic control (HbA1c).
3.6. Associations between CAR and hippocampal volume
CAR, but not diurnal cortisol (AUCi), significantly correlated with ICV-adjusted hippocampal volume (r = 0.551, p = 0.002); independent of group membership (partial r = 0.425, p = 0.022). Controlling for age, gender, or wakeup time, which can influence the CAR, did not change the association. When we looked at the groups separately, we found that the positive correlation between CAR and ICV-adjusted hippocampal volume was present in both groups, however, it was significant only in the control (r = 0.636, p = 0.026) and not the diabetic group (r = 0.163, p = 0.519).
To determine the relative contribution of ICV-adjusted hippocampal volume to the CAR, while considering the possible impact of diabetes-associated factors, we ran linear regression analysis. We first controlled for diabetes diagnosis (25.7% of the variance, final model: β = −0.875, t = −0.309, p = 0.760). Insulin, entered in the second block, explained an additional 14.3% of the variance with higher insulin levels being associated with a smaller CAR (final model: β = −0.344, t = −3.209, p = 0.004). When ICV-adjusted hippocampal volume was entered in the third block, it explained an additional 16.4% of the variance of the CAR, with higher hippocampal volume being associated with a larger CAR (final model: β = 18.405, t = 3.125, p = 0.004). In summary, we found that both insulin and hippocampal volume contributed to the CAR, independent of group membership.
Fig. 2 depicts the association between non-ICV-adjusted hippocampal volume and the CAR.
Fig. 2.

The association between hippocampal volume and CAR across the diabetic (filled triangles) and control (open triangles) group.
4. Discussion
In this first report of both CAR and hippocampal volume among individuals with T2DM and controls, we detected a blunting of the CAR, with preservation of diurnal rhythm, in participants with T2DM. In addition, as we had hypothesized, we found reduced hippocampal volume among individuals with T2DM and that reduction in hippocampal volume was associated with duration of T2DM, and long-term glycemic control (HbA1c). Furthermore, across all participants, insulin levels and hippocampal volume contributed to the magnitude of the CAR, independent of diagnosis.
Our finding of a blunted CAR in T2DM extends prior reports of an abnormal HPA axis in T2DM, which had examined other aspects of HPA axis function such as basal levels in plasma (i.e., Lee et al., 1999). Of note, this blunting of the CAR was observed despite the fact that our T2DM group tended to be younger and had a higher mean BMI than the control group (most being in the obese range), and both obesity and younger age have been associated with an enhanced CAR (Kudielka and Kirschbaum, 2003; Therrien et al., 2007). This may imply that a T2DM-specific factor influences the CAR and overrides possible opposing age and obesity effects.
Among our diabetics, longer duration of T2DM, as well as poorer glycemic control (higher levels of HbA1c) were associated with a smaller hippocampus. In addition, there was also an association to higher BMI, but this was mediated by HbA1c. This corroborates findings of an earlier study from our laboratory, in which we also found an association between glycemic control and hippocampal volume (Gold et al., 2007) and suggests a direct impact of T2DM on the hippocampus. Several mechanisms could account for this damage, among which are, for example, the formation of toxic advanced glycation end-products (Rojas and Morales, 2004), increased production of superoxides via increased intracellular glucose metabolism (Brownlee, 2001), and endothelial dysfunction (Tooke and Hannemann, 2000).
Across all participants the magnitude of the CAR was associated with both fasting insulin levels and hippocampal volume, and this was independent of diagnosis. This association could be interpreted as an indication that both metabolic control and hippocampal volume are important contributors to the CAR, which is in keeping with a finding by Lasikiewicz et al. (2008), who detected that those middle-aged participants that showed a blunting of the CAR also tended to have higher insulin levels. These investigators concluded that the cortisol awakening response could therefore be used as a marker for metabolic vulnerability. However, the opposite scenario is also possible, in that the blunted cortisol awakening response may be the result of the metabolic dysregulation. The exact nature of these relationships remains yet to be determined.
In addition to fasting insulin, hippocampal volume was a significant predictor of the CAR. This corroborates the findings of two previous reports in healthy young (Pruessner et al., 2007) and older adults (Pruessner et al., 2005), where positive associations between hippocampal volume and the CAR were described.
Importantly, we did not observe an association between hippocampal volume and CAR within the diabetic group alone. It is possible that the large variability in insulin levels in the diabetic group masked the association between hippocampal volume and the CAR, and controlling for insulin indeed made that association stronger, albeit still not significant (data not shown). It remains to be seen if this relationship becomes significant by expanding the number of study subjects. Although our participants with T2DM had much milder hippocampal damage (about 10% volume reductions) than patients with hippocampal lesions, the lack of a significant association to CAR is in keeping with the negative results reported by Buchanan et al. (2004) for lesion patients. Our data in conjunction with that of previous reports may, therefore, suggest that a minimum level of hippocampal integrity is required for a normal CAR and that only above that threshold, is there a positive association between hippocampal volumes and CAR.
Our data also suggest that the hippocampus may have a role in the regulation of the HPA axis, which extends beyond the feedback regulation of the axis (de Kloet, 2000; Herman et al., 2005). Studies on HPA axis, which have not included the CAR, have focused on the hippocampus as a regulatory entity with a negative feedback function or as a target structure for cortisol, and have generally yielded negative associations between hippocampal volume and cortisol levels (smaller volumes associated with higher cortisol levels). These negative associations have been found, for example, in normal aging (Lupien et al., 1998) and in some studies of depression (Axelson et al., 1993). In this report, on the contrary, we report that although not associated with diurnal cortisol, a smaller hippocampal volume is associated with an ablated HPA axis response to awakening, as indicated by a smaller CAR. Hence, it seems that hippocampal integrity is crucial for the initiation of the response to awakening and maybe for the initiation of a cortisol response in general, i.e., to stress, as has recently been speculated by Pruessner et al. (2008). However, further research is warranted to determine the regulatory mechanisms of the CAR, which are complex and most certainly go beyond hippocampal integrity alone.
To date, the significance of the CAR is not well understood (Clow et al., 2004), but given its link to hippocampal integrity, it may be associated with memory systems, as has been hypothesized by some authors (Wilhelm et al., 2007). Interestingly, depression as well as PTSD, conditions in which both reduced hippocampal volume and a diminished CAR have been described (Videbech and Ravnkilde, 2004; Rohleder et al., 2004; Smith, 2005; Huber et al., 2006), are also accompanied by memory impairments (Vasterling et al., 1998; Thomas and O’Brien, 2008), as is T2DM (i.e., Bruehl et al., 2007).
Although only speculation, since it is very unlikely that a missing cortisol awakening response leads to hippocampal damage, the most straight forward interpretation of our findings here as well as that of previous studies in healthy and lesioned subjects and psychiatric populations, is that the hippocampus is one of the key components for an intact CAR. Compromised hippocampal integrity, independent of its origin, appears to be associated with a blunted CAR, however, future research is warranted to disentangle cause and effect in the hippocampus–CAR relationship.
This study is limited by its cross-sectional design and relatively small sample size, which preclude analysis of possible gender differences or cause–effect relationships. Another limitation is that the CAR assessment was based on only 1 day of salivary cortisol collections. Further research should utilize longitudinal designs to address the question of cause and effect with respect to the hippocampus–CAR relationship, as well as multiple day salivary collections to better stabilize that data.
In conclusion, we report smaller hippocampal volumes and a blunted CAR in a group of patients with T2DM. Hippocampal volume in T2DM was associated with glycemic control, and the CAR was linked to both metabolic regulation and hippocampal volume across all subjects. Our results further strengthen the previously reported relationship between the hippocampus and the CAR.
Acknowledgments
Role of funding sources
This study was supported by grants DK 064087, P30-AG-08051 and NCRR M01 RR00096 from the National Institutes of Health, USA.
We thank Prof. Clemens Kirschbaum for conducting the cortisol assays.
Footnotes
Conflict of interest
The authors have no real or apparent conflict of interest.
References
- Andrews RC, Herlihy O, Livingstone DEW, Andrew R, Walker BR. Abnormal cortisol metabolism and tissue sensitivity to cortisol in patients with glucose intolerance. J Clin Endocrinol Metab. 2002;87:5587–5593. doi: 10.1210/jc.2002-020048. [DOI] [PubMed] [Google Scholar]
- Awad N, Gagnon M, Messier C. The relationship between impaired glucose tolerance, type 2 diabetes, and cognitive function. J Clin Exp Neuropsychol. 2004;26:1044–1080. doi: 10.1080/13803390490514875. [DOI] [PubMed] [Google Scholar]
- Axelson DA, Doraiswamy PM, McDonald WM, Boyko OB, Tupler LA, Patterson LJ, Nemeroff CB, Ellinwood EH, Krishnan KRR. Hypercortisolemia and hippocampal changes in depression. Psychiatry Res. 1993;47:163–173. doi: 10.1016/0165-1781(93)90046-j. [DOI] [PubMed] [Google Scholar]
- Badrick E, Kirschbaum C, Kumari M. The relationship between smoking status and cortisol secretion. J Clin Endocrinol Metab. 2007;92:819–824. doi: 10.1210/jc.2006-2155. [DOI] [PubMed] [Google Scholar]
- Bloomgarden ZT. Diabetes and hypertension. Diabetes Care. 2001;24:1679–1684. doi: 10.2337/diacare.24.9.1679. [DOI] [PubMed] [Google Scholar]
- Brownlee M. Biochemistry and molecular cell biology of diabetic complications. Nature. 2001;414:813–820. doi: 10.1038/414813a. [DOI] [PubMed] [Google Scholar]
- Bruehl H, Rueger M, Dziobek I, Sweat V, Tirsi A, Javier E, Arentoft A, Wolf OT, Convit A. Hypothalamic–pituitary–adrenal axis dysregulation and memory impairments in type 2 diabetes. J Clin Endocrinol Metab. 2007;92:2439–2445. doi: 10.1210/jc.2006-2540. [DOI] [PubMed] [Google Scholar]
- Buchanan TW, Kern S, Allen JS, Tranel D, Kirschbaum C. Circadian regulation of cortisol after hippocampal damage in humans. Biol Psychiatry. 2004;56:651–656. doi: 10.1016/j.biopsych.2004.08.014. [DOI] [PubMed] [Google Scholar]
- Busch CP, Hegele RA. Genetic determinants of type 2 diabetes mellitus. Clin Genet. 2001;60:243–254. doi: 10.1034/j.1399-0004.2001.600401.x. [DOI] [PubMed] [Google Scholar]
- Clow A, Thorn L, Evans P, Hucklebridge F. The awakening cortisol response: methodological issues and significance. Stress. 2004;7:29–37. doi: 10.1080/10253890410001667205. [DOI] [PubMed] [Google Scholar]
- Convit A, de Leon MJ, Tarshish C, De Santi S, Tsui W, Rusinek H, George AE. Specific hippocampal volume reductions in individuals at risk for Alzheimer’s disease. Neurobiol Aging. 1997;18:131–138. doi: 10.1016/s0197-4580(97)00001-8. [DOI] [PubMed] [Google Scholar]
- Convit A, McHugh PR, Wolf OT, de Leon MJ, Bobinski M, De Santi S, Roche A, Tsui W. MRI volume of the amygdala: a reliable method allowing separation from the hippocampal formation. Psychiatry Res Neuroimag. 1999;90:113–123. doi: 10.1016/s0925-4927(99)00007-4. [DOI] [PubMed] [Google Scholar]
- Convit A, Wolf OT, de Leon MJ, Patalinjug M, Kandil E, Cardebat D, Scherer A, Saint Louis LA, Cancro R. Volumetric analysis of the pre-frontal regions: findings in aging and schizophrenia. Psychiatry Res Neuroimag. 2001;107:61–73. doi: 10.1016/s0925-4927(01)00097-x. [DOI] [PubMed] [Google Scholar]
- de Kloet ER. Stress in the brain. Eur J Pharmacol. 2000;405:187–198. doi: 10.1016/s0014-2999(00)00552-5. [DOI] [PubMed] [Google Scholar]
- den Heijer T, Vermeer SE, van Dijk EJ, Prins ND, Koudstaal PJ, Hofman A, Breteler MM. Type 2 diabetes and atrophy of the medial temporal lobe structures on brain MRI. Diabetologia. 2003;46:1604–1610. doi: 10.1007/s00125-003-1235-0. [DOI] [PubMed] [Google Scholar]
- Dyck RF, Sheppard MS, Cassidy H, Chad K, Tan L, Van Vliet SH. Preventing NIDDM among aboriginal people: is exercise the answer? Int J Circumpolar Health. 2008;57:375–378. [PubMed] [Google Scholar]
- Federenko I, Wust S, Hellhammer DH, Dechoux R, Kumsta R, Kirschbaum C. Free cortisol awakening responses are influenced by awakening time. Psychoneuroendocrinology. 2004;29:174–184. doi: 10.1016/s0306-4530(03)00021-0. [DOI] [PubMed] [Google Scholar]
- Ferrannini E, Natali A, Bell P, Cavallo-Perin P, Lalic N, Mingrone G. Insulin resistance and hypersecretion in obesity. J Clin Invest. 1997;100:1166–1173. doi: 10.1172/JCI119628. [DOI] [PMC free article] [PubMed] [Google Scholar]
- Fries E, Dettenborn L, Kirschbaum C. The cortisol awakening response (CAR): facts and future directions. Int J Psychophysiol. doi: 10.1016/j.ijpsycho.2008.03.014. in press. epub Sept. 30, 2008. [DOI] [PubMed] [Google Scholar]
- Gold SM, Dziobek I, Sweat V, Tirsi A, Rogers K, Bruehl H, Tsui W, Richardson S, Javier E, Convit A. Hippocampal damage and memory impairments as possible early brain complications of type 2 diabetes. Diabetologia. 2007;50:711–719. doi: 10.1007/s00125-007-0602-7. [DOI] [PubMed] [Google Scholar]
- Goldberg RB, Capuzzi D. Lipid disorders in type 1 and type 2 diabetes. Clin Lab Med. 2001;21:147–172. [PubMed] [Google Scholar]
- Herman JP, Ostrander MM, Mueller NK, Figueiredo H. Limbic system mechanisms of stress regulation: hypothalamo–pituitary–adrenocortical axis. Prog Neuropsychopharmacol Biol Psychiatry. 2005;29:1201–1213. doi: 10.1016/j.pnpbp.2005.08.006. [DOI] [PubMed] [Google Scholar]
- Huber TJ, Issa K, Schik G, Wolf OT. The cortisol awakening response is blunted in psychotherapy inpatients suffering from depression. Psychoneuroendocrinology. 2006;31:900–904. doi: 10.1016/j.psyneuen.2006.03.005. [DOI] [PubMed] [Google Scholar]
- Hucklebridge FH, Clow A, Abeyguneratne T, Huezo-Diaz P, Evans P. The awakening cortisol response and blood glucose levels. Life Sci. 1999;64:931–937. doi: 10.1016/s0024-3205(99)00019-3. [DOI] [PubMed] [Google Scholar]
- Jacobson L, Sapolsky RM. The role of the hippocampus in feedback regulation of the hypothalamic–pitutiary–adrenocortical axis. Endocr Rev. 1991;12:118–134. doi: 10.1210/edrv-12-2-118. [DOI] [PubMed] [Google Scholar]
- Khani S, Tayek JA. Cortisol increases gluconeogenesis in humans: itsroleinthe metabolic syndrome. Clin Sci. 2001;101:739–747. doi: 10.1042/cs1010739. [DOI] [PubMed] [Google Scholar]
- Kirschbaum C, Kudielka BM, Gaab J, Schommer NC, Hellhammer DH. Impact of gender, menstrual cycle phase, and oral contraceptives on the activity of the hypothalamus–pituitary–adrenal axis. Psychosom Med. 1999;61:154–162. doi: 10.1097/00006842-199903000-00006. [DOI] [PubMed] [Google Scholar]
- Kudielka BM, Kirschbaum C. Awakening cortisol responses are influenced by health status and awakening time but not by menstrual cycle phase. Psychoneuroendocrinology. 2003;28:35–47. doi: 10.1016/s0306-4530(02)00008-2. [DOI] [PubMed] [Google Scholar]
- Lasikiewicz N, Hendrickx H, Talbot D, Dye L. Exploration of basal diurnal salivary cortisol profiles in middle-aged adults: associations with sleep quality and metabolic parameters. Psychoneuroendocrinology. 2008;33:143–151. doi: 10.1016/j.psyneuen.2007.10.013. [DOI] [PubMed] [Google Scholar]
- Lee ZS, Chan JC, Yeung VT, Chow CC, Lau MS, Ko GT, Li JK, Cockram CS, Critchley JA. Plasma insulin, growth hormone, cortisol, and central obesity among young Chinese type 2 diabetic patients. Diabetes Care. 1999;22:1450–1457. doi: 10.2337/diacare.22.9.1450. [DOI] [PubMed] [Google Scholar]
- Liu H, Bravata DM, Cabaccan J, Raff H, Ryzen E. Elevated late-night salivary cortisol levels in elderly male type 2 diabetic veterans. Clin Endocrinol. 2005;63:642–649. doi: 10.1111/j.1365-2265.2005.02395.x. [DOI] [PubMed] [Google Scholar]
- Lupien SJ, de Leon MJ, De Santi S, Convit A, Tarshish C, Nair NPV, Thakur M, McEwen BS, Hauger RL, Meaney MJ. Cortisol levels during human aging predict hippocampal atrophy and memory deficits. Nat Neurosci. 1998;1:69–73. doi: 10.1038/271. [DOI] [PubMed] [Google Scholar]
- Panagiotakos DB, Pitsavos C, Skoumas Y, Lentzas Y, Stefanadis C. Five-year incidence of type 2 diabetes mellitus among cardiovascular disease-free Greek adults: findings from the ATTICA study. Vasc Health Risk Manage. 2008;4:691–698. doi: 10.2147/vhrm.s2261. [DOI] [PMC free article] [PubMed] [Google Scholar]
- Pruessner JC, Wolf OT, Hellhammer DH, Buske-Kirschbaum A, von Auer K, Jobst S, Kaspers F, Kirschbaum C. Free cortisol levels after awakening: a reliable biological marker for the assessment of adrenocortical activity. Life Sci. 1997;61:2539–2549. doi: 10.1016/s0024-3205(97)01008-4. [DOI] [PubMed] [Google Scholar]
- Pruessner JC, Kirschbaum C, Meinlschmid G, Hellhammer DH. Two formulas for computation of the area under the curve represent measures of total hormone concentration versus time-dependent change. Psychoneuroendocrinology. 2003;28:916–931. doi: 10.1016/s0306-4530(02)00108-7. [DOI] [PubMed] [Google Scholar]
- Pruessner JC, Baldwin MW, Dedovic K, Renwick R, Mahani NK, Lord C, Meaney M, Lupien S. Self-esteem, locus of control, hippocampal volume, and cortisol regulation in young and old adulthood. Neuroimage. 2005;28:815–826. doi: 10.1016/j.neuroimage.2005.06.014. [DOI] [PubMed] [Google Scholar]
- Pruessner M, Pruessner JC, Hellhammer DH, Bruce Pike G, Lupien SJ. The associations among hippocampal volume, cortisol reactivity, and memory performance in healthy young men. Psychiatry Res: Neuroimag. 2007;155:1–10. doi: 10.1016/j.pscychresns.2006.12.007. [DOI] [PubMed] [Google Scholar]
- Pruessner JC, Dedovic K, Khalili-Mahani N, Engert V, Pruessner M, Buss C, Renwick R, Dagher A, Meaney MJ, Lupien S. Deactivation of the limbic system during acute psychosocial stress: evidence from positron emission tomography and functional magnetic resonance imaging studies. Biol Psychiatry. 2008;63:234–240. doi: 10.1016/j.biopsych.2007.04.041. [DOI] [PubMed] [Google Scholar]
- Quinn L. Mechanisms in the development of type 2 diabetes mellitus. J Cardiovasc Nurs. 2002;16:1–16. doi: 10.1097/00005082-200201000-00002. [DOI] [PubMed] [Google Scholar]
- Rohleder N, Joksimovic L, Wolf JM, Kirschbaum C. Hypocortisolism and increased glucocorticoid sensitivity of proinflammatory cytokine production in Bosnian war refugees with posttraumatic stress disorder. Biol Psychiatry. 2004;55:745–751. doi: 10.1016/j.biopsych.2003.11.018. [DOI] [PubMed] [Google Scholar]
- Rojas A, Morales MA. Advanced glycation and endothelial functions: a link towards vascular complications in diabetes. Life Sci. 2004;76:715–730. doi: 10.1016/j.lfs.2004.09.011. [DOI] [PubMed] [Google Scholar]
- Scheltens P, Barkhof F, Leys D, Pruvo JP, Nauta JJ, Vermersch P, Steinling M, Valk J. A semiquantative rating scale for the assessment of signal hyperintensities on magnetic resonance imaging. J Neurol Sci. 1993;114:7–12. doi: 10.1016/0022-510x(93)90041-v. [DOI] [PubMed] [Google Scholar]
- Schlotz W, Hellhammer J, Schulz P, Stone AA. Perceived work overload and chronic worrying predict weekend–weekday differences in the cortisol awakening response. Psychosom Med. 2004;66:207–214. doi: 10.1097/01.psy.0000116715.78238.56. [DOI] [PubMed] [Google Scholar]
- Smith ME. Bilateral hippocampal volume reduction in adults with post-traumatic stress disorder: a meta-analysis of structural MRI studies. Hippocampus. 2005;15:798–807. doi: 10.1002/hipo.20102. [DOI] [PubMed] [Google Scholar]
- Therrien F, Drapeau V, Lalonde J, Lupien SJ, Beaulieu S, Tremblay A, Richard D. Awakening cortisol response in lean, obese, and reduced obese individuals: effect of gender and fat distribution. Obesity (Silver, Spring) 2007;15:377–385. doi: 10.1038/oby.2007.509. [DOI] [PubMed] [Google Scholar]
- Thomas AJ, O’Brien JT. Depression and cognition in older adults. Curr Opin Psychiatry. 2008;21:8–13. doi: 10.1097/YCO.0b013e3282f2139b. [DOI] [PubMed] [Google Scholar]
- Tooke JE, Hannemann MM. Adverse endothelial function and the insulin resistance syndrome. J Intern Med. 2000;247:425–431. doi: 10.1046/j.1365-2796.2000.00671.x. [DOI] [PubMed] [Google Scholar]
- Vasterling JJ, Brailey K, Constans JI, Sutker PB. Attention and memory dysfunction in posttraumatic stress disorder. Neuropsychology. 1998;12:125–133. doi: 10.1037//0894-4105.12.1.125. [DOI] [PubMed] [Google Scholar]
- Videbech P, Ravnkilde B. Hippocampal volume and depression: a meta-analysis of MRI studies. Am J Psychiatry. 2004;161:1957–1966. doi: 10.1176/appi.ajp.161.11.1957. [DOI] [PubMed] [Google Scholar]
- Wilhelm I, Born J, Kudielka BM, Schlotz W, Wust S. Is the cortisol awakening rise a response to awakening? Psychoneuroendocrinology. 2007;32:358–366. doi: 10.1016/j.psyneuen.2007.01.008. [DOI] [PubMed] [Google Scholar]
- Wolf OT, Fujiwara E, Luwinski G, Kirschbaum C, Markowitsch HJ. No morning cortisol response in patients with severe global amnesia. Psychoneuroendocrinology. 2005;30:101–105. doi: 10.1016/j.psyneuen.2004.05.001. [DOI] [PubMed] [Google Scholar]
- Wuest S, Wolf J, Hellhammer DH, Federenko I, Schommer N, Kirschbaum C. The cortisol awakening response–normal values and confounds. Noise Health. 2000;2:79–88. [PubMed] [Google Scholar]