Abstract
In this paper, we investigated the molecular interactions of Magainin 2 with model cell membranes using Sum Frequency Generation (SFG) vibrational spectroscopy and Attenuated Total Reflectance – Fourier Transform Infrared spectroscopy (ATR-FTIR). Symmetric 1-Palmitoyl-2-Oleoyl-sn-Glycero-3-[Phospho-rac-(1-glycerol)] (POPG) and 1-Palmitoyl-2-Oleoyl-sn-Glycero-3-Phosphocholine (POPC) bilayers, which model the bacterial and mammalian cell membranes respectively, were used in the studies. It was observed by SFG that Magainin 2 orients relatively parallel to the POPG lipid bilayer surface at low solution concentrations, around 200 nM. When increasing the Magainin 2 concentration to 800 nM, both SFG and ATR-FTIR results indicate that Magainin 2 molecules insert into the POPG bilayer and adopt a transmembrane orientation with an angle of about 20 degrees from the POPG bilayer normal. For the POPC bilayer, even at a much higher peptide concentration of 2.0 µM, no ATR-FTIR signal was detected. For this concentration on POPC, SFG studies indicated that Magainin 2 molecules adopt an orientation nearly parallel to the bilayer surface, with an orientation angle of 75 degrees from the surface normal. This shows that SFG has a much better detection limit than ATR-FTIR and can therefore be applied to study interfacial molecules with much lower surface coverage. This Magainin 2 orientation study and further investigation of the lipid bilayer SFG signals support the proposed toroidal pore model for the antimicrobial activity of Magainin 2.
1. Introduction
Isolated from the African clawed frog Xenopus laevis, Magainins have been shown to have antimicrobial activity.1–3 At low concentrations, magainin peptides are able to disrupt the bacterial cell membrane, leading to cell death. At these concentrations, however, magainin peptides have been shown to be harmless to mammalian cells.2 The Magainin family is considered to be the most well-studied group of peptides among all antimicrobial peptides. Magainins have been shown to have antimicrobial activity against a large number of bacterial strains, and it is believed that they have a great therapeutic potential in the treatment of bacterial, fungal and protozoan infections in humans.2 Among its family, Magainin 2 possesses a broad antimicrobial spectrum with high potency. Experimental tests have shown that Magainin 2 is about 5 to 10 times more potent than Magainin 1.2 Extensive studies have been carried out to understand the antimicrobial activity of Magainin 2 using different techniques ranging from experimental methods such as External Reflection-Fourier Transform Infrared spectroscopy (ER-FTIR), neutron reflectivity,4 oriented circular dichroism,5,6 X-ray diffraction,7 confocal laser scanning microscopy,8 differential scanning calorimetry, solid-state NMR,9 atomic force microscopy10 and fluorescence spectroscopy11–13 to molecular dynamics simulations.14,15
Many of the above efforts were trying to unveil the differences in the interaction schemes of Magainin 2 with bacterial cells as opposed to mammalian cells. Even though a consensus has not been reached, it is generally believed that Magainin 2 disrupts bacterial cells by forming toroidal pores (wormholes) in the membrane; whereas it binds horizontally to the mammalian cell membranes and hence exhibits no disruptive activity.16–18
The lipid compositions of cell membranes play a significant role in the ability of many antimicrobial peptides to distinguish between bacterial cell membranes and mammalian cell membranes. Bacterial cell membranes consist of a substantial amount of lipids with negatively charged head groups (e.g., phosphatidylglycerol – PG) in addition to zwitterionic lipids (e.g., phosphatidylethanolamine – PE). Mammalian cell membranes, on the other hand, mainly have zwitterionic lipids (e.g., phosphatidylcholine – PC) and other components (e.g., cholesterol). Most antimicrobial peptides contain amino acids that are positively charged, and this electrostatic attraction between the negatively charged lipids and the positive charges on the antimicrobial peptides is believed to be the driving force for their binding to bacterial cell membranes, but not mammalian ones.
Sum Frequency Generation (SFG) vibrational spectroscopy is a non-linear optical spectroscopic technique that is becoming more prevalent in the studies of a variety of interfaces due to its intrinsic surface/interface sensitivity. The advantages and strengths of using SFG in interfacial studies have been previously discussed extensively,19–27 and will not be repeated in detail here. In this paper, we will report the results obtained from SFG studies on Magainin 2 in mammalian and bacterial model membranes. Attenuated Total Reflectance – Fourier Transform Infrared spectroscopy (ATR-FTIR) was also used in this study as a supplemental technique to SFG. The combination of SFG and ATR-FTIR in the study of peptide-membrane interactions was shown to be valuable in our previous publication on the interactions between melittin and lipid bilayers.28 In this paper, SFG and ATR-FTIR data indicated similar Magainin 2 orientations in the respective lipid bilayers. This is the first report on the quantitatively measured average orientation angles of Magainin 2 molecules in a model bacterial cell membrane (a single POPG/POPG bilayer) in situ using SFG. The modes of action of Magainin 2 on both mammalian and bacterial cell membranes can be proposed through Magainin 2 orientations and SFG observations of lipid bilayers.
2. Materials and methods
Magainin 2 (GIGKWLHSAKKFGKAFVGEIMNS) was purchased from Bachem (Torrance, CA). Hydrogenated 1-Palmitoyl-2-Oleoyl-sn-Glycero-3-[Phospho-rac-(1-glycerol)] (POPG) and 1-Palmitoyl-2-Oleoyl-sn-Glycero-3-Phosphocholine (POPC) were ordered from Avanti Polar Lipids (Alabaster, AL).
For SFG experiments, right-angle CaF2 prisms purchased from Altos (Trabuco Canyon, CA) were soaked in toluene overnight and then sonicated in a Contrex AP solution from Decon Labs (King of Prussia, PA) before the first use. Before each lipid deposition, the CaF2 prisms were stored in a Contrex AP solution overnight and then rinsed with water before being immersed in methanol for an hour. The prisms were rinsed thoroughly with a large amount of deionized water and then cleaned in a glow discharge plasma chamber for 4 minutes immediately before the bilayer preparation. Substrates were tested by collecting SFG signals from their surfaces, and no contamination was detected.
We used the Langmuir-Blodgett and Langmuir-Schaefer (LB/LS) method to deposit the proximal and the distal leaflets, respectively.29, 30 A KSV2000 LB system and ultrapure water from a Millipore system (Millipore, Bedford, MA) were used throughout the bilayer preparation, which is briefly described below. A prism was attached to a sample holder via one right-angle face. The other right-angle face was perpendicularly immersed in the water inside the Langmuir trough. An appropriate amount of lipid chloroform solution was then gently spread onto the water surface, and the chloroform was allowed to evaporate. The lipid monolayer area was compressed by two barriers at a rate of 5 mm/min until a surface pressure of 34 mN/m was reached. The prism was lifted out of the subphase at a rate of 1 mm/min. A monolayer of lipid on the prism was thus prepared. A 2 mL reservoir was placed in a large trough slightly deeper than it so that water could cover it. The right-angle surface of the prism with the monolayer was horizontally lowered to contact the monolayer deposited on the water surface (with a surface pressure of 34 mN/m) of the trough to form a lipid bilayer. After the formation of the bilayer, the extra lipids at the air-water interface were removed using a micropipette. Water in the large trough was drained while keeping the bilayer immersed in water inside the small reservoir so that a much smaller amount of peptide/protein would be sufficient for the experiment. The bilayer was immersed in water throughout the entire experiment, and a small amount of water was added to the reservoir, when needed, to compensate for water evaporation during lengthy experiments.
For the Magainin 2-bilayer interaction experiments, a specific volume of the Magainin 2 aqueous stock solution was injected into the small reservoir of 2 mL to achieve the desired concentration. A magnetic microstirrer was used to ensure a homogeneous concentration distribution of peptide molecules in the subphase below the bilayer. All experiments were carried out at room temperature (~24°C), at which both POPG and POPC bilayers are in the fluid phase.
The SFG setup used in this study was purchased from EKSPLA. Details of the setup can be obtained from the manufacturer, and some details have been described in previous publications and will not be reiterated here.31, 32 Input laser beams were incident onto the prism through one of the right-angle faces and then reflected by the other right-angle face coated with the bilayer (Figure 1). The prism was arranged such that total reflection of the 532-nm green beam was achieved. Under these conditions, the infrared (IR) beam was not totally reflected. For orientation analysis, SFG spectra were collected using ssp (s-polarized output SFG signal, s-polarized input visible beam and p-polarized input IR beam) and ppp polarization combinations. Details about the analysis of SFG spectra will be presented later in section 3.
Figure 1.
Schematic of the near total reflection experimental geometry in the SFG setup.
ATR-FTIR experiments were carried out with a Nicolet Magna 550 FTIR spectrometer using a detachable ZnSe total internal reflection crystal (Specac Ltd. RI, United Kingdom). The LB/LS method was used to deposit the lipid bilayer onto the ZnSe crystal surface that had been pre-cleaned with methanol, Contrex AP solution, deionized water and eventually treated in a glow discharge plasma chamber for 2 minutes immediately before the bilayer preparation. After the lipid bilayer was deposited onto the crystal, the water that kept the bilayer hydrated was flushed multiple times with D2O to avoid signal confusion between the O-H bending mode and the peptide amide I mode, and to ensure a better S/N ratio in the peptide amide I band region. Next, the appropriate volume of a Magainin 2 stock solution (in D2O) was injected into the subphase of 1.6 mL to achieve the desired concentration. S and P polarized ATR-FTIR spectra of Magainin 2 in the lipid bilayer were taken for orientation analysis after the system reached equilibrium (about one hour).
3. SFG Data analysis
Magainin 2 is known to possess no well-defined secondary structure in aqueous solutions.33–36 However, CD, FTIR and solid-state NMR studies suggest that it folds into an α-helical structure in the presence of phospholipid bilayers.33–39 The average orientation of Magainin 2 molecules was calculated based on the orientation of the amide C=O bonds, which are held up in the direction of the helical axis by the hydrogen bonds within the peptide molecules. This average orientation was deduced by analyzing the polarized SFG amide I signal (between 1600 to 1700 cm−1). SFG amide I spectra are deconvoluted such that the α-helical spectral component (centered at ~1655 cm−1) can be extracted from the band. In addition, SFG spectra collected from the lipid bilayer in the C-H stretching frequency regime (2800 cm−1 to 3000 cm−1) (with or without the peptide addition) were investigated according to the thin film model as discussed in one of our previous publications.40
The peptide’s orientation information can be obtained by SFG using polarization combinations of ssp and ppp collected in the amide I regime. The SFG susceptibility tensor element χijk (i, j, k = x, y, z) is related to the SFG molecular hyperpolarizability tensor element βlmn (l, m, n = a, b, c) by Euler angle projections.41 The relationship between the SFG susceptibility tensor elements for α-helices, the orientation angle (θ) and the hyperpolarizability components can be expressed as:
| (1) |
Where
| (2) |
where Ns is the surface density of the α-helical repeat units. The SFG hyperpolarizability tensor elements can be deduced from Raman and IR properties of the α-helical molecules, which makes it possible to deduce the relations among these elements. From these deductions, we obtained r= 0.61 and βaca= 0.33βccc with the adoption of the bond additivity model on an α-helical symmetry that consists of 23 amino acid residues.42
We have developed a methodology to determine the orientation of α-helical structures using SFG amide I spectra collected with different polarization combinations.28,41,42 This method is based on the SFG data analysis for an α-helix with one unit length (eighteen amino acids) or infinitely long. We also completed the methodology by considering α-helices with a number of amino acid residues that is not a multiple of one unit (i.e., with the number of amino acids not being a multiple of 18). We presented a systematic discussion on the determination of the orientation of α-helices (as well as 3–10 helices) using SFG in reference 42. The current SFG study on Magainin 2 orientation can be considered as a successful application of the method.
4. Results and Discussions
4.1 SFG and ATR-FTIR Amide I Spectra
4.1.1 Magainin 2 in a POPG/POPG lipid bilayer
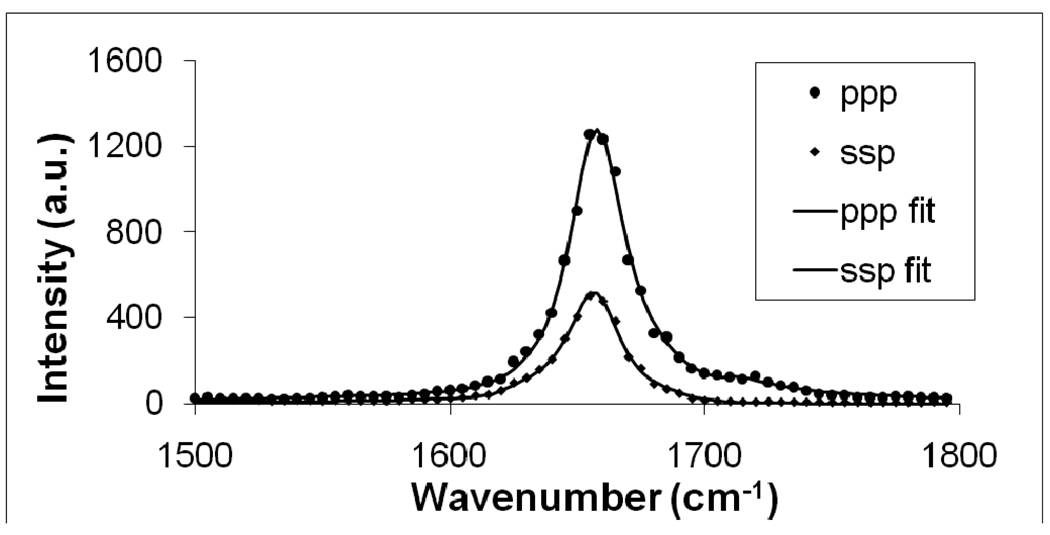
It has been shown that the minimum inhibitory concentration (MIC) of Magainin 2 against E. coli is around 20 µM.43 The positively charged Magainin 2 molecules tend to target anionic lipids in the cell membrane via electrostatic attraction. E. coli cell membranes only contain about 32% anionic lipids,44 thus a purely negatively charged lipid bilayer should require a lower peptide concentration for disruption than the MIC. In this set of experiments, we employed anionic POPG lipids to represent the bacterial cell membrane, and therefore a lower concentration of 800 nM of Magainin 2 was believed to be sufficient to ensure effective interactions between Magainin 2 and the POPG bilayer. Even at this 25-fold lower concentration than the MIC against E. coli, Magainin 2 exhibited excellent SFG signal strength (Figure 2), enabling for a reliable orientation analysis of Magainin 2 molecules in the bilayer using SFG.
Figure 2.
SFG ppp and ssp spectra of the C=O stretching frequency region collected from a POPG/POPG bilayer in contact with a 800 nM Magainin 2 solution.
Before we discuss the interactions between the POPG/POPG bilayer with Magainin 2 of a peptide solution of 800 nM, we first present the results on a lower Magainin 2 concentration of 200 nM. The CaF2 supported POPG/POPG bilayer was in contact with 2 mL deionized water, and 1 µL of the peptide stock solution was introduced. No discernable SFG signal in the amide I region could be detected after 1 hour (data not shown), but some changes in the lipid signal were observed (see later discussions for more details). This can be explained by the fact that the α-helical Magainin 2 peptides could be lying down on the bilayer surface, generating a much weaker SFG amide I signal than that generated from vertically oriented peptides in the bilayers, but still causing changes in the bilayer organization (see Section 4.2). Magainin 2 has an amphiphilic α-helical structure, which allows the peptide molecules to lie on the membrane surface at low peptide concentrations.45,11
A higher peptide concentration experiment was then carried out in which 4 µL Magainin 2 stock solution was added to the water subphase to reach a concentration of 800 nM. Magainin 2 was allowed to interact with the POPG/POPG bilayer and SFG spectra were collected. Figure 2 displays SFG spectra of the amide I range of Magainin 2 in association with the POPG/POPG bilayer after the signal had stabilized (around one hour). Both ssp and ppp spectra exhibit a dominant peak centered at 1657 cm−1. According to the previous vibrational spectroscopic studies on protein/peptide amide I signals and our previous research on melittin, the amide I mode (dominated by the C=O stretching mode) of the α-helical peptide units is centered at around 1655 cm−1.28,29,46–48 The amide I peak center obtained here affirms that Magainin 2 adopted a well-defined α-helical structure in the POPG/POPG bilayer.
SFG spectra can be fitted using the following equation:
| (3) |
where Aq, ωq, and Γq are the strength, resonant frequency and damping coefficient of the vibrational mode q respectively, and is the nonresonant background.
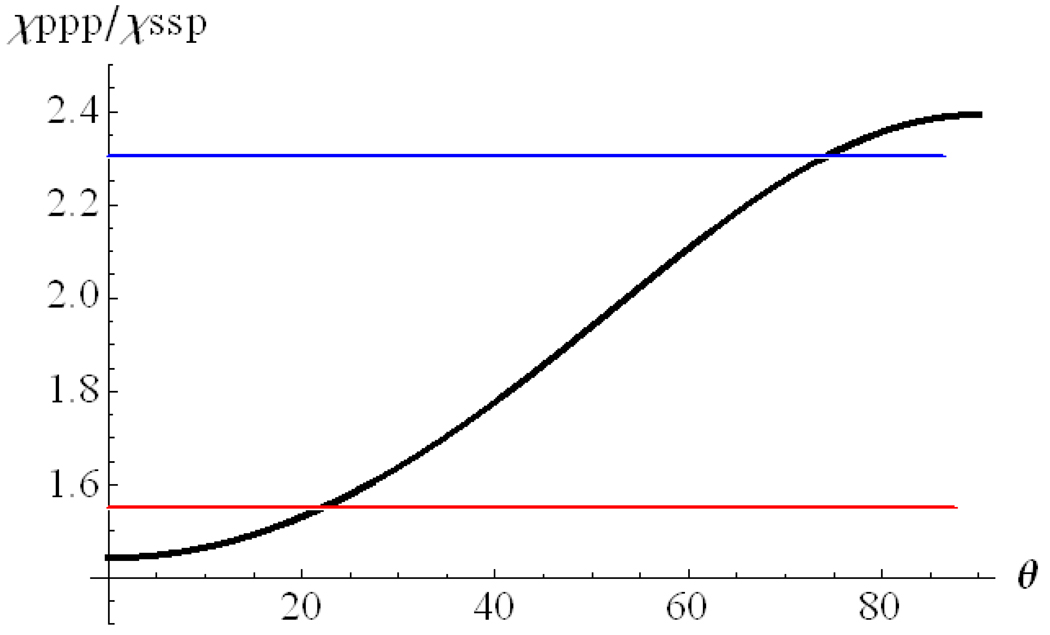
The correlation between the ratio χppp/ χssp and the peptide orientation angle θ for Magainin 2 is plotted in Figure 3. Details regarding how to deduce such a correlation can be found in reference 42. According to the measured SFG signal, the χppp/χssp ratio for Magainin 2 in the POPG/POPG bilayer is about 1.55. It can be deduced from Figure 3 that Magainin 2 adopts a transmembrane orientation in POPG/POPG bilayers (Table 1). Quantitatively, the tilt angle (θ) between the helical principal axis of the Magainin 2 molecule and the POPG/POPG bilayer surface normal was found to be around 22 degrees if a delta-orientation distribution is assumed.
Figure 3.
Relationship between the χppp/ χssp ratio and the α-helix orientation angle of Magainin 2.
Table 1.
Fitting parameters for the SFG amide I signal collected from a POPG/POPG bilayer in contact with a 800 nM Magainin 2 solution.
| 1657 cm−1 | Amplitude | Damping coefficient | Χppp/Χssp | Χnonresonance |
|---|---|---|---|---|
| ppp | 480 | 13.5 | 1.55 | 1.42 |
| ssp | 287 | 12.5 | −1.13 |
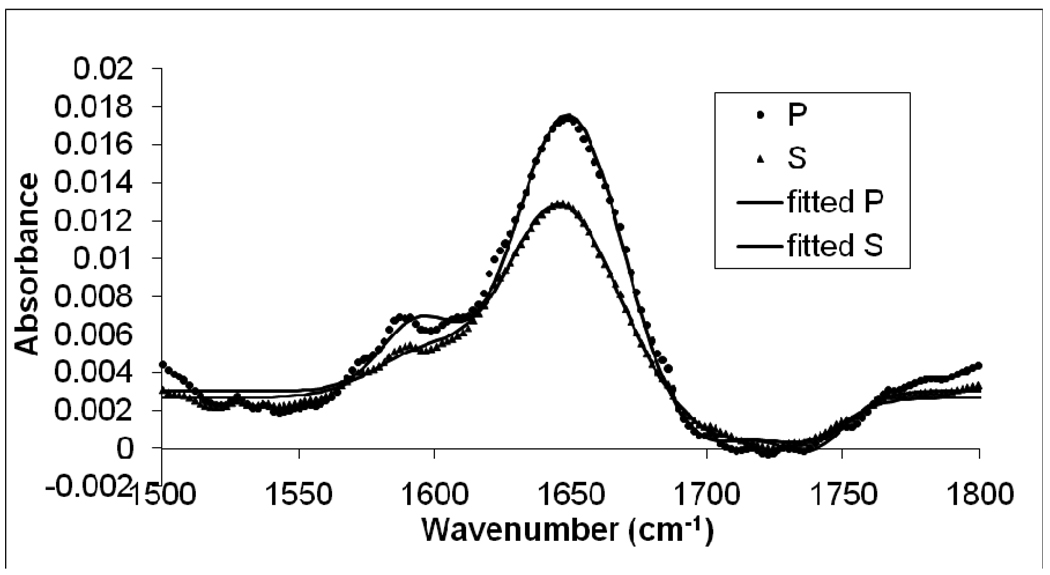
ATR-FTIR was used as a supplemental technique to our SFG measurements. As mentioned above, the amide I signal of an α-helical peptide is centered at about 1655 cm−1. Due to the strong H2O bending mode in this frequency range, which may complicate the amide I ATR-FTIR signal analysis, a Magainin 2 D2O solution was used in the ATR-FTIR study. The amide I signal undergoes a slight red-shift for α-helical peptides when D2O is used. In the ATR-FTIR experiment with Magainin 2 and a POPG/POPG lipid bilayer in a D2O solution, a peak maximum at 1652 cm−1 was observed, indicating a Magainin 2 α-helical conformation in the POPG/POPG bilayer (Figure 4).46 The peak center position is in good agreement with a recent study of Magainin 2 interacting with DPPG monolayers using ER-FTIR.4
Figure 4.
Polarized ATR-FTIR spectra of the C=O stretching frequency region collected from a POPG/POPG bilayer in contact with a 800 nM Magainin 2 solution.
The ATR-FTIR spectra were fitted using Lorentzian functions. While fitting the ATR-FTIR amide I signal of Magainin 2, a minor peak at around 1644 cm−1 was also included to account for the C=O bonds that adopted a random coil structure for the “insolvent” Magainin 2 molecules that did not fold into α-helical structures.
Using the polarized ATR-FTIR measurement, the dichroic ratio of the 1652 cm−1 peak of Magainin 2 (800 nM) in a POPG/POPG lipid bilayer was determined to be 2.79, which gives the order parameter Sθ a value of 0.818. The order parameter Sθ can be calculated by using the following equation:
| (4) |
where α is 42 degrees and Ex, Ey and Ez are the electric field amplitudes in the x, y and z directions. The average angle θ between the helical axis of the Magainin 2 molecule and the bilayer surface normal was calculated to be approximately 20 degrees if a delta-orientation distribution is assumed. This is in excellent agreement with the SFG data. As we discussed in our previous publications, SFG measures <cosθ> and <cos3θ> while ATR-FTIR measures <cos2θ>.28 Since SFG and ATR-FTIR measure different orientation parameters, the excellent agreement between the two methods indicates that Magainin 2 adopts a well-defined orientation (a delta-distribution or an orientation distribution with a narrow width) in the POPG/POPG bilayer. If the orientation distribution is not narrow, the results should be substantially different when deduced from the different measured parameters, <cosθ>, <cos2θ> and <cos3θ>. Here both SFG and ATR-FTIR studies show that Magainin 2 adopts a transmembrane orientation when its concentration is 800 nM, different from what was observed when the concentration is 200 nM.
Our spectroscopic measurements match the published results from Molecular Dynamics simulations performed on a constructed Magainin 2 toroidal-pore model.14 In this simulation, a Magainin pore that consisted of five Magainin 2 molecules, 138 1-palmitoyl-2-oleoylphosphatidylethanolamine (POPE) molecules and 46 POPG molecules was left to equilibrate for 250 ps. During this period of time the reorientation of Magainin 2 molecules was observed. Magainin 2 molecules lining the pores were found to tilt at about 21 degrees from the membrane normal.
4.1.2 Magainin 2 in a POPC/POPC lipid bilayer
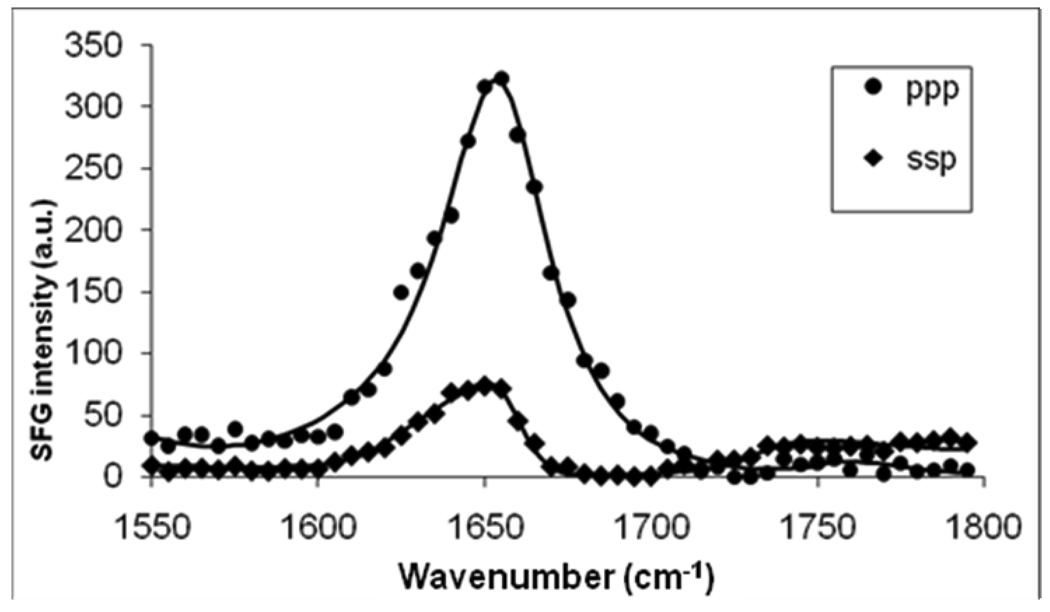
A POPC/POPC bilayer was used as a representation of the mammalian cell membrane. Different from POPG, POPC is a zwitterionic lipid. For this set of experiments, a higher Magainin 2 concentration of 2.0 µM was used. At this peptide concentration, discernable SFG amide I signal was detected, allowing for a reliable analysis of the peptide orientation (Figure 5). A supplemental ATR-FTIR experiment at the same concentration of Magainin 2 (2.0 µM) was also carried out, but no amide I signal was detected (data not shown). This is likely due to the fact that the Magainin 2 coverage on the POPC/POPC bilayer was not high enough to produce detectable ATR-FTIR signal.
Figure 5.
SFG ppp and ssp spectra of the C=O stretching frequency region collected from a POPC/POPC bilayer in contact with a 2.0 µM Magainin 2 solution.
From the SFG ssp and ppp polarized spectra (Figure 5), the average tilt angle (θ) of Magainin 2 in the POPC/POPC bilayer was determined to be ~75 degrees if a delta-distribution orientation is assumed (Table 2), which is very different from that in the POPG/POPG bilayer. This result strongly agrees with previous findings in the literature stating that Magainin 2 lies down on the surface of l-Palmitoyl-2-stearoyl-(n-doxyl)-α-phosphatidylcholine [n-doxyl-PCs (n = 5, 10, and 12)] lipid vesicles at an angle of approximately 79 degrees ± 5 degrees relative to the surface normal.33, 37, 49
Table 2.
Fitting parameters for the SFG amide I signal collected from a POPC/POPC bilayer in contact with a 2.0 µM Magainin 2 solution.
| 1657 cm−1 | Amplitude | Damping coefficient | Χppp/Χssp | Χnonresonance |
|---|---|---|---|---|
| ppp | 350 | 20 | 2.30 | −2.32 |
| ssp | 152.5 | 20 | 3.5 |
4.2 SFG spectra of POPG/POPG and POPC/POPC lipid bilayers
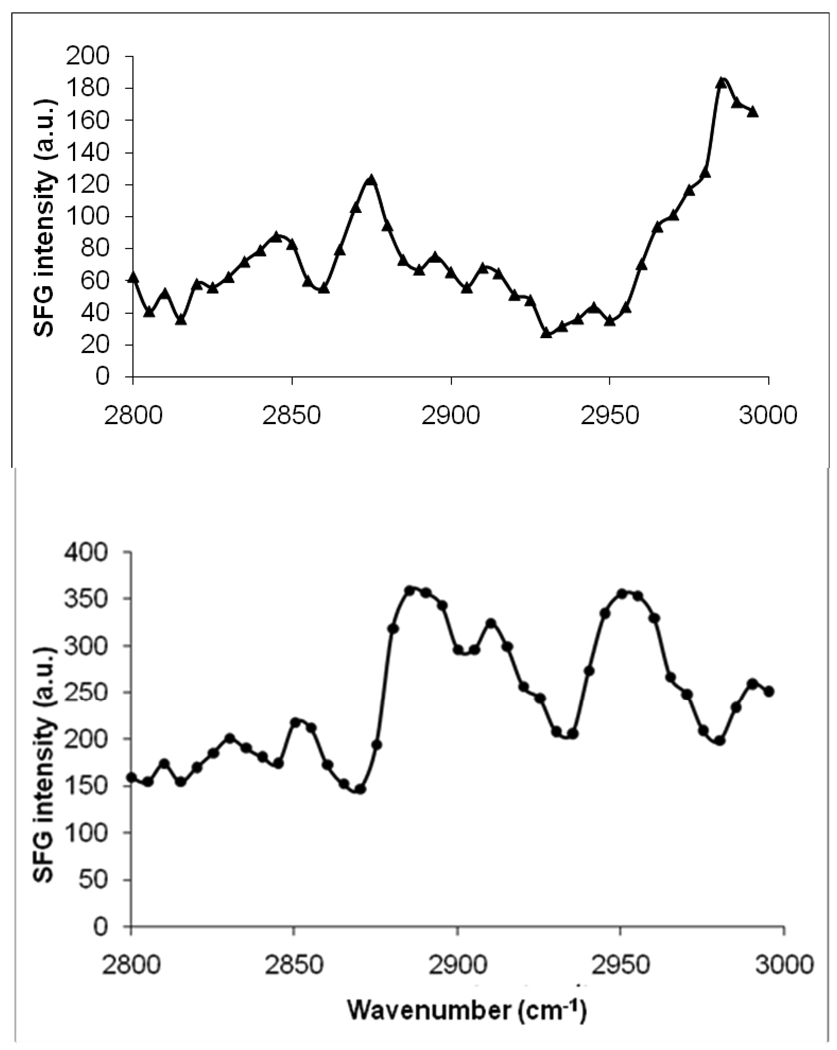
The behavior of the lipids was monitored in our SFG experiments by the observation of SFG spectra in the C-H stretching frequency regime (2800 – 3000 cm−1). Magainin 2 should not contribute substantial SFG signal in the C-H stretching spectral region.4 As displayed in Figures 6, SFG spectral features in the C-H stretching region are significantly different between POPG/POPG and POPC/POPC lipid bilayers before the Magainin 2 interaction. The weaker SFG signal of the neutral POPC/POPC bilayer shown in Figure 6 (spectrum a) compared to that of the charged POPG/POPG bilayer (spectrum b) indicates that lipid bilayers with zwitterionic headgroups are more ordered and therefore more symmetrical. The better order of the POPC/POPC bilayer compared to POPG/POPG bilayer in water might be due to the different interactions between the water molecules and the headgroups of lipid molecules. For lipids that are in fluid phase at room temperature, it is difficult to quantitatively investigate the average orientation of the lipid chain due to the rapid flip-flop and lateral displacement of the lipid molecules. The discussion below is therefore only qualitative.
Figure 6.
SFG spectra of the C-H stretching frequency region collected from a. POPC/POPC bilayer (top) and b. POPG/POPG bilayer (bottom) before interaction with Magainin 2.
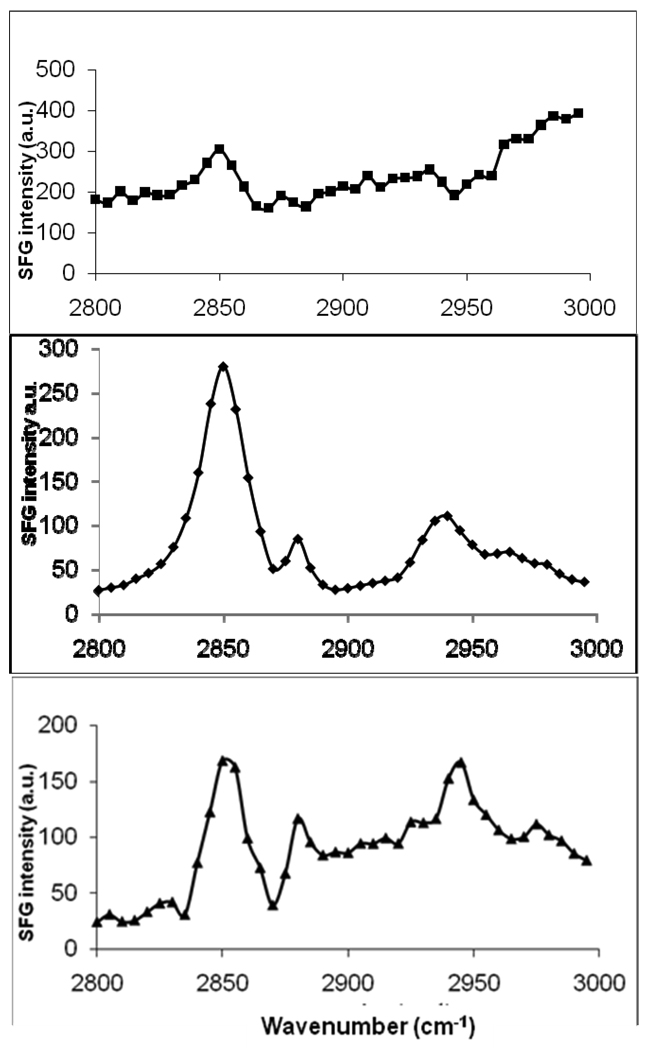
Similar spectral features can be seen in Figure 7 for both the POPG/POPG bilayer (with 200 nM Maiganin 2, spectrum 7b) and the POPC/POPC bilayer (with 2.0 µM Magainin 2, spectrum 7a). This striking similarity might indicate that similar interactions are taking place in both cases. In Section 4.1.2, we indicated that Magainin 2 molecules orient relatively parallel to the POPC/POPC bilayer surface. It is therefore likely that Magainin 2 molecules adopt a similar orientation on the POPG/POPG bilayer at low concentrations. This interpretation agrees with what was discussed regarding the amide I band analysis (i.e. low signal would indicate a parallel orientation). Because there is a change in the lipid C-H stretching signal, Magainin 2 molecules must adsorb to the bilayer, but only with a low surface coverage.
Figure 7.
SFG spectra of the C-H stretching frequency region collected from a. POPC/POPC bilayer in contact with 2.0 µM Magainin 2 solution (top); b. POPG/POPG bilayer in contact with 200 nM Magainin 2 solution (middle); c. POPG/POPG bilayer in contact with 800 nM Magainin 2 solution.
In Figure 7, when comparing the two spectra of POPG/POPG with 800 nM Magainin 2 (spectrum c) and POPC/POPC with 2.0 µM Magainin 2 (spectrum a), it can be seen that they have similar spectral features as well, except for the peak at 2880 cm−1 representing the symmetric stretch of the methyl group. In the POPG/POPG bilayer, a dramatic drop in the overall spectral intensity was observed after the addition of peptide (compare spectrum 7c to spectrum 6b). A possible interpretation for this would be the formation of a toroidal pore, which would cause the lipid side chains to tilt and form a connection between the two leaflets. Because of the rapid flip-flop that would be induced from this process, this pore lining phenomenon would significantly enhance the symmetry of the bilayer and reduce overall POPG/POPG bilayer SFG signal. In addition to this, the CH2 symmetric stretch peak at 2850 cm−1 could arise from the lipid side chains that are tilted along the pores.
5. Conclusion
We have successfully applied SFG and ATR-FTIR to measure the average tilt angle of Magainin 2 molecules in negatively charged (POPG/POPG) and zwitterionic (POPC/POPC) lipid bilayers in the fluid phase. It was found that SFG has a much better detection limit than ATR-FTIR, and can therefore be used to study interfacial molecules when the surface coverage is much lower. The SFG orientation analysis on α-helical structures used here is based on a methodology developed in our lab, which was summarized in detail in a recent paper.42 For the cases where both SFG and ATR-FTIR signals can be detected, SFG and ATR-FTIR can measure different orientation parameters. The SFG results could be well correlated to the ATR-FTIR conclusions, which demonstrated the reliability of the measurements. This also further validates our SFG orientation analysis methodology presented in reference 42. All the experiments were performed in situ under biologically relevant conditions. The modes of action of Magainin 2 on these two different model membranes for bacterial cells and mammalian cells were discussed according to the deduced average orientation of the peptide molecules and the investigation of the lipid bilayer SFG signals. The transmembrane orientation of Magainin 2 molecules and the possible rapid flip-flop induced led to the conclusion that the peptide most likely forms toroidal pores in POPG/POPG lipid bilayers at a peptide concentration of 800 nM. On the other hand, the nearly parallel orientation of the peptides and the noticeable disturbance of the lipid chains are evident for the carpet-like mechanism when Magainin 2 interacts with a POPC/POPC bilayer. This research, along with our previous SFG studies on lipid bilayers,28,50–54 demonstrate that SFG is a powerful technique in elucidating the molecular interactions between various molecules and model cell membranes in situ.
Acknowledgement
This research is supported by National Institute of Health (1R01GM081655-01A2) and Office of Naval Research (N00014-02-1-0832 and N00014-08-1-1211). SVLC acknowledges the Molecular Biophysics Training Grant from the University of Michigan and the NSF Graduate Research Fellowship.
References
- 1.Maloy WL, Kari UP. Biopolymers. 1995;37:105–122. doi: 10.1002/bip.360370206. [DOI] [PubMed] [Google Scholar]
- 2.Zasloff M, Martin B, Chen HC. Proc. Natl. Acad. Sci. USA. 1988;85:910–913. doi: 10.1073/pnas.85.3.910. [DOI] [PMC free article] [PubMed] [Google Scholar]
- 3.Maloy WL, Kari UP. Biopolymers. 1995;37:105–122. doi: 10.1002/bip.360370206. [DOI] [PubMed] [Google Scholar]
- 4.Lad MD, Birembaut F, Clifton LA, Frazier RA, Webster JRP, Green RJ. Biophys. J. 2007;92:3575–3586. doi: 10.1529/biophysj.106.097774. [DOI] [PMC free article] [PubMed] [Google Scholar]
- 5.Ludtke S, He K, Heller W, Harroun T, Yang L, Huang H. Biochemistry. 1996;35:13723–13728. doi: 10.1021/bi9620621. [DOI] [PubMed] [Google Scholar]
- 6.Chen FY, Lee MT, Huang HW. Biophys. J. 2003;84:3751–3758. doi: 10.1016/S0006-3495(03)75103-0. [DOI] [PMC free article] [PubMed] [Google Scholar]
- 7.Ludtke S, He K, Huang H. Biochemistry. 1995;35:16764–16769. doi: 10.1021/bi00051a026. [DOI] [PubMed] [Google Scholar]
- 8.Imura Y, Choda N, Matsuzaki K. Biophys. J. 2008;95:5757–5765. doi: 10.1529/biophysj.108.133488. [DOI] [PMC free article] [PubMed] [Google Scholar]
- 9.Hallock JK, Lee DK, Ramamoorthy A. Biophys. J. 2003;84:3052–3060. doi: 10.1016/S0006-3495(03)70031-9. [DOI] [PMC free article] [PubMed] [Google Scholar]
- 10.Mecke A, Lee DK, Ramamoorthy A, Orr BG, Banaszak Holl MM. Biophys. J. 2005;89:4043–4050. doi: 10.1529/biophysj.105.062596. [DOI] [PMC free article] [PubMed] [Google Scholar]
- 11.Gregory SM, Pokorny A, Almeida PFF. Biophys. J. 2009;96:116–131. doi: 10.1016/j.bpj.2008.09.017. [DOI] [PMC free article] [PubMed] [Google Scholar]
- 12.Matsuzaki K, Murase O, Tokuda H, Funakoshi S, Fujii N, Miyajima K. Biochemistry. 1994;33:3342–3349. doi: 10.1021/bi00177a027. [DOI] [PubMed] [Google Scholar]
- 13.Matsuzaki K, Murase O, Fujii N, Miyajima K. Biochemistry. 1996;35:11361–11368. doi: 10.1021/bi960016v. [DOI] [PubMed] [Google Scholar]
- 14.Murzyn K, Pasenkiewicz-Gierula M. J. Mol. Model. 2003;9:217–224. doi: 10.1007/s00894-003-0127-z. [DOI] [PubMed] [Google Scholar]
- 15.Illya G, Deserno M. Biophys. J. 2008;95:4163–4173. doi: 10.1529/biophysj.108.131300. [DOI] [PMC free article] [PubMed] [Google Scholar]
- 16.Matsuzaki K. Biochim. Biophys. Acta. 1998;1376:391–400. doi: 10.1016/s0304-4157(98)00014-8. [DOI] [PubMed] [Google Scholar]
- 17.Wieprecht T, Beyermann M, Seelig J. Biochemistry. 1999;38:10377–10387. doi: 10.1021/bi990913+. [DOI] [PubMed] [Google Scholar]
- 18.Matsuzaki K, Murase O, Tokuda H, Funakoshi S, Fujii N, Miyajima K. Biochemistry. 1994;33:3342–3349. doi: 10.1021/bi00177a027. [DOI] [PubMed] [Google Scholar]
- 19.Miranda PB, Shen YR. J. Phys. Chem. B. 1999;103:3292–3307. [Google Scholar]
- 20.Kim J, Somorjai GA. J. Am. Chem. Soc. 2003;125:3150–3158. doi: 10.1021/ja028987n. [DOI] [PubMed] [Google Scholar]
- 21.Kim J, Cremer PS. Chem. Phys. Chem. 2001;2:543–546. doi: 10.1002/1439-7641(20010917)2:8/9<543::AID-CPHC543>3.0.CO;2-5. [DOI] [PubMed] [Google Scholar]
- 22.Baldelli S. Acc. Chem. Res. 2008;41:421–431. doi: 10.1021/ar700185h. [DOI] [PubMed] [Google Scholar]
- 23.Voges AB, Al-Abadleh HA, Musorrariti MJ, Bertin PA, Nguyen ST, Geiger FM. J. Phys. Chem. B. 2004;108:18675–18682. [Google Scholar]
- 24.Li QF, Hua R, Chea IJ, Chou KC. J. Phys. Chem. B. 2008;112:694–697. doi: 10.1021/jp072147j. [DOI] [PubMed] [Google Scholar]
- 25.Ye HK, Gu ZY, Gracias DH. Langmuir. 2006;22:1863–1868. doi: 10.1021/la052030r. [DOI] [PubMed] [Google Scholar]
- 26.Yatawara AK, Tiruchinapally G, Bordenyuk AN, Andreana PR, Benderskii AV. Langmuir. 2009;25:1901–1904. doi: 10.1021/la803113h. [DOI] [PubMed] [Google Scholar]
- 27.Perry A, Ahlborn H, Space B, Moore PB. J. Chem. Phys. 2003;118:8411–8419. [Google Scholar]
- 28.Chen X, Wang J, Boughton AP, Kristalyn CB, Chen Z. J. Am. Chem. Soc. 2007;129:1420–1427. doi: 10.1021/ja067446l. [DOI] [PubMed] [Google Scholar]
- 29.Tamm LK, Mcconnell HM. Biophys. J. 1985;47:105–113. doi: 10.1016/S0006-3495(85)83882-0. [DOI] [PMC free article] [PubMed] [Google Scholar]
- 30.Thompson NL, Palmer AG. Comm. Mol. Cell. Biophys. 1988;5:39–56. [Google Scholar]
- 31.Wang J, Chen CY, Buck SM, Chen Z. J. Phys. Chem. B. 2001;105:12118–12125. [Google Scholar]
- 32.Wang J, Paszti Z, Even MA, Chen Z. J. Am. Chem. Soc. 2002;124:7016–7023. doi: 10.1021/ja012387r. [DOI] [PubMed] [Google Scholar]
- 33.Matsuzaki K, Harada M, Handa T, Funakoshi S, Fujii N, Yajima H, Miyajima K. Biochim. Biophys. Acta. 1989;981:130–134. doi: 10.1016/0005-2736(89)90090-4. [DOI] [PubMed] [Google Scholar]
- 34.Jackson M, Mantsch HH, Spencer J. Biochemistry. 1992;31:7289–7293. doi: 10.1021/bi00147a012. [DOI] [PubMed] [Google Scholar]
- 35.Wieprecht T, Dathe M, Schumann M, Krause E, Beyermann M, Bienert M. Biochemistry. 1996;35:10844–10853. doi: 10.1021/bi960362c. [DOI] [PubMed] [Google Scholar]
- 36.Williams RW, Starman R, Taylor KMP, Gable K, Beeler T, Zasloff M. Biochemistry. 1990;29:4490–4496. doi: 10.1021/bi00470a031. [DOI] [PubMed] [Google Scholar]
- 37.Matsuzaki K, Harada M, Funakoshi S, Fujii N, Miyajima K. Biochim. Biophys. Acta. 1991;1063:162–170. doi: 10.1016/0005-2736(91)90366-g. [DOI] [PubMed] [Google Scholar]
- 38.Bechinger B, Zasloff M, Opella SJ. Prot. Sci. 1993;2:2077–2084. doi: 10.1002/pro.5560021208. [DOI] [PMC free article] [PubMed] [Google Scholar]
- 39.Hirsh DJ, Hammer J, Maloy WL, Blazyk J, Schaefer J. Biochemistry. 1996;35:12733–12741. doi: 10.1021/bi961468a. [DOI] [PubMed] [Google Scholar]
- 40.Wang J, Paszti Z, Even MA, Chen Z. J. Phys. Chem. B. 2004;108:3625–3632. [Google Scholar]
- 41.Wang J, Lee SH, Chen Z. J. Phys. Chem. B. 2008;112:2218–2290. doi: 10.1021/jp077556u. [DOI] [PubMed] [Google Scholar]
- 42.Nguyen K, Le Clair SV, Ye S, Chen Z. J. Phys. Chem. B. submitted. [Google Scholar]
- 43.Imura Y, Nishida M, Matsuzaki K. Biochim. Biophys. Acta. 2007;1768:2578–2585. doi: 10.1016/j.bbamem.2007.06.013. [DOI] [PubMed] [Google Scholar]
- 44.Anisimova EV, Badyakina AO, Vasil’eva NV, Nesmeyanova MA. Microbiology. 2005;74:147–152. [Google Scholar]
- 45.Brasseur R. J. Biol. Chem. 1991;266:16120–16127. [PubMed] [Google Scholar]
- 46.Tamm LK, Tatulian SA. Q. ReV. Biophys. 1997;30:365–429. doi: 10.1017/s0033583597003375. [DOI] [PubMed] [Google Scholar]
- 47.Axelsen PH, Kaufman BK, McElhaney RN, Lewis RNAH. Biophys. J. 1995;69:2770–2781. doi: 10.1016/S0006-3495(95)80150-5. [DOI] [PMC free article] [PubMed] [Google Scholar]
- 48.Axelsen PH, Citra MJ. Prog. Biophys. Molec. Biol. 1996;66:227–253. doi: 10.1016/s0079-6107(97)00007-2. [DOI] [PubMed] [Google Scholar]
- 49.Bechinger B, Kim Y, Chirlian LE, Gesell J, Neumann JM, Montal M, Tomich J, Zasloff M, Opella SJ. J. Biomol. NMR. 1991;1:167–173. doi: 10.1007/BF01877228. [DOI] [PubMed] [Google Scholar]
- 50.Ye S, Nguyen K, Le Clair SV, Chen Z. J. Struct. Biol. 2009 doi: 10.1016/j.jsb.2009.03.006. in press. [DOI] [PMC free article] [PubMed] [Google Scholar]
- 51.Chen X, Boughton AP, Tesmer JJG, Chen Z. J. Am. Chem. Soc. 2007;129:12658–12659. doi: 10.1021/ja075542w. [DOI] [PubMed] [Google Scholar]
- 52.Chen X, Wang J, Kristalyn CB, Chen Z. Biophys. J. 2007;93:866–875. doi: 10.1529/biophysj.106.099739. [DOI] [PMC free article] [PubMed] [Google Scholar]
- 53.Chen X, Chen Z. Biochim. Biophys. Acta. 2006;1758:1257–1273. doi: 10.1016/j.bbamem.2006.01.017. [DOI] [PubMed] [Google Scholar]
- 54.Chen X, Tang H, Even MA, Wang J, Tew GN, Chen Z. J. Am. Chem. Soc. 2006;128:2711–2714. doi: 10.1021/ja057029t. [DOI] [PubMed] [Google Scholar]


