Abstract
DNA polymerases are a family of enzymes responsible for regulating DNA replication and repair, which in turn maintains the integrity of the genome. However, despite intensive kinetic, crystallographic and computational studies, elucidation of the detailed enzymatic mechanism still presents a significant challenge. We recently developed an alternative strategy for exploring the fidelity and mechanism of DNA polymerases, by probing leaving group effects on nucleotidyl transfer using a series of dGTP bisphosphonate analogues in which the β, γ-bridging oxygen was replaced by a series of substituted methylene groups (X=CYZ, where Y,Z=H, halogen or other substituent). Pre-steady state kinetic measurements of DNA polymerase-catalyzed incorporation of correctly base paired (R) and mispaired (W) analogues demonstrated a strong linear free energy relationship (LFER) between the polymerase rate constant (kpol) and the highest pKa of the free bisphosphonic acid corresponding to the leaving group. However, unexpectedly, the data segregated into two distinctly different linear correlations depending on the nature of the substituent. The discrepancy between the two lines was considerably greater when the dGTP analogue formed an incorrect (G•T) rather than a correct (G•C) base pair, although the reason for this phenomenon remains unexplained. Here, we have evaluated the complete free energy surfaces for bisphosphonate hydrolysis in aqueous solution and evaluated the corresponding LFER. Our study, which employs several alternative solvation models, finds a split of the calculated LFER for the mono- and dihalogen compounds into two parallel lines, reflecting their behavior in the polymerase-catalyzed condensation reaction. We suggest that the division into two linear subsets may be a generalized solvation phenomenon involving the overall electrostatic interaction between the substrates and enzyme and would be observed in solution in the absence of the enzyme. In contrast, the amplified differences between the LFER lines for the incorporation of matched and mismatched deoxynucleotides could arise from differences in the electrostatic interaction between the TS charges in the polymerase active site. An understanding of the mechanism of this reaction in solution could thereby provide a stepping-stone for understanding the factors governing the fidelity of DNA polymerases.
Keywords: DNA Polymerases, Phosphate Hydrolysis, Free Energy Surfaces, Reaction Mechanisms
I. INTRODUCTION
Since the discovery of DNA polymerase in Escherichia coli more than 50 years ago(1, 2), this enzyme, including both it’s high and low fidelity forms(3, 4), has been under continuing and intense study to improve our understanding of its structures and functions. As the field has matured, explorations have moved beyond individual isolated polymerases to encompass interactions with accessory subunits, including protein complexes involved in DNA replication and repair (e.g. Refs. (5–7)). Nevertheless, a comprehensive characterization of the enzymatic mechanism has not yet been achieved, and remains a challenge to biochemists.
A detailed understanding of the mechanisms governing DNA synthesis is essential to establish at the molecular level not only how correctly paired deoxyribonucleotides are incorporated into DNA, but, equally importantly, how the polymerase discriminates against incorporating non-Watson-Crick base pairs. X-ray crystallographic studies, in which polymerase/primer-template/dNTP ternary complexes are captured at high resolution(8–11) show how correctly and incorrectly paired dNTPs are aligned within the polymerase active site. These geometric “snapshots” are unquestionably important in deducing how dNTP-p/t DNA orientations occurring in the polymerase ground state may either facilitate efficient phosphodiester bond formation for W-C base pairs or impede the incorporation of non-W-C base pairs(11), but the nature of the activated structures occurring on the catalytic reaction pathway cannot be deduced from the structural studies without additional theoretical “interpolations”(12–15). Such theoretical studies can greatly benefit from experimental information about the mechanism of the incorporation reaction. However, extracting such information in a unique way is challenging.
Recently, we developed a strategy to explore mechanism and fidelity from the perspective of the polymerase transition state. The approach is based on probing the nucleotidyl transfer mechanism for leaving group effects (downstream from the transition state) using a series of dNTP bisphosphonate analogues in which the β, γ-bridging oxygen of pyrophosphate was replaced by a series of substituted-methylene groups(16, 17) (X = CYZ, where Y,Z = H, halogen or other substituent: Fig. 1). For example, using the set Y,Z = H, F, Cl and Br, the electrostatic properties of the bisphosphonate moiety can be tuned to provide a wide dynamic range in the basicity of the new oxyanion formed by Pα-O bond cleavage, which should inversely reflect the pKa values for the corresponding free bisphosphonic acids(11, 18). We have proposed the construction of a linear free energy relationship (LFER) correlating the logarithm of the catalytic rate constant kpol to the highest leaving group pKa for such a series of synthetic dNTP analogues as a means to directly probe the energetics of the chemical steps of nucleotidyl transfer that relate the height of leaving group elimination barriers to other steps in the reaction pathway(16, 17).
Figure 1.
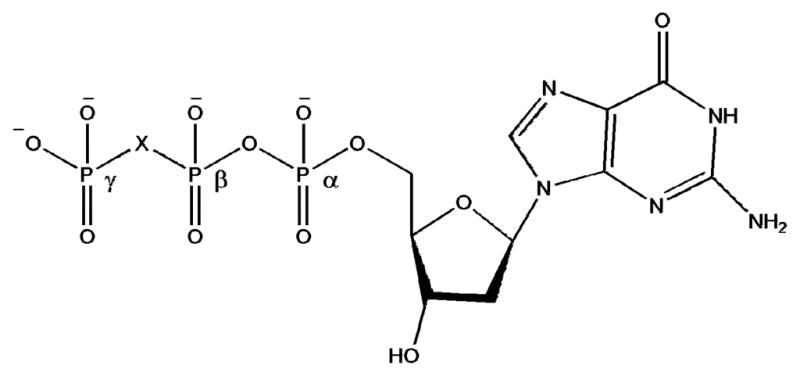
Structure of dGTP and β,γ-substituted analogues. X=CF2, CFCl, CCl2, O, CHF, CBr2, CHCl, CHBr and CH2(16, 17).
To implement this new approach, we have examined the LFER for human DNA polymerase β using a series of dGTP analogs (Fig. 1) constructed from bisphosphonates having pKa4s spanning a range of 7.8–10.5(16, 17). The G analogs were either correctly incorporated opposite template C or misincorporated opposite T. The resulting plots of log kpol versus log pKa are reproduced in Fig. 2.
Figure 2.
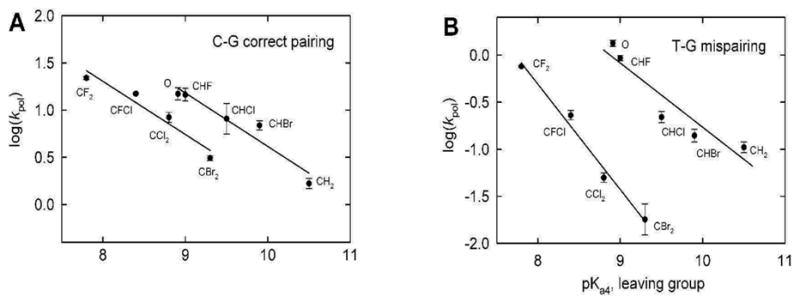
LFER for dGTP and analogues, incorporated opposite (A) the correct template base, C, and (B) the mispairing template base, T. This figure was originally presented in Ref. (17).
The data exhibited strong linear correlations between log kpol and leaving group bisphosphonic acid pKa4 for correct (G•C, denoted R in the text) (Fig. 2A) and incorrect (G•T, denoted W in the text) base pairs (Fig. 2B). This result is expected in an LFER model in which a single activation barrier is rate-limiting for the chemical step for correct and incorrect substrates. However, the data unexpectedly segregated into two different linear correlations, one for a group comprised of the natural substrate with the unsubstituted methylene and monohalomethylene analogues, and the other for the dihalomethylene analogues, with the difference being significantly greater for the mispairs – i.e., the LFER plots were fidelity-dependent (Fig. 2). This remarkable difference between the C•G and T•G incorporation rates for the monohalo - vs. the dihalomethylene analogue groups, as well as the diminished catalytic activity exhibited with the dihalogen-bridging analogs, is unexplained(16, 17). It should be noted that monohalo nucleotides are mixtures of two diasteromeric forms, differing in configuration at the P-C-P carbon. However, were one form less effective as a substrate than the other the observed turnover rates would be relatively decreased, not increased, even if saturating substrate concentrations were not used. We have considered several possibilities to account for the diminished activity of the dihalomethylene compounds in the enzymatic system, e.g., leaving group elimination might be hindered by intramolecular repulsion between the negative charge developing on the αβ oxygen and the pro-S halogen(17) or alternatively, the halogens may engage in sterically debilitating steric/electrostatic interactions with nearby amino acid side chains in the pol β active site(17), but neither of these rationales is fully convincing. Thus it is important to consider the possibility that the disparity in rates of release of the mono- and dihalobisphosphonate leaving groups reflects, at least to some extent, a trend that already exists in the uncatalyzed reference reaction in solution.
To address this issue, it is necessary to explore the mechanism of the uncatalyzed solution reaction in order to understand the origin of the LFER in the enzyme. Such a study is also important for understanding the catalytic power of the enzyme, which reflects the difference between the reaction in the enzyme and in solution. Furthermore, characterisation of the solution reaction is crucial for the calibration and validation of theoretical models that are being used for studying enzymatic reactions, as was demonstrated in previous studies(19). However, studying phosphate ester hydrolysis in solution is a difficult problem, as even the solution reaction can proceed through a variety of different reaction mechanisms (see e.g. Refs. (20–22)). Broadly speaking, phosphate hydrolysis can proceed via one of two mechanistic extremes, that is, pathways that can be associative or dissociative in nature, depending on the degrees of bond breaking to the leaving group and bond formation to the nucleophile, respectively, and, despite decades of research, the precise nature of both the solution and enzyme-catalysed reactions remain controversial(23–33).
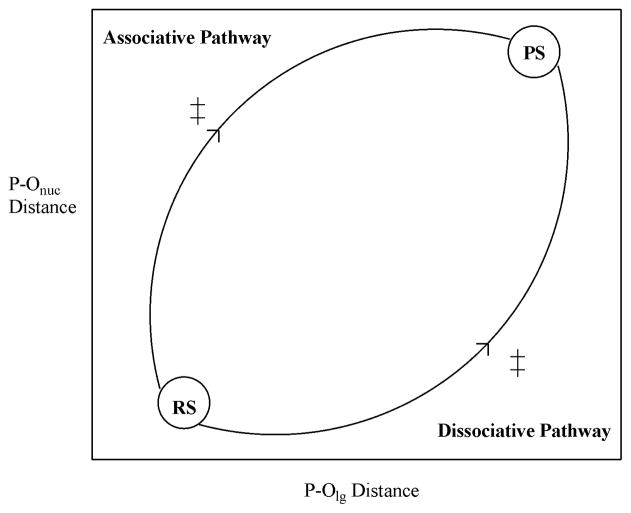
Computational studies that map the full energy surface(19, 21, 22, 34, 35) for phosphate hydrolysis rather than examining isolated transition states have demonstrated that it is possible to accurately reproduce the LFER for phosphate hydrolysis in solution. Such studies examine the free energy surface by means of More O’Ferrall-Jencks (MFJ) plots(36, 37), a sample of which is shown in Fig. 3. MFJ plots are projections of the full free energy surface defined in terms of two reaction coordinates. At each point on the plot, these coordinates are frozen while all other degrees of freedom are allowed to optimise without constraints. The full MFJ can thus be obtained by careful reaction coordinate pushing, and solvation can be simulated using a continuum model.
Figure 3.
Sample More-O’Ferrall-Jencks plot(36, 37). RS and PS denote reactant and product states respectively and ≠ denotes a transition state, which can be either stepwise (AN+DN or DN+AN) or concerted (AN+DN).
There are a number of advantages to using this approach. Firstly, it allows us to identify and directly compare different viable mechanisms in the presence of the same nucleophile and substrate. Secondly, the MFJ can be used to identify the approximate location of key stationary points, the precise geometry of which can then be obtained by unconstrained geometry optimisations. Finally, it should be noted that it can be quite difficult to study the relevant reference reaction in solution for an enzymatic reaction experimentally, as the enzyme can restrict the reaction in various ways order to follow a specific mechanism, whereas in solution there are multiple mechanistic possibilities. For instance, in the case of the system studied here it is quite possible that experimentally, the nucleophile does not attack in the same position as in Pol β, but rather that the terminal (γ) phosphate would react much faster and as such it would only be possible to obtain an upper limit for P – O cleavage between the α and β phosphates. However, it is essential to model precisely the same reaction as in the enzymatic system when studying the reference reaction, and this is an advantage of using a computational approach, where one can effectively place constraints on the reaction in such a way as to accurately reproduce the correct reference state for the enzymatic reaction.
To address the issue of whether the disparity in rates of release of the mono- and dihalobisphosphonate leaving groups reflects, at least to some extent, a trend that already exists in the uncatalyzed reference reaction in solution, and in order to gain more information about the reference solution reaction in general, we have carried out a computational analysis of the hydrolysis of these compounds in solution, using a variety of solvation models. Our study focused on the change in the rate of hydrolysis of the above series as a function of the observed of pKa for the corresponding bisphosphonic acid, which he have examined by generating the full free energy surfaces for each system studied. The calculations indicated that the trend observed in the LFER of the reaction in pol β already exists in solution.
II. THEORETICAL BACKGROUND
The main focus of this work is to study the effect of halogen substitution at the β,γ-bridging position of this series of dGTP analogues on the basic chemistry of these phosphate derivatives in solution rather than the reproduction of absolute energetics; therefore, we have used a simplified series of model compounds, in which the nucleoside is replaced by a methyl group, as shown in Fig. 4. The general methodologies are described in our earlier studies(19, 21, 22, 34, 35).
Figure 4.
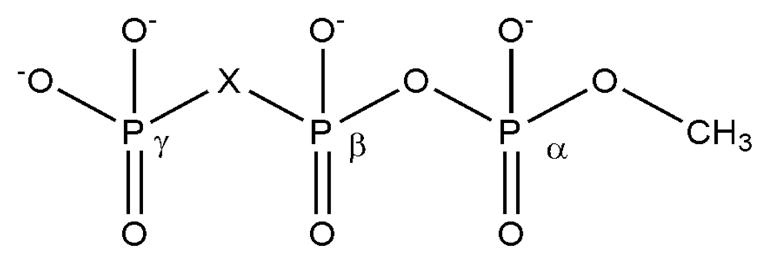
Model compounds. X= CF2, CFCl, CCl2, O, CHF, CBr2, CHCl, CHBr and CH2.
Separate energy surfaces were generated for each of the compounds in the series, both in the gas-phase and in solution. In each case, the reaction surface was defined in terms of two reaction coordinates: the phosphorus oxygen distance to the leaving group (P–Olg, Fig. 3, x-axis) and nucleophile (P–Onuc, Fig. 3, y-axis). At each point on the plot, only these two degrees of freedom were constrained, and all other degrees of freedom were allowed to freely optimize. P–Olg distances where scanned in the range of 1.6–3.2Å (in 0.2Å increments), and P–Onuc distances were scanned in the range of 1.65 to 3.0 Å (in 0.15Å increments). It should be noted that, even though in principle the reaction could proceed via either an inline (nucleophile attacking from the opposite face as the departing leaving group) or a non-inline (nucleophile attacking from the same face as the departing leaving group) mechanism (though both pathways have been suggested to proceed with fairly similar energetics), here the only constraints we have placed on the system are distance constraints on the phosphorus oxygen distances to the leaving group and nucleophilic oxygens, and thus the nucleophile is left free to orient itself in such a way as to follow the lowest energy path. Thus, the full free energy surface was obtained by precise reaction coordinate mapping, and the geometries and energies at each point on the plot were examined to ensure that the 2D plot obtained is the true lowest energy free energy surface.
All ab initio calculations were performed using the Gaussian software package(38), and Becke’s three level hybrid functionals, which combine Hartree-Fock exchange with density functional theory (DFT) exchange correlations(39). Initial gas-phase geometries were obtained using the 6-31+G* basis set, followed by a single-point correction using the 6-311+G** basis set to obtain the relevant energetics. Finally, solvation was simulated by applying a solvation correction to the gas-phase geometries, using the 6-311+G** basis set and not only COSMO(40, 41), but also by the PCM(42–46) and the Langevin Dipole (LD)(47) models for comparison. In the case of the COSMO and PCM models, the UFF model (which places spheres on all hydrogen atoms, thus treating them explicitly, using radii from the UFF forcefield)(48) was used rather than the standard UA0 model, in order to account for any possible proton transfer between the attacking water molecule and the phosphate. This approach has been demonstrated to accurately reproduce experimental activation barriers for phosphate hydrolysis(19, 22, 34, 35).
III. RESULTS AND DISCUSSION
Fig. 5 shows the free energy surface for the hydrolysis of the parent dGTP analog (X=O) in solution, and the geometry of the transition state for this reaction is shown in Fig. 6. As can be seen from Fig. 5, the reaction proceeds through a single concerted associative (ANDN) pathway, with P – O distances of 1.8 and 2.0 Å to the leaving group and nucleophile respectively in the transition state. The calculated activation barrier to this hydrolysis is 38.6 kcal/mol, as compared to an activation barrier of 28.6 kcal/mol for the pol β catalysed hydrolysis of dGTP opposite a correct (R) template base(17). It should be noted that we have estimated free energies and rate constants based on a temperature of 250° C. This is due to the fact that such a high temperature that would be required for an experimental study of such a reaction in solution (see for instance Refs. (35, 49) for a similar reaction), and we believe that that a comparison to an experimental value at the original temperature necessary for obtaining the experimental data is more reliable than comparison to the rate constants extrapolated to 25° C.
Figure 5.
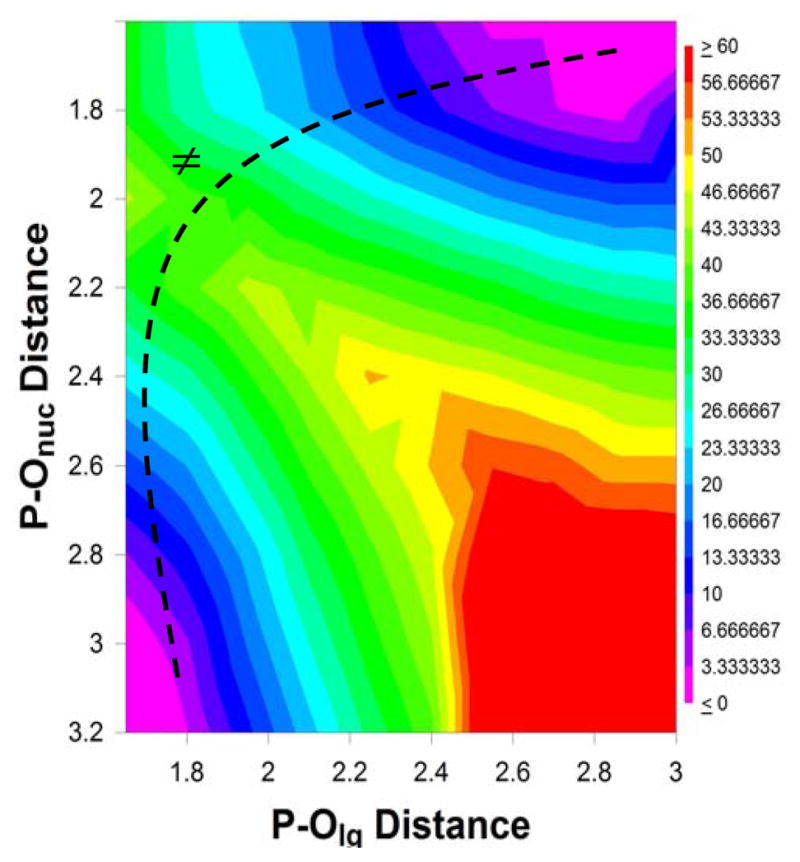
Free energy surface for the dGTP analog where X=O. All distances are in Å, and ≠ denotes a transition state.
Figure 6.
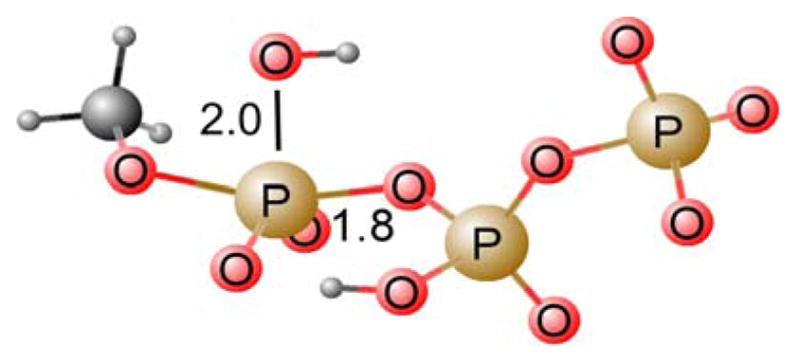
Concerted (ANDN) transition state for the parent dGTP analog (X=O).
The energy decomposition of the calculated activation barrier for the hydrolysis of the dGTP analogues examined in this work is shown in Table 1, the rate constants (obtained from transition state theory, assuming a temperature of 250°C) are shown in Table 2, and the calculated LFER is shown in Fig. 7. As with the enzymatic reaction(17) (Fig. 2), the mono- and di-halo compounds show significantly different kcalc behavior, with the analogue closest to the native dGTP (X=O), the methylene analogue and the monohalogenated compounds conforming to one linear relationship, and the dihalogenated compounds conforming to a separate linear relationship that deviates significantly from methylene and monohalogenated analogues. However, qualitatively, the free energy surfaces for the hydrolysis of all the dGTP analogues in solution are similar (see Supplementary Information). In all cases, hydrolysis proceeds through a single concerted pathway, with only subtle variations in transition state geometries. In each case, a proton is transferred from the attacking water molecule to the phosphate concomitantly to P–O formation/cleavage, as can be seen from the transition state depicted in Fig. 6.
Table 1.
The energy decomposition of the calculated activation barrier for the hydrolysis for the dGTP analogues in solution.
| X | pKa | ΔEgas | ΔEpol | ΔΔGsolv | ΔG≠calc,sol | ΔG≠enz,R | ΔG≠enz, W |
|---|---|---|---|---|---|---|---|
| O | 8.9 | 9.9 | −1.4 | 30.1 | 38.6 | 28.6 | 31.1 |
| CHF | 9.0 | 9.1 | −2.4 | 30.0 | 36.7 | 29.6 | 31.5 |
| CHCl | 9.5 | 28.3 | 1.0 | 14.0 | 43.3 | 29.3 | 33.0 |
| CHBr | 9.9 | 34.9 | 3.1 | 7.0 | 45.0 | 29.4 | 33.5 |
| CH2 | 10.5 | 31.7 | 2.5 | 11.6 | 45.8 | 30.9 | 33.6 |
| CF2 | 7.8 | 23.6 | 0.4 | 16.0 | 40.0 | 28.2 | 31.7 |
| CFCl | 8.4 | 19.4 | 0.5 | 21.0 | 40.9 | 28.6 | 33.0 |
| CCl2 | 8.9 | 22.9 | 0.2 | 23.7 | 46.8 | 29.2 | 34.5 |
| CBr2 | 9.3 | 23.8 | 0.3 | 21.6 | 45.7 | 30.3 | 35.5 |
Table 2.
Calculated activation barriers and rate constants for the hydrolysis of the dGTP analogues in solution.
| X | pKa | Δ G≠calc,sol | k | Log(k) |
|---|---|---|---|---|
| O | 8.9 | 38.6 | 9.80 × 10⁻⁴ | −3.01 |
| CHF | 9.0 | 36.7 | 6.30 × 10⁻³ | −2.20 |
| CHCl | 9.5 | 42.8 | 1.10 × 10⁻⁵ | −4.95 |
| CHBr | 9.9 | 45.0 | 2.15 × 10⁻⁶ | −5.67 |
| CH2 | 10.5 | 45.8 | 9.98 × 10⁻⁷ | −6.00 |
| CF2 | 7.8 | 40.0 | 2.63 × 10⁻⁴ | −3.57 |
| CFCl | 8.4 | 40.9 | 1.11 × 10⁻⁴ | −3.95 |
| CCl2 | 8.9 | 46.8 | 3.80 × 10⁻⁷ | −6.41 |
| CBr2 | 9.3 | 45.7 | 1.10 × 10⁻⁶ | −5.96 |
ΔG≠calc,sol denotes the calculated activation barrier for each compound, and k denotes the corresponding rate constant as obtained by transition state theory (assuming a temperature of 250°C).
Figure 7.
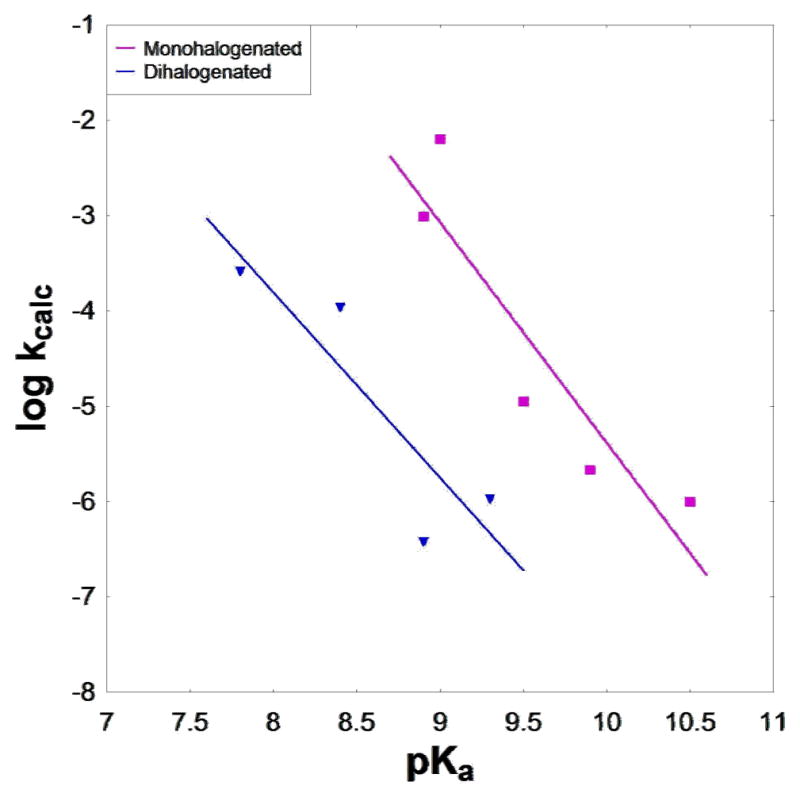
Calculated LFER for the hydrolysis of the dGTP analogues in solution.
Table 3 shows the P–O distances to the nucleophile and leaving group respectively in the transition state for the hydrolysis each of the dGTP analogues. From this table, it can be seen that not only does each hydrolysis proceed through a concerted ANDN transition state, but also within small variation, these transition states are similar in geometry. Thus, despite the fact that the compounds clearly form two subsets, each conforming to a different linear relationship, the hydrolysis of each compound proceeds through a qualitatively similar reaction pathway and transition state.
Table 3.
P–O distances to the nucleophile and leaving group in the transition state for the hydrolysis of the dGTP analogues in solution.
| X | pKa | P-Onuc | P-Olg |
|---|---|---|---|
| O | 8.9 | 2.0 | 1.8 |
| CHF | 9.0 | 2.0 | 1.8 |
| CHCl | 9.5 | 2.0 | 1.8 |
| CHBr | 9.9 | 2.0 | 1.95 |
| CH2 | 10.5 | 2.0 | 1.65 |
| CF2 | 7.8 | 2.0 | 1.8 |
| CFCl | 8.4 | 2.0 | 1.95 |
| CCl2 | 8.9 | 2.0 | 1.8 |
| CBr2 | 9.3 | 2.0 | 1.8 |
The calculated activation barriers for the hydrolysis of the dGTP analogues in the gas phase and the corresponding calculated LFER are shown in Table 4 and Fig. 7, respectively, for comparison to the solution LFER. There is no longer a segregation of the dGTP analogues into two subsets, but rather, despite the presence of some scattering, all compounds approach a single linear relationship, suggesting that the effect observed in the solution LFER is a solvation effect. Table 5 shows select atomic charges in both the reactant and transition states, that were obtained by performing charge fitting to the electrostatic potential at points selected according to the Merz-Singh-Kollman(50, 51) scheme using the COSMO solvation model. From this it can be seen that there are really only very small differences across the series, but that the charges show a systematic trend, and thus the only way to explore their meaning is by means of solvation calculations.
Table 4.
Calculated activation barriers and rate constants for the hydrolysis for the dGTP analogues in the gas phase.
| X | pKa | Δ E≠calc,gas | k | log(k) |
|---|---|---|---|---|
| O | 8.9 | 23.6 | 1862.1 | 3.27 |
| CHF | 9.0 | 30.5 | 2.45 | 0.39 |
| CHCl | 9.5 | 30.0 | 1.66 | 0.22 |
| CHBr | 9.9 | 34.9 | 0.04 | −1.45 |
| CH2 | 10.5 | 32.0 | 0.56 | −0.24 |
| CF2 | 7.8 | 25.5 | 263.0 | 2.42 |
| CFCl | 8.4 | 27.1 | 64.6 | 1.81 |
| CCl2 | 8.9 | 33.9 | 0.09 | −1.03 |
| CBr2 | 9.3 | 33.7 | 0.11 | −0.94 |
ΔE≠calc,gas denotes the calculated activation barrier for each compound, and k denotes the corresponding rate constant, as obtained from transition state theory (assuming a temperature of 250°C).
Table 5.
Merz-Singh-Kollman(50, 51) charges on the nucleophilic oxygen atom, the phosphorus atom and the oxygen of the departing leaving group, as evaluated by the COSMO solvation model, in both the reactant (RS) and transition (TS) states.
| X | pKa | RS | TS | ||||
|---|---|---|---|---|---|---|---|
| Onuc | P | Olg | Onuc | P | Olg | ||
| O | 8.9 | −0.88 | 1.35 | −0.67 | −0.84 | 1.43 | −0.84 |
| CHF | 9.0 | −0.88 | 1.39 | −0.64 | −0.87 | 1.44 | −0.79 |
| CHCl | 9.5 | −0.88 | 1.31 | −0.62 | −0.79 | 1.56 | −0.86 |
| CHBr | 9.9 | −0.88 | 1.38 | −0.65 | −0.75 | 1.46 | −0.81 |
| CH2 | 10.5 | −0.88 | 1.37 | −0.69 | −0.73 | 1.62 | −0.78 |
| CF2 | 7.8 | −0.88 | 1.31 | −0.53 | −1.03 | 1.48 | −0.79 |
| CFCl | 8.4 | −0.88 | 1.32 | −0.55 | −0.75 | 1.48 | −0.84 |
| CCl2 | 8.9 | −0.88 | 1.32 | −0.59 | −0.72 | 1.48 | −0.84 |
| CBr2 | 9.3 | −0.88 | 1.31 | −0.56 | −0.73 | 1.54 | −0.91 |
From the energy decomposition shown in Table 1, it can be seen that there is a significant difference in solvation between the monohalogenated compounds and their dihalogenated counterparts – that is, when the halogen substituent is chlorine or bromine, there is a somewhat larger solvation contribution (ΔΔGsolv) to the overall activation barrier (ΔG≠calc) in the case of the dihalogenated compound than in the case of the monohalogenated compound. However, this trend is reversed in the case when the halogen substituent is fluorine. Here, ΔΔGsolv is much larger in the case of the monohalogenated compound than in the case of the dihalogenated compound. In order to verify that these observed trends are not coincidental, we simulated solvation using the PCM. Table 6 shows a comparison of ΔΔGsolv for each compound using both solvation models. From this table, it can be seen that even though the absolute value of the solvation contribution is dependent on the precise solvation model, the trend remains the same regardless of whether we simulate solvation using COSMO, PCM. Finally, we also examined the trends in solvation by means of the LD model. Once again, the overall trend was the same as that seen in COSMO and PCM, i.e. for both chlorine and bromine substituents, ΔΔGsolv was much smaller for the mono- than for the dihalogenated compounds. It should be noted that our LD calculations were not calibrated to the case where the halogen substituent is fluorine, as in view of the difficulty of the calculations, their possible instability and the predictive feature of our approach, we prefer to focus on the most stable cases (in this case chlorine and bromine).
Table 6.
A comparison of the solvation contribution (ΔΔGsolv) to the total activation barrier (ΔG≠calc) as obtained from the COSMO, PCM and LD solvation models.
| X | pKa | ΔΔGsolv,COSMO | ΔΔGsolv,PCM | ΔΔGsolv,LD |
|---|---|---|---|---|
| O | 8.9 | 30.1 | 29.8 | 30.9 |
| CHF | 9.0 | 30.0 | 29.7 | 39.2 |
| CHCl | 9.5 | 14.0 | 13.9 | 17.6 |
| CHBr | 9.9 | 7.0 | 19.7 | 11.1 |
| CH2 | 10.5 | 11.6 | 11.4 | 15.5 |
| CF2 | 7.8 | 16.0 | 15.5 | 13.9 |
| CFCl | 8.4 | 21.0 | 20.8 | 28.8 |
| CCl2 | 8.9 | 23.7 | 23.4 | 24.2 |
| CBr2 | 9.3 | 21.6 | 21.4 | 17.1 |
In summarizing the above results, it is important to clarify what we have been trying to examine in this work and what we have actually been able to determine. We start by noting that the observed trend in the reactivity of these compounds can be classified in terms of two different effects, i.e. i) having an LFER that correlates ΔG≠ to the leaving group pKa, and ii) having two sets of LFER. The basic origin of the LFER is conceptually simple, but difficult to quantify computationally. That is, the true basis of the LFER is the relationship between ΔG≠, i.e. the activation barrier of the reaction, and ΔG0, i.e., the free energy difference between the reactants and products (see the discussion in Ref. (52) and references therein). The problem becomes more complex when we are dealing with several intersecting parabolae(27). Now, the dependence of the reaction rate on the leaving group pKa comes indirectly from the correlation between the pKa and ΔG0. Thus, we would expect correlation between the intersections of the Marcus parabolae (and thus ΔG≠) with the pKa of leaving group, if the intersection is correlated to the energy of the product state, and if the energy of the product state is in turn correlated to the pKa. However, although we have succeeded to reproduce a LFER that correlates the calculated ΔG≠ with the observed pKa, we have encountered major difficulties when trying to quantify the origin of the LFER, since correlating ΔG≠ to ΔG0 gave unstable results. This is partly due to the fact that the nature of the proton transfer (PT) step changes in the different systems, where in some cases PT occurs before the rate-determining step and in others after this step.
While the quantification of the precise origin of the observed LFER is left for further studies, we have demonstrated that the reason for the different behaviour of the mono- and dihalogens can be explored by simply examining the energies of the corresponding transition states at the observed pKa in solution. If the calculations can reproduce the difference in ΔG≠ between the mono and dihalogens at any given pKa, then we may explore the reason for this computational difference. Indeed, after finding out that the calculations reproduced the observed trend, our study indicated that the change in the TS charge distribution led to a difference in the corresponding solvation energy that we suggest is principally responsible for the segregation of the data into two separate LFER.
IV. Conclusions
DNA polymerase catalysis and fidelity studies typically compare the incorporation of W-C correct pairs versus non-W-C mispairs, where the leaving group is the natural pyrophosphate. Recently(16, 17), we altered the electronic and steric properties of the leaving groups by replacing PPi by a series of halomethylene derivatives in the β,γ-bridging position. This strategy made possible the investigation of the catalytic mechanisms of right and wrong incorporations proceeding “downstream” from the transition state. Here, we have performed an extensive computational analysis, involving the evaluation of the complete free energy surface in solution for each of the systems explored, while using different simulation models. The calculations were used to explore whether the separate linear of the mono- and dihalogenated dNTP analogs might result from their intrinsic properties when undergoing hydrolysis in aqueous solution, while being modulated by the polymerase active site. More specifically, a key element of the analysis is the use of MFJ plots to characterise transition states for the hydrolysis of the dGTP analogues presented in Refs. (16, 17), in both the gas-phase and in solution. In all cases, the reaction proceeds through a single concerted ANDN associative transition state, with no clear trend in P–Onuc and P–Olg distances across the series (cf. Table 3). The calculations reproduced a LFER with a similar trend to the one observed in the enzyme when using the calculated activation barriers and the observed pKas in solutions. The only clear difference between the mono- and di-halogenated dGTP analogues occurred when examining the energy decomposition of the total calculated activation free energies in each case (Table 1). Here, there is a clear difference in the solvation contribution to the total free energy between the monohalogenated and dihalogenated compounds. When the halogen is chlorine or bromine, there is a significantly larger ΔΔGsolv in the case of the dihalogenated than that of the monohalogenated compounds, and this trend is reversed when the halogen is fluorine.
We only observe this phenomenon in solution. In the gas-phase, there is no clear pattern distinguishing hydrolysis rates for the mono- and dihalogens, with both sets of compounds falling roughly on one line (Fig. 9). Thus, the present study indicates that the main cause for the discrepancy in the rate constants between the two series of compounds arises from the difference in how these compounds are interacting with the solvent. In order to verify this, we simulated solvation using three different solvent models (COSMO, PCM and LD), and, in all three cases, we observed the same trend. The origin of this solvation effect was traced to a small but well-defined change in the TS charge distribution between the two systems. The difference in the interaction of these TS charges and the solvent leads to the split between the two LFER. If this finding stands the test of time, then the origin of the discrepancy in the magnitude of this segregation in the polymerase reaction for the correct and incorrect base pairs is due, at least in part, to the change in the electrostatic interaction between the protein active site and the TS charges.
At this point, we must emphasize that the calculations reported here are extremely challenging, since we are dealing with small effects that compensate the gas phase trend in a way which is not fully intuitive. Thus, our results still present a somewhat speculative prediction (the experimental data for the solution hydrolyses of the halomethylene derivatives are not currently available to make a direct comparison with theory). However, we note that in cases where experimental data are available, we have accurately reproduced experimental activation free energies for phosphate hydrolysis using our current protocol(19, 22, 34, 35). Here, we have used exactly the same approach as in our previous studies, which have shown to successfully reproduce solution LFER for phosphate hydrolysis(19, 22). Thus, we believe that despite the absence of experimental rate constants for the reaction in solution, our predictions with regards to the trend we observe for the hydrolysis of these compounds are likely to represent the actual chemistry in solution. Of course, the final judgment will be obtained by solution experiments, in which the solvent dielectric constant is varied, and the subsequent analysis of these experiments. Perhaps the most noteworthy result of the computational analysis is that the LFER in solution follows the same trend as that observed for the pol β catalysed reaction1,2, with the native dGTP analogue including compounds with monohalogenated substituents conforming to one linear relationship and the compounds with dihlaogenated substituents fitting to a second independent linear relationship (compare Figs. 2 and 7).
As stated at the end of the previous section, our results suggest that the split of the LFER plots for the pol β-catalyzed incorporation of the dGTP analogues(16, 17) into two subsets reflects a generalized solvation phenomenon (where we define such effects as the overall electrostatic interaction between the substrate and the enzyme plus solvent system). Thus, the fact that the discrepancy between the two subsets of compounds is larger in the case of W than R nucleotide incorporation is likely to reflect the differences in the electrostatic interaction between the TS charges and the active site microenvironments induced and by introduction of the mismatched vs. matched nucleotides.
We believe that our results highlight the importance of the ability to differentiate between effects that are caused by the enzyme and effects that are a result of the basic chemistry of the substrate and would already be observed even in solution in the absence of the enzyme. Careful examination of the hydrolysis of these dGTP analogues in solution should allow us to move on to the enzymatic reaction in order to understand why there is a larger discrepancy between the two subsets in the case of W rather than R nucleotide insertion. We believe that understanding the hydrolysis of these compounds solution is an essential stepping-stone towards understanding the factors governing the fidelity of DNA polymerases.
Supplementary Material
Figure 8.
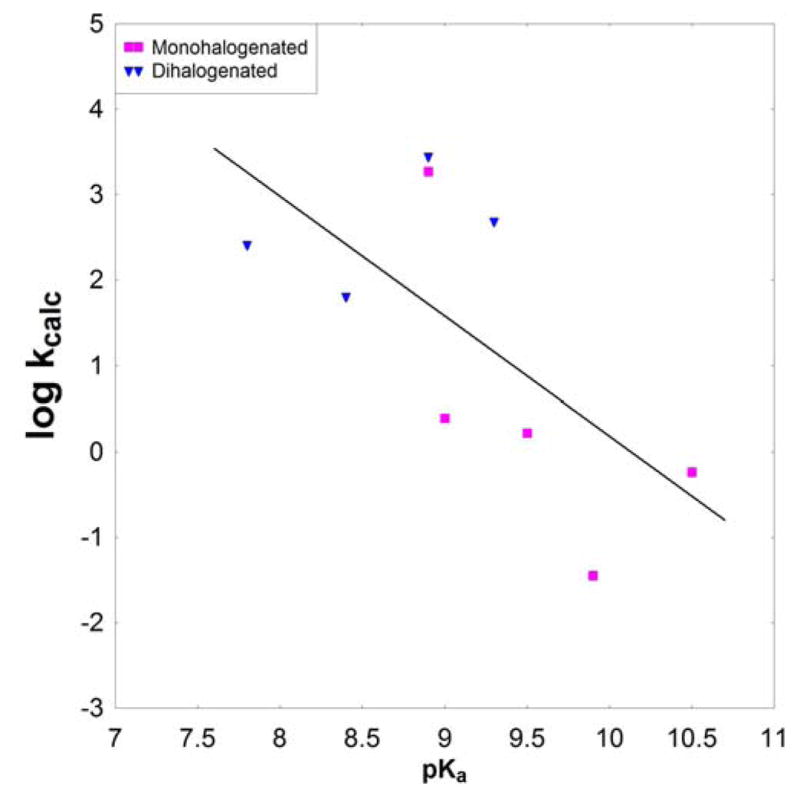
Calculated LFER for dGTP and analogues in the gas phase.
Acknowledgments
This work was supported by NCI Grant 1 U19 CA105010-01 and NSF Grant MCB-0342276. All computational work was supported by the University of Southern California High Performance Computing and Communication Centre.
FUNDING INFORMATION: This work was supported by NCI Grant 1 U19 CA105010-01 and NSF Grant MCB-0342276.
Footnotes
Full free energy surfaces and transition states for all compounds studied in this work are available as electronic supplementary material on http://pubs.acs.org.
VII. REFERENCES
- 1.Kornberg A, Lehman IR, Bessman MJ, Simms ES. Enzymic synthesis of deoxyribonucleic acid. Biochim Biophys Acta. 1956;21:197–198. doi: 10.1016/0006-3002(56)90127-5. [DOI] [PubMed] [Google Scholar]
- 2.Lehman IR, Zimmerman SB, Adler J, Bessman MJ, Simms ES, Kornberg A. Enzymatic synthesis of deoxyribonucleic acid v. chemical composition of enzymatically synthesized deoxyribonucleic acid. Proc Natl Ada Sci U S A. 1958;44:1191–1196. doi: 10.1073/pnas.44.12.1191. [DOI] [PMC free article] [PubMed] [Google Scholar]
- 3.Goodman MF. Error-prone repair DNA polymerases in prokaryotes and eukaryotes. Annu Rev Biochem. 2002;71:17–50. doi: 10.1146/annurev.biochem.71.083101.124707. [DOI] [PubMed] [Google Scholar]
- 4.Friedberg EC, Wagner R, Radman M. Specialized DNA polymerases, cellular survival, and the genesis of mutations. Science. 2002;296:1627–1630. doi: 10.1126/science.1070236. [DOI] [PubMed] [Google Scholar]
- 5.Zerbe LK, Kuchta RD. The p58 subunit of human DNA primase is important for primer initiation, elongation and counting. Biochemistry. 2002;41:4891–4900. doi: 10.1021/bi016030b. [DOI] [PubMed] [Google Scholar]
- 6.Mizuno T, Yamagishi K, Miyazawa H, Hanaoka F. Molecular architecture of the mouse DNA polymerase alpha-primase complex. Mol Cell Biol. 1999;19:7886–7896. doi: 10.1128/mcb.19.11.7886. [DOI] [PMC free article] [PubMed] [Google Scholar]
- 7.Gavin AC, Superti-Furga G. Protein complexes and proteome organization from yeast to man. Curr Opin Chem Biol. 2003;7:21–27. doi: 10.1016/s1367-5931(02)00007-8. [DOI] [PubMed] [Google Scholar]
- 8.Batra VK, Beard WA, Shock DD, Pedersen LC, Wilson SH. Nucleotide-induced DNA polymerase active site motions accomodating a mutagenic DNA intermediate. Structure. 2005;13:1225–1233. doi: 10.1016/j.str.2005.05.010. [DOI] [PubMed] [Google Scholar]
- 9.Batra VK, Shock DD, Prasad R, Beard WA, Hou EW, Pedersen LC, Sayer JM, Yagi H, Kumar S, Jerina DM, Wilson SH. Structure of DNA polymerase beta with a benzo[c]phenanthrene diol epoxide-adducted template exhibits inutagenic features. Proc Natl Acad Sci USA. 2006;103:17231–17236. doi: 10.1073/pnas.0605069103. [DOI] [PMC free article] [PubMed] [Google Scholar]
- 10.Batra VK, Beard WA, Shock DD, Krahn JM, Pedersen LC, Wilson SH. Magnesium-induced assembly of a complete DNA polymerase catalytic complex. Structure. 2006;14:757–766. doi: 10.1016/j.str.2006.01.011. [DOI] [PMC free article] [PubMed] [Google Scholar]
- 11.McKenna CE, Kahemirov BA, Upton TG, Batra VK, Goodman MF, Pedersen LC, Beard WA, Wilson SH. (R)-β, γ–fluoromethylene-dGTP-DNA ternary complex with DNA polymerase beta. J Am Chem Soc. 2007;129:15412–15413. doi: 10.1021/ja072127v. [DOI] [PMC free article] [PubMed] [Google Scholar]
- 12.Xiang Y, Goodman MF, Beard WA, Wilson SH, Warshel A. Exploring the role of large conformational changes in the fidelity of DNA polymerase β. Proteins: Struct Funct Bioinf. 2008;70:231–247. doi: 10.1002/prot.21668. [DOI] [PMC free article] [PubMed] [Google Scholar]
- 13.Florián J, Goodman MF, Warshel A. Computer simulations of the chemical catalysis of DNA polymerases: Discriminating between alternative nucleotide insertion mechanisms for T7 DNA polymerase. J Am Chem Soc. 2003;125:8163–8177. doi: 10.1021/ja028997o. [DOI] [PubMed] [Google Scholar]
- 14.Lin P, Batra VK, Pedersen LC, Beard WA, Wilson SH, Pedersen LG. Incorrect nucleotide insertion at the active site of a G:A mismatch catalyzed by DNA polymerase β. Proc Natl Ada Sci U S A. 2008;105:5670–5674. doi: 10.1073/pnas.0801257105. [DOI] [PMC free article] [PubMed] [Google Scholar]
- 15.Alberts IL, Wang YA, Schlick T. DNA polymerase β catalysis: Are different mechanisms possible? J Am Chem Soc. 2007;129:11100–11110. doi: 10.1021/ja071533b. [DOI] [PubMed] [Google Scholar]
- 16.Sucato CA, Upton TG, Kashemirov BA, Batra VK, Martinek V, Xiang Y, Beard WA, Pedersen LC, Wilson SH, McKenna CE. Modifying the beta, gamma leaving group bridging oxygen alters nucleotide incorporation efficiency, fideltiy, and the catalytic mechanism of DNA polymerase β. Biochemistry. 2007;46:461–471. doi: 10.1021/bi061517b. [DOI] [PubMed] [Google Scholar]
- 17.Sucato CA, Upton TG, Kashemirov BA, Osuna J, Oertell K, Beard WA, Wilson SH, Florián J, Warshel A, McKenna CE, Goodman MF. DNA polymerase β fidelity: Halomethylene-modified leaving groups in pre-steady-state kinetic analysis reveal differences at the chemical transition state. Biochemistry. 2008;47:870–879. doi: 10.1021/bi7014162. [DOI] [PubMed] [Google Scholar]
- 18.McKenna CE, Shen PD. Fluorination of methanediphosphonate esters by perchloryl fluoride. Synthesis of fluoromethanediphosphonic acid and difluoromethanediphosphonic acid. J Org Chem. 1981;46:4573. [Google Scholar]
- 19.Klahn M, Rosta E, Warshel A. On the mechanism of hydrolysis of phosphate monoester dianions in solution and proteins. J Am Chem Soc. 2006;128:15310–15323. doi: 10.1021/ja065470t. [DOI] [PubMed] [Google Scholar]
- 20.Wilkie J, Gani D. Comparison of inline and non-inline associative and dissociative reaction pathways for model reactions of phosphate monoester hydrolysis. J Chem Soc, Perkin. 1996;22:783–787. [Google Scholar]
- 21.Kamerlin SCL, Wilkie J. The role of metal ions in phosphate ester hydrolysis. Org Biomol Chem. 2007;5:2098–2108. doi: 10.1039/b701274h. [DOI] [PubMed] [Google Scholar]
- 22.Rosta E, Kamerlin SCL, Warshel A. On the interpretation of the observed LFER in phosphate hydrolysis: A thorough computational study of phosphate diester hydrolysis in solution. Biochemistry. 2008;47:3725–3735. doi: 10.1021/bi702106m. [DOI] [PubMed] [Google Scholar]
- 23.Friedman JM, Freeman S, Knowles JR. The quest for free metaphosphate in solution. Racemization at phosphorus in the transfer of the phospho group from aryl phosphate monoesters to tert-butyl alcohol in acetonitrile or in tert-butyl alcohol. J Am Chem Soc. 1988;110:1268–1275. [Google Scholar]
- 24.Kirby AJ, Jencks WP. The reactivity of nucleophillic reagents towards the p-nitrophenyl phosphate dianion. J Am Chem Soc. 1965;87:3209–3216. [Google Scholar]
- 25.Kirby AJ, Varvoglis AG. The reactivity of phosphate monoester hydrolysis. J Am Chem Soc. 1967;89:415–423. [Google Scholar]
- 26.Florian J, Aqvist J, Warshel A. On the reactivity of phosphate monoester dianions in aqueous solution: Bronsted linear free-energy relationships do not have a unique mechanistic interpretation. J Am Chem Soc. 1998;120:11524–11525. [Google Scholar]
- 27.Aqvist J, Kolmodin K, Florian J, Warshel A. Mechanistic alternatives in phosphate monoester hydrolysis: what conclusions can be drawn from available experimental data? Chemistry and Biology. 1999;6:R71–R80. doi: 10.1016/S1074-5521(99)89003-6. [DOI] [PubMed] [Google Scholar]
- 28.Florián J, Warshel A. Phosphate ester hydrolysis in aqueous solution: associative versus dissociative mechanisms. J Phys Chem B. 1998;102:719–734. [Google Scholar]
- 29.Hengge AC. Adv Phys Org Chem. 2005;40:49. [Google Scholar]
- 30.Mercero JM, Barrett P, Lam CW, Fowler JE, Ugalde JM, Pedersen LG. Quantum mechanical calculations on phosphate hydrolysis reactions. J Comput Chem. 2000;21:43–51. [Google Scholar]
- 31.Liu Y, Gregersen A, Hengge AC, York DM. Transesterification thio effects of phosphate diesters: free energy barriers and kinetic and equilibrium isotope effects from density functional theory. Biochemistry. 2006;45:10043–10053. doi: 10.1021/bi060869f. [DOI] [PubMed] [Google Scholar]
- 32.Lopez X, Dejaegere A, Leclerc F, York DM, Karplus M. Nucleophilic attack on phosphate diesters: a density functional study of in-line reactivity in dianionic, monoanionic, and neutral systems. J Phys Chem B. 2006;110:11525–11539. doi: 10.1021/jp0603942. [DOI] [PubMed] [Google Scholar]
- 33.Liu Y, Gregersen BA, Lopez X, York DM. Density functional study of the inline mechanism of methanolysis of cyclic phosphate and thiophosphate esters in solution: Insight into thio effects in RNA transesterification. J Phys Chem B. 2006;109:19987–20003. doi: 10.1021/jp053146z. [DOI] [PubMed] [Google Scholar]
- 34.Kamerlin SCL, Florian J, Warshel A. Associative versus dissociative mechanisms of phosphate monoester hydrolysis: On the interpretation of activation entropies. Chem Phys Chem. 2008;9:1767–1773. doi: 10.1002/cphc.200800356. [DOI] [PubMed] [Google Scholar]
- 35.Kamerlin SCL, Williams NH, Warshel A. Dineopentyl phosphate hydrolysis: Evidence for stepwise water attack. J Org Chem. 2008;73:6960–6969. doi: 10.1021/jo801207q. [DOI] [PubMed] [Google Scholar]
- 36.Jencks WP. A primer for the bema hapothle. An empirical approach to the characterization of changing transition-state structures. Chem Rev. 1985;85:511–527. [Google Scholar]
- 37.More O’Ferrall RA. Relationships between E2 and E1cB mechanisms of beta-elimination. J Chem Soc B. 1970:274–277. [Google Scholar]
- 38.Frisch MJ, Trucks GW, Schlegel HB, Scuseria GE, Robb MA, Cheeseman JR, Montgomery JJA, Vreven T, Kudin KN, Burant JC, Millam JM, Iyengar SS, Tomasi J, Barone V, Mennucci B, Cossi M, Scalmani G, Rega N, Petersson GA, Nakatsuji M, Hada M, Ehara K, Toyota R, Fukuda J, Hasegawa M, Ishida T, Nakajima Y, Honda Y, Kitao O, Nakai H, Klene M, Li X, Knox JE, Hratchian HP, Cross JB, Adacmo C, Jaramillo J, Gomperts R, Stratmann RE, Yazyev O, Austin AJ, Cammi R, Pomelli C, Ochterski J, Ayala PY, Morokuma K, Voth GA, Salvador P, Dannenberg JJ, Zakrzewski VG, Dapprich S, Daniels AD, Strain MC, Farkas Ö, Malick DK, Rabuck AD, Clifford K, Cioslowki J, Stefanov BB, Liu G, Liashenko A, Piskorz P, Komaromi I, Martin RL, Fox DJ, Keith T, Al-Laham MA, Peng CY, Nanayakkara A, Challacombe M, Gill PMW, Johnson BG, Chen W, Wong MW, Gonzalez C, Pople JA. GAUSSIAN 03 (Revision C 02) 2004 [Google Scholar]
- 39.Becke AD. Density-functional thermochemistry. III The role of exact exchange. J Chem Phys. 1993;98:5648–5652. [Google Scholar]
- 40.Barone V, Cossi M. Quantum calculation of molecular energies and energy gradients in solution by a conductor solvent model. J Phys Chem A. 1998;102:1995–2001. [Google Scholar]
- 41.Klamt A, Schüürmann GJ. COSMO: a new approach to dielectric screening in solvents with explicit expressions for the screening energy and its gradient. J Chem Soc, Perkin Trans 2. 1993;5:799–805. [Google Scholar]
- 42.Tomasi J, Mennucci B, Cancès MT. J Mol Struct (Theochem) 1991;464:464. [Google Scholar]
- 43.Cancès MT, Mennucci B, Tomasi J. A new integral equation formalism for the polarizable continuum model: Theoretical background and applications to isotropic and anisotropic dielectrics. J Chem Phys. 1997;107:3032–3041. [Google Scholar]
- 44.Mennucci B, Tomasi J. Continuum solvation models: A new approach to the problem of solute’s charge distribution and cavity boundaries. J Chem Phys. 1997;106:5151–5158. [Google Scholar]
- 45.Mennucci B, Cancès MT, Tomasi J. Evaluation of solvent effects in isotropic and anisotropic dielectrics and in ionic solutions with a unified integral equation method: Theoretical bases, computational implementation, and numerical applications. J Phys Chem B. 1997;101:10506–10517. [Google Scholar]
- 46.Cossi M, Scalmani G, Rega N, Barone V. New developments in the polarizable continuum model for quantum mechanical and classical calculations on molecules in solution. J Chem Phys. 2002;117:43–54. [Google Scholar]
- 47.Florián J, Warshel A. Calculation of hydration entropies of hydrophobic, polar, and ionic solutes in the framework of the Langevin dipole solvation model. J Phys Chem B. 1999;103:10282–10288. [Google Scholar]
- 48.Rappé AK, Casewit CJ, Colwell KS, Goddard WA, III, Skiff WM. UFF, a full periodic table force field for molecular mechanics and molecular dynamics simulations. J Am Chem Soc. 1992;114:10024–10035. [Google Scholar]
- 49.Schroeder GK, Lad C, Wyman P, Williams NH, Wolfenden R. The time required for water attack at the phosphorus atom of simple phosphodiesters and of DNA. PNAS. 2006;103:4052–4055. doi: 10.1073/pnas.0510879103. [DOI] [PMC free article] [PubMed] [Google Scholar]
- 50.Besler BH, Merz KM, Jr, Kollman PA. Atomic charges derived from semiempirical methods. J Comp Chem. 1990;11:431–439. [Google Scholar]
- 51.Singh UC, Kollman PA. An approach to computing electrostatic charges for molecules. J Comp Chem. 1984;5:129–145. [Google Scholar]
- 52.Warshel A. Computer modeling of chemical reactions in enzymes and solutions. John Wiley and Sons; New York: 1991. [Google Scholar]
Associated Data
This section collects any data citations, data availability statements, or supplementary materials included in this article.


