Abstract
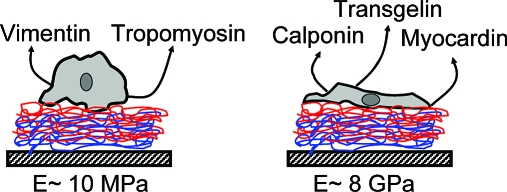
Smooth muscle cells convert between a motile, proliferative “synthetic” phenotype and a sessile, “contractile” phenotype. The ability to manipulate the phenotype of aortic smooth muscle cells with thin biocompatible polyelectrolyte multilayers (PEMUs) with common surface chemical characteristics but varying stiffness was investigated. The stiffness of (PAH/PAA) PEMUs was varied by heating to form covalent amide bond cross-links between the layers. Atomic force microscopy (AFM) showed that cross-linked PEMUs were thinner than those that were not cross-linked. AFM nanoindentation demonstrated that the Young’s modulus ranged from 6 MPa for hydrated native PEMUs to more than 8 GPa for maximally cross-linked PEMUs. Rat aortic A7r5 smooth muscle cells cultured on native PEMUs exhibited morphology and motility of synthetic cells and expression of the synthetic phenotype markers vimentin, tropomyosin 4, and nonmuscle myosin heavy chain IIB (nmMHCIIB). In comparison, cells cultured on maximally cross-linked PEMUs exhibited the phenotype markers calponin, smooth muscle myosin heavy chain (smMHC), myocardin, transgelin, and smooth muscle α-actin (smActin) that are characteristic of the smooth muscle “contractile” phenotype. Consistent with those cells being “contractile”, A7r5 cells grown on cross-linked PEMUs produced contractile force when stimulated with a Ca2+ ionophore.
Introduction
Most cells communicate mechanically with their surroundings. The lines of communication are mediated through direct interactions with associated cells(1) and the extracellular matrix (ECM) in vivo and with the synthetic culture substrate in vitro. The mechanical properties of the microenvironment affect the morphology, adhesion, motility, and protein expression of many cell types, including myocytes,(2) mesenchymal stem cells,3,4 fibroblasts,5−7 endothelial cells,(7) neutrophils,(7) and smooth muscle cells.8−10 Microenvironment mechanical properties also can affect cell phenotype. Mesenchymal stem cells, for example, differentiate into either osteoblasts or adipocytes, depending on the flexibility of the underlying cell culture substrate.(4) Cells that change lineage in response to synthetic substrate flexibility tend to differentiate into the lineage that naturally grows on a tissue with similar mechanical properties.(10)
Controlling the behavior and phenotype of cells via the mechanical properties of their substrate in vivo may lead to the improvement of biomedical devices such as coronary stents and spine and retinal implants. Polyelectrolyte multilayer (PEMU) thin films, built via the layer-by-layer protocol,11,12 are ideal candidates for biomedical and biomaterial applications due to their ease of production, chemical and physical diversity, and ability to be fine-tuned for specific tasks. Polyelectrolyte multilayers have been used as substrates for mammalian cell culture for almost a decade; many physical and chemical properties of the thin films have been studied and correlated to the cellular behavior. The effect of film swellability,13,14 surface chemistry,15−17 surface charge,(18) surface hydrophobicity,8,9 and film stiffness19−21 have been investigated. The mechanical properties of the cell culture substrate have been increasingly studied; they became critical for many bioapplications, such as heart implants, that need to mimic the elasticity of the heart’s tissue,(22) or tissue repair and drug delivery, where mechanosensing and force transduction can add the right cellular triggers to generate an ideal unity between the biology and the surface chemistry.(23) Pelham and Wang,(5) Lo et al.,(6) Wong et al.,24,25 Engler et al.,2,10 and others discussed how cellular motility, spreading, and directed migration is affected by the stiffness of the substrate. Cells migrate from the soft region of the substrate toward the stiff region.(25) The cell area of smooth muscle cells correlates to the stiffness of the substrate.(10) Cellular motility and focal adhesions are also controlled by the flexibility of the substrate.(5) Changes in the protein expression levels, compared to GAPDH standard, as well as changes in growth factor signaling has been shown in human trabecular meshwork cells grown on polyacrylamide gels of different rigidity.(26)
Introduction of inducible cross-linkable moieties into the bulk of the film, where covalent cross-linking can be triggered postbuildup to decrease PEMU flexibility, allows for additional control of the mechanical properties of the PEMU substrate. In this work, PAH/PAA PEMUs with mechanical properties ranging over 3 orders of magnitude were built with different degrees of cross-linking. These PEMUs were mechanically characterized using an atomic force microscopy (AFM) nanoscale indentation technique. PAH/PAA PEMUs with different mechanical properties were used as substrates for growth of A7r5 rat aortic smooth muscle cells.
Smooth muscle cells exhibit a remarkable capability to transform between “contractile” and “synthetic” phenotypes and a continuum of states in between.27,28 This property of the cells enables sessile “contractile” cells in the wall of an artery to become “synthetic”, to migrate into and proliferate to heal a wound before becoming contractile again. Unfortunately, synthetic smooth muscle cells also can contribute to vascular occlusive pathologies such as atherosclerosis and intimal hyperplasia as well as in-stent restenosis.29,30 In addition to changes in cell behavior, smooth muscle cell phenotypic modulation involves changes in gene expression. The phenotype of the A7r5 aortic smooth muscle cells grown on the different PEMU surfaces was assessed by determining expression of smooth muscle cell “synthetic” and “contractile” phenotype marker proteins and ability to produce contractile force. Data presented here demonstrate that manipulation of PEMU flexibility through covalent PEMU cross-linking dramatically affects the phenotype and contractibility of adhering smooth muscle cells.
Materials and Methods
Materials
Poly(allylamine hydrochloride) (PAH; MW = 7 × 10⁴) and poly(acrylic acid) 25 wt % in water (PAA; MW = 2.4 × 10⁵) were used as received from Sigma Aldrich. Hydrochloric acid solution, 1 N, and tris(hydroxymethyl)aminomethane (Tris crystallized free base, Fisher) were used to prepare 25 mM Tris-HCl buffered solutions at pH 7.4 containing 150 mM NaCl (Sigma). Polyelectrolytes for multilayer buildup were 10 mM with respect to the monomer repeat unit in buffer. A7r5 rat aortic smooth muscle cells were obtained from the American type Culture Collection and cultured as described previously.(9) Mouse anti-α-actinin antibody (clone BM-75.2, Sigma-Aldrich, St. Louis, MO) and goat antimouse IgM Alexa Fluor 568 secondary antibody (Molecular Probes, Carlsbad, CA) were used according to the suppliers’ recommendations.
Buildup and Characterization of Polyelectrolyte Multilayers
PAH/PAA multilayers were built on 1 in. diameter single side polished silicon wafers with ⟨100⟩ orientation (Topsil Inc.) for force measurements and for AFM imaging, on 1 in. diameter double side polished silicon wafers for the Fourier-Transform Infra-Red spectroscopy (FTIR) monitoring, and on glass coverslips (No. 1.5, 22 mm sq. cover glass, Corning) for cell culture. All substrates were cleaned in “piranha” solution consisting of 70/30 by volume of concentrated H2SO4 and 30% H2O2 in water (caution: piranha is a strong oxidizer and should not be stored in closed containers) to remove organic contaminants, followed by thorough rinsing in 18 MΩ H2O, and then dried with a stream of nitrogen gas. Depending on the need, polymer solutions were made in saline or saline-buffered solutions. The coating process was performed by the layer-by-layer technique either manually or with the aid of a robot (StratoSequence V, nanoStrata Inc.). The clean substrates were mounted on a shaft that rotated at 300 rpm, allowing better diffusion of the polymers to the surface of the substrate and yielding uniform films. Dipping time in the polyelectrolyte solutions was fixed at 10 min and the rinsing time was set to 1 min. PAH solutions were prepared at pH 7.4 and 0.15 M NaCl; PAA solutions were prepared at either pH 7.4 or pH 4.6, both containing 0.15 M NaCl.
The buildup of the PEMU films was monitored using a Gaertner Scientific L116S autogain variable angle Stokes ellipsometer. The swelling properties of (PAH/PAA) multilayers were investigated by assessing the percent increase in thickness after wetting a PEMU in a buffer solution. To do this, AFM images (MFP-3D Asylum Research Inc., Santa Barbara, CA) were obtained at different locations on the edge of a scratch to determine the thickness of the film in its dry state. The PEMUs were then wetted with a solution containing 0.15 M NaCl, 0.25 M Tris-HCl buffer, pH 7.4, for 30 min and new AFM images were obtained at different positions on the edge of the scratch to measure the wet thickness of the film.
PEMU Nomenclature
For an even number of layers, (A/B)x will be used where A is the starting polyelectrolyte that is in contact with the substrate, B is the terminating polyelectrolyte, and x is the number of bilayers. For an odd number of layers, (A/B)xA is used. The ionic strength and the pH of the polyelectrolyte solutions are added in the following manner: (A/B)x at C MY and pH Z, where C is the concentration of the salt MY (M+ cation and Y− anion) and Z is the pH of the solution. For example (PAH/PAA)5PAH at 0.15 M NaCl and pH 7.4 would represent a multilayer made of 11 layers of PAH and PAA built in 0.15 M NaCl, 25 mM Tris-HCl at a pH of 7.4.
Cross-Linking of PAH/PAA Multilayers
After buildup, PAH/PAA multilayers were cross-linked in a Lindberg-type 51744 bench furnace at 215 °C for various times up to 150 min. The heat treatment forms an amide bond between carboxylate and amine groups.31,32 FTIR was used to monitor the cross-linking of (PAH/PAA)35PAH at 30 min intervals.
Force Spectroscopy
A MFP-3D AFM unit equipped with an ARC2 controller (Asylum Research Inc., Santa Barbara, CA) and Igor Pro software was used to analyze the mechanical properties of native and cross-linked (PAH/PAA) multilayers. (PAH/PAA)15PAH was used to measure the PEMU mechanical properties, as its thickness was appropriate for the technique; coupling of thinner PEMUs to the hard silicon substrate complicates the measurements. The cross-linking was performed for 2 h at 215 °C and force curves were obtained at 15 min intervals. The change in apparent moduli of (PAH/PAA) PEMUs at pH 7.4/7.4 and 7.4/4.6 was monitored with respect to cross-linking time.
An AC240-TS silicon probe (Olympus Probes Inc.) was used to indent native multilayers and multilayers that were cross-linked for less than 45 min. This probe is 240 μm long and 50-μm wide, with a medium/soft spring constant of approximately 2 N m−1. Because the AC240-TS tip was unable to indent a multilayer that was cross-linked for more than 45 min at 215 °C, an AC160-TS silicon probe (Olympus Probes Inc.) was used for (PAH/PAA) multilayers that were cross-linked for greater than 45 min. This probe is 160 × 50 μm with a spring constant of around 40 N m−1. Both types of cantilevers have a tip radius less than 10 nm and a tip half angle less than 18°. The spring constant of each tip was calibrated in air using the thermal fluctuation method33,34 after calibration of the optical lever sensitivity (OLS) of the tip. After immersion of the tip in the buffer solution, the OLS was recalibrated. Force maps of at least 10 × 10 were acquired on the bare silicon wafer on which the tip was calibrated and on a 10 µm × 10 μm area of the PEMU surface. The distance from the surface for the force curves was set at 500 nm. The velocity of the tip in the z-direction was maintained at 1 μm sec−1. Data points were collected at a rate of 5 kHz. Calibration of the cantilever was checked periodically on a bare silicon wafer. The corresponding force applied on a surface was calculated using eq 2, where the deflection is multiplied by the spring constant of the tip.
Cell Culture and Microscopy
The A7r5 rat aortic smooth muscle cells were cultured in high glucose Dulbecco’s modified Eagle medium supplemented with 10% fetal bovine serum, 100 units mL−1 penicillin G, 100 μg mL−1 streptomycin, and 10 μg mL−1 gentamicin. For contraction experiments, A7r5 cells (1 × 10⁴ cell mL−1) were plated onto PEMU-coated glass coverslips in six-well dishes and grown for 48 h.
For imaging, cells were washed once with cold phosphate-buffered saline pH 7.4 (PBS) and then fixed with ice-cold acetone for 1 min. Following three washes with PBS, the cells were blocked with 1% bovine serum albumin (BSA) in PBS for 30 min. The fixed cells were incubated for 45 min either with antismooth muscle α-actin clone 1A4 IgG antibody (1:300 dilution) or anti-α-actinin clone BM-75.2 antibody IgM (1:200 dilution). The coverslips were washed three times with PBS and then incubated with Alexa 568-goat antimouse IgG or IgM antibodies (1:200 dilution), respectively, for 45 min. Some cells also were stained with Phalloidin Alexa 488 (Molecular Probes, Inc.). The coverslips were washed three times in PBS and mounted in Vectashield (Vector Laboratories Inc.) mounting medium containing 1.5 μg mL−1 4′,6-diamidino-2-phenylindole (DAPI). Stained cells were imaged with a Zeiss 510 confocal microscope. Analysis of contraction by determining α-actinin was performed using ImageJ software, version 1.32J (Wayne Rasband, National Institutes of Health, U.S.A.).
Reverse Transcriptase Polymerase Chain Reaction (RT-PCR)
For RT-PCR experiments, A7r5 cells were cultured on PEMU-coated glass culture dishes. The glass culture plates (75 mm) were coated with (PAA/PAH)2PAH PEMUs, which were cross-linked by heating at 215 °C for 2 h or left unheated (native). For each of three independent experiments done on different days, a culture of A7r5 cells was trypsinized, plated on three native and three cross-linked plates, and cultured for 60 h. Total RNA was isolated from the cells on each plate with TRIzol reagent (Invitrogen, Carlsbad, CA). The amount of total RNA in each of the six samples for each experiment was quantified using a NanoDrop spectrophotometer (Thermo Scientific, Wilmington, DE) and adjusted. First strand cDNA was generated using reverse transcriptase, an anchored dT primer, and 700 ng total RNA from each of the six samples. The cDNA was amplified using gene-specific primer pairs for the five contractile phenotype markers, the three synthetic phenotype markers, and the glyceraldehyde phosphate dehydrogenase (GAPDH) housekeeping protein control in separate reactions of 30 cycles each in a GeneAmp PCR System 9700 (Applied Biosystems, Foster City CA). The three experiments yielded a total of nine PCR samples from native PEMUs and nine PCR samples from cross-linked PEMUs for each of the analyzed markers, all of which were subjected to agarose gel electrophoresis and stained with ethidium bromide. The gels were imaged with a GelDoc system (Bio-Rad, Hercules, CA).
Cell Stimulation
A7r5 cells were grown on cross-linked (PAH/PAA)2PAH-coated coverslips for 4 days at 37 °C. To stimulate contraction, the media was exchanged with warm media containing 20 μM ionophore A23187 (added from a stock made in DMSO) or media containing the DMSO carrier alone for 5 min at 37 °C, after which the cells were fixed in 3.7% paraformaldehyde prepared in the culture media. The fixed cells were washed twice with PBS, permeabilized for 10 min in PBS containing 0.02% Triton X-100, and washed twice in Ca2+-Mg2+-free PBS containing 0.05% Triton X-100. Nonspecific binding was blocked by incubating the cells for 30 min at room temperature in Ca2+-Mg2+-free PBS containing 1% bovine serum albumin. Following blocking, the cells were incubated for 1 h at room temperature in anti-α-actinin antibody (1:80 dilution) followed by Alexa Fluor568 antimouse IgM secondary antibody in Ca2+-Mg2+-free PBS containing 1% bovine serum albumin. The cells then were washed twice for 5 min with Ca2+-Mg2+-free PBS, once for 5 min with PBS, and rinsed with H2O prior to mounting. Images were obtained with a Zeiss 510 confocal microscope. Spacing between α-actinin foci was determined with ImageJ software.
Results and Discussion
Polyelectrolyte pH Affects PEMU Thickness
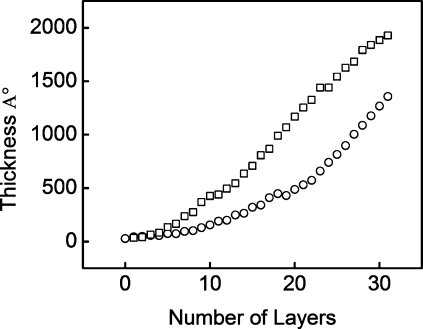
(PAH/PAA) multilayers were built with both PAH and PAA polyelectrolytes at pH 7.4 (pH 7.4/7.4) and with the PAH at pH 7.4 and the PAA at pH 4.6 (pH 7.4/4.6). Ellipsometry revealed that PEMUs built at pH 7.4/7.4 were thinner than the PEMUs built at pH 7.4/4.6 (Figure 1). The thickness of a (PAH/PAA)15PAH multilayer built at pH 7.4/7.4 in 0.15 M NaCl, 25 mM Tris-HCl, pH 7.4, buffer was approximately 140 nm, whereas the thickness of a (PAH/PAA)15PAH multilayer built at pH 7.4/4.6 was approximately 200 nm under the same ionic strength conditions. PAA has a higher charge density at pH 7.4 than at pH 4.6 and, therefore, is forced into a more stretched conformation, yielding thinner layers. Similar results were observed by Shiratori and Rubner(35) and Pavoor et al.(36)
Figure 1.
Layer by layer buildup for (◻) (PAH/PAA)xPAH built at pH 7.4/4.6 in 0.15 M NaCl, 25 mM Tris-HCl, and (○) (PAH/PAA)xPAH built at pH 7.4/7.4 in 0.15 M NaCl, 25 mM Tris-HCl.
Heating Covalently Cross-Links Layers in PAH/PAA PEMU
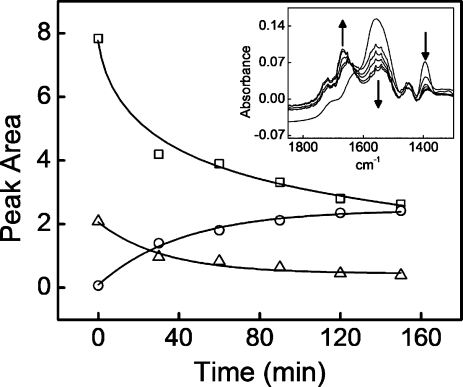
Heating of the PEMU films at 215 °C caused covalent cross-linking of the multilayers.(32) FTIR measurements taken over time revealed decreases in the area under peaks at both 1394 cm−1, asymmetric carboxylate stretch, and at 1556 cm−1, symmetric carboxylate stretch (Figure 2). Decreases in these peaks indicate a decrease in the concentration of the carboxylate functional groups in the bulk of the multilayer. A coincidental decrease was observed for the amine group at 2920 cm−1. In contrast, the area under the peak at 1668 cm−1 increased, demonstrating amide I bond formation. These changes are consistent with formation of amide bonds between the carboxylate and the amine groups in the PEMU.
Figure 2.
Heat-induced formation of covalent bonds between layers in PAH/PAA PEMU. Peak areas from FTIR vs cross-linking time of (PAH/PAA)35PAH pH 74./7.4 multilayer for (Δ) 1394 cm−1 asymmetric stretch of the carboxylate; (◻) 1556 cm−1 symmetric stretch of the carboxylate; and (○) 1668 cm−1 amide I bond that is formed from the carboxylate group of the PAA and the amine group of PAH. The lines are a guide to the eye. Inset: FTIR absorbance of native and cross-linked (PAH/PAA)35PAH multilayer. Cross-linking was performed at 215 °C for 150 at 30 min intervals. The decreasing peaks at 1394 cm−1 and 1556 cm−1 correspond to the carboxylate functional group. The increasing peak at 1668 cm−1 corresponds to the amide group. Down arrows show a decrease in the intensity of a peak, and the up arrow shows an increase in the intensity of the peak.
Figure 2 shows the changes in the areas under the referenced peaks representing the cross-linking over time of heating. By 30 min a high degree of cross-linking was achieved. After 2 h, approximately 60% of the functional groups have been cross-linked.
Layer Cross-Linking Decreases PEMU Swelling and Roughness
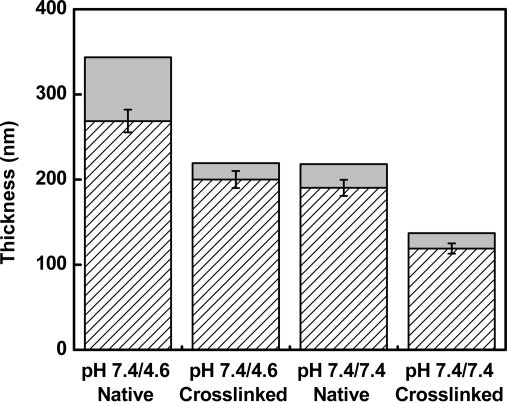
AFM measurements of the dimensions of a scratch in the PEMUs revealed that native un-cross-linked (PAH/PAA)15PAH multilayers built at pH 7.4/7.4 had a dry thickness of 190 nm (Figure 3). This dimension differs from that for 31 layers in Figure 1. The surfaces measured in Figure 1 were dried between each layer deposition for the ellipsometry measurements. The native surfaces built for additional experimentation were dried only after deposition of the terminal layer. Cross-linking of this type of PEMU by heating to 215 °C for 2 h caused a decrease in the dry thickness to 119 nm. After wetting in 0.15 M NaCl, 25 mM Tris-HCl pH 7.4 buffer for 30 min, the native PEMU swelled to a thickness of 218 nm, a 15% increase in thickness, and the cross-linked PEMU swelled to a thickness of 137 nm, also a 15% increase in thickness. In both the dry and the swollen PEMUs, however, the cross-linked pH 7.4/7.4 PEMUs were 37% thinner than the native PEMUs (Figure 3).
Figure 3.
Swelling behavior for native and cross-linked polyelectrolyte multilayers. (PAH/PAA)15PAH PEMU dry thickness (hatched) and wet thickness after swelling the PEMUs in a 0.15 M NaCl, 25 mM Tris-HCl, pH 7.4 solution for 30 min (gray). Thickness measurements were obtained by AFM using an AC240-TS silicon cantilever.
(PAH/PAA)15PAH multilayers built at pH 7.4/4.6 also exhibited shrinking and swelling under similar conditions. The dry native multilayer was 269 nm. Cross-linking of this PEMU decreased the dry thickness to 200 nm. After wetting in the Tris-HCl buffer, the native PEMU swelled to 344 nm, a 28% increase in thickness, and the cross-linked PEMU swelled to a thickness of 220 nm, which corresponds to a 10% increase only, indicating that the PEMUs prepared at pH 7.4/4.6 cross-linked more efficiently than the multilayers prepared at pH 7.4/7.4, both the native and cross-linked 7.4/7.4 PEMUs were 36% thinner than the 7.4/4.6 counterparts (Figure 3).
Swelling of the multilayers in buffer also affected the surface topology. The surface roughness of the native PEMUs decreased from approximately 4 to 2 nm for the PEMUs built at pH 7.4/7.4 and from 11 to 6 nm for the PEMUs built at pH 7.4/4.6.
No significant change in contact angle was observed between native and cross-linked (PAH/PAA) multilayers. Measurements performed by sessile drop static contact angle varied between 5° and 10° for all native and cross-linked samples.
Fitting and Analysis of PEMU AFM Force Curves
Force curves obtained from AFM experiments usually are analyzed using one of three mathematical methods based on the Hertzian contact mechanics. All three models provide classical solutions to the indentation of a semifinite substrate with a hard indenter. Equation 3 describes the Hertz model(37) where the material is a hard sphere indenting a soft flat sample. The Sneddon model(38) is described by eq 4 where a cone is used as the indenter. The force-displacement relationship for a punch indenter is described in eq 5. For the Hertz model to work, the indentation should be significantly smaller than the radius of the sphere. In the Sneddon model, the apex of the cone has to be infinitely sharp. The fitting works best when the indentation is less than 10% of the total substrate thickness. Under this condition, the mechanical properties of the film are not convoluted with those of the substrate. The distance (δ) that the probe indents in the material, the relationship between the applied force (F), and the modulus (E) for each of the models are described below.
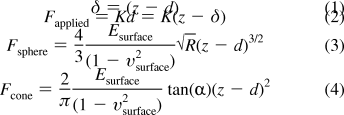 |
R is the radius of the sphere or the punch; α is the half angle of the cone; z is the distance of the tip relative to the surface in the z-direction; K is the spring constant of the cantilever in use; d is the deflection of the tip, and υ is the Poisson ratio of the material, which is the ratio of transverse contraction strain to longitudinal extension strain in the direction of stretching force.
The three Hertzian models have different power dependencies on the indentation, resulting in different force-displacement profiles. The force of the punch model is directly proportional to the indentation, the force of the sphere model is proportional to the indentation raised to the power 1.5, and the force of the cone model is proportional to the square of the indentation.(39) AFM tips are usually 3−5 μm long. In this work we kept the indentation distances between 20 and 30 nm. Even though most AFM tips, including AC240-TS and AC160-TS tips, are conical in shape, the apex of the tip can never be perfectly round or infinitely sharp. It is crucial to have all the necessary information about the shape of the tip, especially the part that is actually indenting the material. Korsunsky(39) showed how actual measured force-displacement curves can deviate from ideal models if the wrong assumption is made about the indenter shape. He also described how the shape of the indenter can be determined by solving the inverse problem in the mechanics of indentation.(39)
The native PEMUs showed force-displacement curves that fit the cone model. In contrast, all the cross-linked multilayers showed force-displacement relationships with a linear behavior that fits the punch model. When the corresponding model was used, the fitted data yielded the fit parameter EC that relates the compliance of the indenter to the compliance of the indentee. EC can be deconvoluted into Young’s modulus values using eq 6
where EC, the fit parameter for the corresponding model, is directly related to the Young’s modulus and Poisson ratio of the indenter material and the indented material, E1 and υ1 are, respectively, the modulus and the Poisson ratio of the indented material, and E2 and υ2 are the modulus and the Poisson ratio of the indenter, in our case, a silicon cantilever. The value of E2 was set at 150 GPa and υ2 was set at 0.27 for silicon. The PEMUs were considered to be perfectly elastic in the range of applied forces, so υ1 was set at 0.5. Force curves were offset in the x and y directions to set the contact point to zero force and zero distance. The range fitted was between 0 and 20−30 nm indentation depending on the sample thickness. For the cone model, the half angle of the cone was set at 10°. For the punch model, the radius of the punch was set at 10 nm. The average apparent modulus from 10 random force curves for each sample is reported. Fits using the cone model and the punch model are presented in the Supporting Information.
PEMU Mechanical Properties
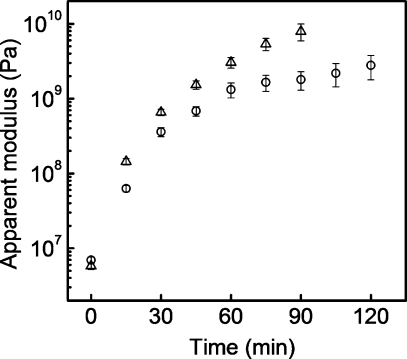
To change the bulk properties and structure of PEMUs, PAA was used at either pH 7.4 or 4.6. The pKa of carboxylic acids is approximately 4, therefore, PAA is fully charged at pH 7.4 but only partially charged at pH 4.6. Native PEMUs built at pH 7.4/7.4 were 30% thinner than PEMUs built at pH 7.4/4.6. The thicker pH 7.4/4.6 (PAH/PAA)15PAH PEMUs, with a larger number of extrinsic sites, had an apparent Young’s modulus of 5.7 MPa. The thinner pH 7.4/7.4 native PEMUs were slightly stiffer with an apparent Young’s modulus of 6.9 MPa. When cross-linked, however, the pH 7.4/4.6 multilayers reached higher apparent modulus values than multilayers built at pH 7.4/7.4. This relationship was apparent early in the cross-linking process. After 15 min of cross-linking, the apparent modulus for the pH 7.4/4.6 PEMU was 140 MPA and 62 MPa for the pH 7.4/7.4 PEMU (Figure 4). After 2 h of cross-linking, the value for the pH 7.4/7.4 PEMU was 2.8 GPa. The highest apparent modulus value that was measured for the pH 7.4/4.6 PEMU was 8 GPa at 90 min of cross-linking. Although accurate values for this PEMU after 90 min of cross-linking were not obtained, because they exceeded the maximum value measurable with the technique, the trend indicates that they are greater than 8 GPa. Similar results were obtained by Pavoor et al.(36) and Thompson et al.(40) The cross-linked pH 7.4/4.6 PEMUs were not only stiffer than the pH 7.4/7.4 PEMUs but the cross-linking rate also was faster. The faster cross-linking rate is likely due to a faster amide bond formation when the PAA is protonated. PAA at pH 4.6 also has what is referred to as a more “loopy” structure than PAA at pH 7.4;(36) this conformational difference could allow more interpenetration between the polymers in the multilayer, thus affecting the cross-linking kinetics and number.
Figure 4.
Apparent modulus vs cross-linking time of native and cross-linked hydrated (PAH/PAA)15PAH multilayers in 0.15 M NaCl, 25 mM Tris-HCl, pH 7.4. (○) PEMU built at pH 7.4/7.4, wet thickness was 218 nm before cross-linking; (△) PEMU built at pH 7.4/4.6, wet thickness was 343 nm before cross-linking.
PEMU Compliance Affects A7r5 Cell Expression of Smooth Muscle Phenotype Markers
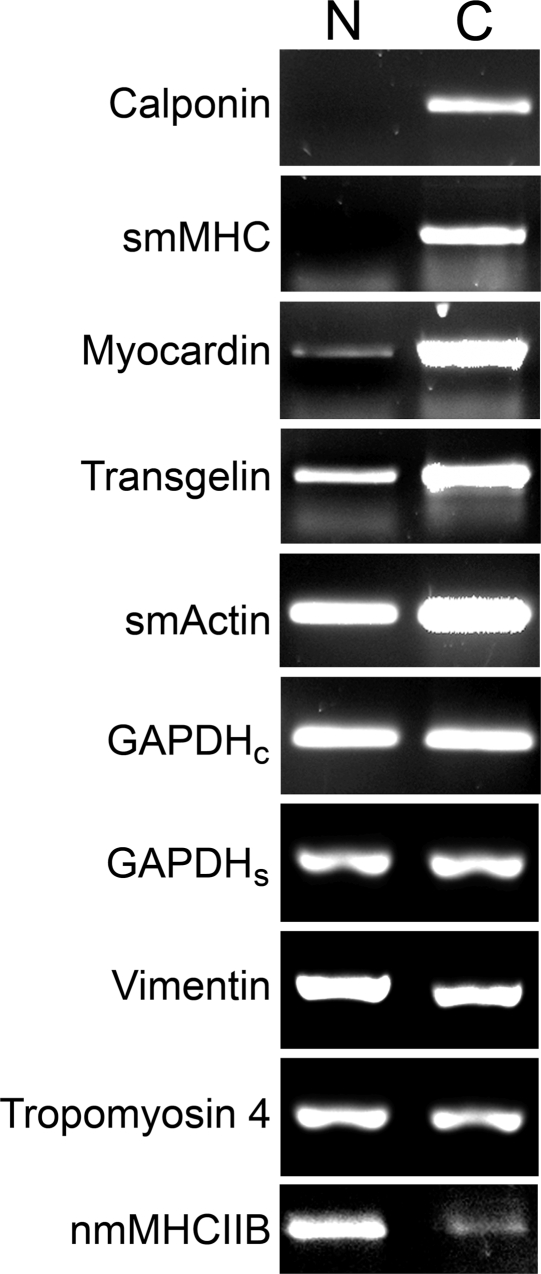
In our prior work on SMCs grown on multilayers, we relied on patterns of stained actin filaments and measurements of motility to distinguish smooth muscle cell phenotypes. In the present work, RT-PCR of mRNA encoding several contractile and synthetic phenotype markers(41) was used to determine whether culture on the native and cross-linked PEMUs with different rigidities affects smooth muscle cell phenotype. Triplicate samples of cells grown on native and cross-linked PEMUs in three separate experiments were analyzed. Although there was some variability, all nine samples of cells grown on the cross-linked PEMUs contained higher levels of mRNA for the contractile marker proteins smooth muscle α-actin and smooth muscle myosin heavy chain, components of the smooth muscle contractile apparatus; calponin, which regulates smooth muscle contration;(44) myocardin, which induces conversion to the contractile phenotype as a transcriptional coactivator of serum response factor;(44) and transgelin, formerly known as SM22, one of the earliest markers of smooth muscle cell differentiation.(45) Cells grown on the cross-linked PEMUs also contained lower levels of mRNA for the synthetic marker proteins vimentin, an intermediate filament protein;(46) tropomyosin 4, a small isoform of an actin-filament associated protein(47) and nonmuscle myosin heavy chain IIB, an isoform not associated with the smooth muscle contractile apparatus, all of which are expressed at higher levels in synthetic smooth muscle cells, than the cells grown on native PEMUs (Figure 5).28,42,43 These data support the conclusion that growth on a more rigid substrate promotes smooth muscle cell conversion to the contractile phenotype. Expression of GAPDH, generally recognized to be independent of phenotype, was used as an internal reference for comparison.
Figure 5.
RT-PCR analysis of smooth muscle phenotype marker protein mRNA expression in A7r5 cells cultured on native and cross-linked (PAA/PAH)5PAH PEMUs. A7r5 cells were cultured for five days on native (N) and cross-linked (C; heated for 2 h at 215 °C) PEMUs. Total RNA isolated from the two sets of cells was analyzed using reverse transcriptase-PCR. First-strand cDNA from each set of cells was generated with an anchored dT primer and amplified with gene-specific primers for the “contractile” phenotype marker proteins calponin, smooth muscle myosin heavy chain (smMHC), myocardin, transgelin, and smooth muscle α-actin (smActin) and the “synthetic” phenotype marker proteins vimentin, tropomyosin 4, and nonmuscle myosin heavy chain IIB (nmMHCIIB). Only the specific regions of ethidium bromide-stained agarose gels that contain the relevant PCR products are shown. The contractile and synthetic markers were analyzed in separate experiments, each of which included a glyceraldehyde phosphate dehydrogenase (GAPDH) loading controls. The amount of PCR product loaded on the gels was adjusted to equalize the amount of GAPDH housekeeping protein from each of the conditions. GAPDHc bands are loading controls for this set of contractile markers. GAPDHs bands are loading controls for this set of synthetic markers.
Incorporation of Smooth Muscle α-Actin into Stress Fiber-Like Structures in Cells Grown on Cross-Linked PEMU
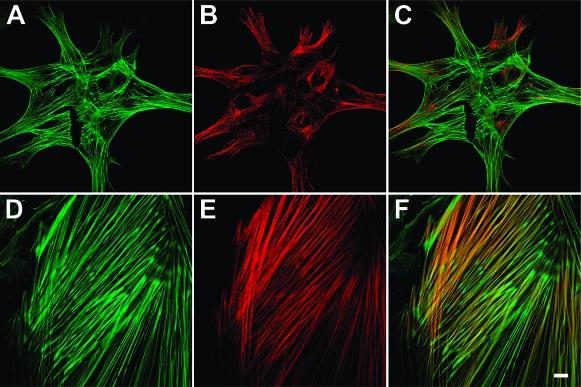
In addition to increased expression of smooth muscle α-actin in cells on the cross-linked PEMU, there is a redistribution of the α-actin. Immunofluorescent localization with an isoform-specific antibody revealed that little of the relatively low level of smooth muscle α-actin expressed in the cells grown on the native PEMU localized in the stress fiber-like structures, which likely are composed primarily of β-actin (Figure 6). In contrast, the robust stress fiber-like structures, especially in the central region of the cells grown on cross-linked PEMU, stain heavily for smooth muscle α-actin. The peripheral stress fiber-like structures in these cells appear to remain composed primarily of β-actin, at least at this stage of the conversion.
Figure 6.
Localization of total actin and smooth muscle α-actin in A7r5 cells cultured on native and cross-linked PEMUs. Cells were grown for 3 days on native (A−C) and cross-linked (D−F) (PAH/PAA)4PAH-coated coverslips. Actin filaments are stained with Phalloidin-Alexa 488 (green) and smooth muscle α-actin is labeled with a specific anti-α-actin antibody and Alexa 546-secondary antibody (B and E). Overlaid dual-labeled images (C and F; scale bar = 10 μm).
Ca2+-Dependent Shortening of Stress Fiber-Like Structures in Smooth Muscle A7r5 Cells Grown on Cross-Linked PEMU
To further investigate possible conversion of the A7r5 cells to the contractile phenotype, contractibility of the cells grown on the cross-linked PEMU was tested by stimulation with the Ca2+ ionophore A23187, which increases cytosolic Ca2+ concentration.(48) An increase in cytosolic Ca2+ concentration stimulates contraction of A7r5 smooth muscle cells through activation of actin-myosin II force production in the contractile apparatus.(48) Although contraction dramatically shortened some of the cells as they lost adhesion to the PEMU (not shown), most of the cells remained adhered to the PEMU substrate but exhibited force production in the stress fiber-like structures through a significant decrease in the distances between α-actinin foci along the structures (Figure 7). This decrease, from a mean of approximately 1 μm to a mean of less than 0.4 μm between the α-actinin foci, was not found when the less well-spread cells growing on the native PEMU were treated with the A23187 (data not shown). Although contractile force was not measured directly, these results are consistent with the conclusion that the smooth muscle cells grown on the cross-linked PEMU convert to the contractile phenotype.
Figure 7.
Ca2+-dependent shortening of contractile structures in an A7r5 cell grown for 3 days on a cross-linked (PAH/PAA)4PAH-coated coverslips. Cells were treated with (A) DMSO carrier alone (control) and (B) DMSO containing A23187 (at a final concentration of 20 μM in the culture media) for 5 min. The cells were fixed and stained with a mouse anti-α-actinin monoclonal primary antibody and an Alexa Fluor 568 goat antimouse IgM secondary antibody. Shortening of the stress fiber-like structures was assessed by measuring the distances between α-actinin foci. Insets show enlarged examples of positions assigned to the α-actinin foci in control (A, inset) and A23187-treated (B, inset) cells. (C) The histogram shows the mean ± SEM distances between α-actinin foci in the cells shown in (A) A and (B) B (n = 50 measurements per cell). The difference in visibility of the nucleus is due to the more flattened nature of the contractile cell and slightly different planes of focus for the images. Scale bars represent 20 μm in images A and B and 1 μm in the insets.
Conclusions
Heat-induced formation of amide covalent bonds between layers in (PAH/PAA) PEMUs built layer by layer produced thin biocompatible substrates of varying rigidity. The pH of the polyelectrolyte building solutions affected the thickness, kinetics of cross-linking, and Young’s modulus of the PEMUs. The PEMUs that were built at pH 7.4/4.6 were thicker and more flexible than PEMUs built at pH 7.4/7.4 but cross-linked faster when exposed to heat and became more rigid after 2 h of cross-linking at 215 °C. Cross-linking varied the Young’s modulus over 3 orders of magnitude. Although the nature and chemistry of the native and cross-linked (PAH/PAA) PEMUs were similar, A7r5 cells cultured on the multilayers modulated phenotype in response to the PEMU mechanical properties. On the more flexible native PEMUs, the cells expressed higher levels of mRNA encoding proteins that are markers for the motile synthetic phenotype and lower levels of mRNA encoding the contractile phenotype marker proteins. Cells cultured on the more rigid cross-linked PEMUs showed the inverse effect. Moreover, those cells produced contractile force when stimulated with a Ca2+ ionophore. In addition to providing morphological, molecular, and functional evidence that the cellular behavior is modulated by the mechanical properties of the culture substrate, this investigation demonstrates that covalent multilayer cross-linking is an additional tool with which to build PEMUs that may be useful for biocompatible coatings.
Acknowledgments
We wish to thank Dr. Joan Hare for help with cell culture and Kim Riddle for help with microscopy. This work was supported by a grant from the National Institute of Health (5R01EB006158-02).
Supporting Information Available
Fitting examples of force curves as a function of the indentation distance obtained by AFM from native and cross-linked (PAH/PAA)15PAH multilayers built at pH 7.4/4.6, and characteristics of native and cross-linked (PAH/PAA) multilayers built at pH 7.4/7.4 and pH 7.4/4.6 measured by AFM. This material is available free of charge via the Internet at http://pubs.acs.org.
Funding Statement
National Institutes of Health, United States
Supplementary Material
References
- Ingber D. E. Int. J. Dev. Biol. 2006, 50, 255–266. [DOI] [PubMed] [Google Scholar]
- Engler A. J.; Griffin M. A.; Sen S.; Bonnemann C. G.; Sweeney H. L.; Discher D. E. J. Cell Biol. 2004, 166, 877–887. [DOI] [PMC free article] [PubMed] [Google Scholar]
- Shake J. G.; Gruber P. J.; Baumgartner W. A.; Senechal G.; Meyers J.; Redmond J. M.; Pittenger M. F.; Martin B. J. Ann. Thorac. Surg. 2002, 73, 1919–1925. [DOI] [PubMed] [Google Scholar]
- McBeath R.; Pirone D. M.; Nelson C. M.; Bhadriraju K.; Chen C. S. Dev. Cell. 2004, 6, 483–495. [DOI] [PubMed] [Google Scholar]
- Pelham R. J.; Wang Y. L. Proc. Natl. Acad. Sci. U.S A. 1997, 94, 13661–13665. [DOI] [PMC free article] [PubMed] [Google Scholar]
- Lo C.-M.; Wang H.-B.; Dembo M.; Wang Y.-l. Biophys. J. 2000, 79, 144–152. [DOI] [PMC free article] [PubMed] [Google Scholar]
- Yeung T.; Georges P. C.; Flanagan L. A.; Marg B.; Ortiz M.; Funaki M.; Zahir N.; Ming W. Y.; Weaver V.; Janmey P. A. Cell Motil. Cytoskeleton 2005, 60, 24–34. [DOI] [PubMed] [Google Scholar]
- Olenych S. G.; Moussallem M. D.; Salloum D. S.; Schlenoff J. B.; Keller T. C. S. Biomacromolecules 2005, 6, 3252–3258. [DOI] [PubMed] [Google Scholar]
- Salloum D. S.; Olenych S. G.; Keller T. C. S.; Schlenoff J. B. Biomacromolecules 2005, 6, 161–167. [DOI] [PubMed] [Google Scholar]
- Engler A.; Bacakova L.; Newman C.; Hategan A.; Griffin M.; Discher D. Biophys. J. 2004, 86, 617–628. [DOI] [PMC free article] [PubMed] [Google Scholar]
- Decher G. Science 1997, 277, 1232–1237. [Google Scholar]
- Decher G.; Schlenoff J. B.. Multilayer Thin Films: Sequential Assembly of Nanocomposite Materials; Wiley VCH: Weinheim, 2003. [Google Scholar]
- Yang S. Y.; Mendelsohn J. D.; Rubner M. F. Biomacromolecules 2003, 4, 987–994. [DOI] [PubMed] [Google Scholar]
- Mendelsohn J. D.; Yang S. Y.; Hiller J.; Hochbaum A. I.; Rubner M. F. Biomacromolecules 2003, 4, 96–106. [DOI] [PubMed] [Google Scholar]
- Sinani V. A.; Koktysh D. S.; Yun B. G.; Matts R. L.; Pappas T. C.; Motamedi M.; Thomas S. N.; Kotov N. A. Nano Lett. 2003, 3, 1177–1182. [Google Scholar]
- Tryoen-Toth P.; Vautier D.; Haikel Y.; Voegel J. C.; Schaaf P.; Chluba J.; Ogier J. J. Biomed. Mater. Res. 2002, 60, 657–667. [DOI] [PubMed] [Google Scholar]
- Berg M. C.; Yang S. Y.; Hammond P. T.; Rubner M. F. Langmuir 2004, 20, 1362–1368. [DOI] [PubMed] [Google Scholar]
- Boura C.; Menu P.; Payan E.; Picart C.; Voegel J. C.; Muller S.; Stoltz J. F. Biomaterials 2003, 24, 3521–3530. [DOI] [PubMed] [Google Scholar]
- Richert L.; Boulmedais F.; Lavalle P.; Mutterer J.; Ferreux E.; Decher G.; Schaaf P.; Voegel J. C.; Picart C. Biomacromolecules 2004, 5, 284–294. [DOI] [PubMed] [Google Scholar]
- Koktysh D. S.; Liang X. R.; Yun B. G.; Pastoriza-Santos I.; Matts R. L.; Giersig M.; Serra-Rodriguez C.; Liz-Marzan L. M.; Kotov N. A. Adv. Funct. Mater. 2002, 12, 255–265. [Google Scholar]
- Richert L.; Schneider A.; Vautier D.; Vodouhe C.; Jessel N.; Payan E.; Schaaf P.; Voegel J. C.; Picart C. Cell Biochem. Biophys. 2006, 44, 273–285. [DOI] [PubMed] [Google Scholar]
- Engler A. J.; Carag-Krieger C.; Johnson C. P.; Raab M.; Tang H.-Y.; Speicher D. W.; Sanger J. W.; Sanger J. M.; Discher D. E. J. Cell Sci. 2008, 121, 3794–3802. [DOI] [PMC free article] [PubMed] [Google Scholar]
- Rehfeldt F.; Engler A. J.; Eckhardt A.; Ahmed F.; Discher D. E. Adv. Drug Delivery Rev. 2007, 59, 1329–1339. [DOI] [PMC free article] [PubMed] [Google Scholar]
- Wong J. Y.; Leach J. B.; Brown X. Q. Surf. Sci. 2004, 570, 119–133. [Google Scholar]
- Wong J. Y.; Velasco A.; Rajagopalan P.; Pham Q. Langmuir 2003, 19, 1908–1913. [Google Scholar]
- Schlunck G.; Han H.; Wecker T.; Kampik D.; Meyer-Ter-Vehn T.; Grehn F. Invest. Ophthalmol. Vis. Sci. 2008, 49, 262–269. [DOI] [PubMed] [Google Scholar]
- Halayko A. J.; Solway J. J. Appl. Physiol. 2001, 90, 358–368. [DOI] [PubMed] [Google Scholar]
- Rensen S. S. M.; Doevendans P. A. F. M.; van Eys G. J. J. M. Neth. Heart J. 2007, 15, 100–108. [DOI] [PMC free article] [PubMed] [Google Scholar]
- Newby A. C.; Zaltsman A. B. J. Pathol. 2000, 190, 300–309. [DOI] [PubMed] [Google Scholar]
- Orford J. L.; Selwyn A. P.; Ganz P.; Popma J. J.; Rogers C. Am. J. Cardiol. 2000, 86, 6H–11H. [DOI] [PubMed] [Google Scholar]
- Lee B. J.; Kunitake T. Langmuir 1994, 10, 557–562. [Google Scholar]
- Harris J. J.; DeRose P. M.; Bruening M. L. J. Am. Chem. Soc. 1999, 121, 1978–1979. [Google Scholar]
- Hutter J. L.; Bechhoefer J. Rev. Sci. Instrum. 1993, 64, 1868–1873. [Google Scholar]
- Thundat T.; Warmack R. J. Appl. Phys. Lett. 1994, 64, 2894–2896. [Google Scholar]
- Shiratori S. S.; Rubner M. F. Macromolecules 2000, 33, 4213–4219. [Google Scholar]
- Pavoor P. V.; Bellare A.; Strom A.; Yang D.; Cohen R. E. Macromolecules 2004, 37, 4865–4871. [Google Scholar]
- Johnson K. L.; Kendall K.; Roberts A. D. Proc. R. Soc. A 1971, 324, 301–313. [Google Scholar]
- Sneddon I. N. Int. J. Eng. Sci. 1965, 3, 47–57. [Google Scholar]
- Korsunsky A. M. J. Strain Anal. Eng. 2001, 36, 391–400. [Google Scholar]
- Thompson M. T.; Berg M. C.; Tobias I. S.; Rubner M. F.; Van Vliet K. J. Biomaterials 2005, 26, 6836–6845. [DOI] [PubMed] [Google Scholar]
- Owens G. K. Physiol. Rev. 1995, 75, 487–517. [DOI] [PubMed] [Google Scholar]
- Halayko A. J.; Salari H.; Ma X.; Stephens N. L. Am. J. Physiol. Lung Cell Mol. Physiol. 1996, 270, L1040–1051. [DOI] [PubMed] [Google Scholar]
- Owens G. K.; Kumar M. S.; Wamhoff B. R. Physiol. Rev. 2004, 84, 767–801. [DOI] [PubMed] [Google Scholar]
- Morgan K. G.; Gangopadhyay S. S. J. Appl. Physiol. 2001, 91, 953–962. [DOI] [PubMed] [Google Scholar]
- Assinder S. J.; Stanton J. A. L.; Prasad P. D. Int. J. Biochem. Cell Biol. 2009, 41, 482–486. [DOI] [PubMed] [Google Scholar]
- Goldman R. D.; Khuon S.; Chou Y. H.; Opal P.; Steinert P. M. J. Cell Biol. 1996, 134, 971–983. [DOI] [PMC free article] [PubMed] [Google Scholar]
- Abouhamed M.; Reichenberg S.; Robenek H.; Plenz G. Eur. J. Cell Biol. 2003, 82, 473–482. [DOI] [PubMed] [Google Scholar]
- Li C.; Fultz M. E.; Parkash J.; Rhoten W. B.; Wright G. L. J. Muscle Res. Cell Motil. 2001, 22, 521–534. [DOI] [PubMed] [Google Scholar]
Associated Data
This section collects any data citations, data availability statements, or supplementary materials included in this article.


