

Abstract
We have analyzed the interstitial water (ISW) structures in 1500 protein crystal structures deposited in the Protein Data Bank that have greater than 1.5 Å resolution with less than 90% sequence similarity with each other. We observed varieties of polygonal water structures composed of three to eight water molecules. These polygons may represent the time- and space-averaged structures of “stable” water oligomers present in liquid water, and their presence as well as relative population may be relevant in understanding physical properties of liquid water at a given temperature. On an average, 13% of ISWs are localized enough to be visible by X-ray diffraction. Of those, averages of 78% are water molecules in the first water layer on the protein surface. Of the localized ISWs beyond the first layer, almost half of them form water polygons such as trigons, tetragons, as well as expected pentagons, hexagons, higher polygons, partial dodecahedrons, and disordered networks. Most of the octagons and nanogons are formed by fusion of smaller polygons. The trigons are most commonly observed. We suggest that our observation provides an experimental basis for including these water polygon structures in correlating and predicting various water properties in liquid state.
Keywords: crystal structure, hydration structure, hydrogen bonding, interstitial water, protein data bank, water cluster, bulk water
Introduction
Most of the water on earth surface and in living organisms is in liquid phase. Although molecular basis of physical properties of water in gas and solid phases is relatively well understood, that of liquid water is not. The structural model for liquid water ranges from the random network model1 at one end and the icosahedral cluster model2 at the other depending on the arrangement of water clustering. Water clusters have been characterized in many different spectroscopic studies,3,4 as well as observed by X-ray diffraction studies in some small molecule crystals5 and in almost all protein crystals.6 We have analyzed the interstitial water (ISW) structures beyond the first water layer of protein surface in 1561 unique high-resolution protein crystal structures deposited in the Protein Data Bank (PDB).7 We observed and analyzed varieties of polygonal water structures composed of three to eight water molecules, which may be considered as representing the time- and space-averaged structures of “stable” water polygons present in liquid water. Their presence as well as relative population may be relevant in understanding physical properties of liquid water under various conditions.
Most globular proteins form crystals leaving a varying volume of space (interstitial space) between the protein molecules filled with mostly ISWs. On an average, the interstitial space accounts for about 50% of the protein crystal volume. In most cases, a large fraction of ISWs are disordered, thus, not “visible” by X-ray diffraction, but some are localized at distinct positions, thus, “visible” in an electron density map. ISWs have been actively studied by many different methods including X-ray diffraction,5,6 neutron diffraction,8 nuclear magnetic resonance,9 and molecular dynamics simulation.10 These have helped us understand the general water structure by solvent electron density,11 the structure of protein solvation network,12 and ordered water positions on the surface of biological molecules.13 From studies of ISWs in the crystal of a small protein Crambin,6 Teeter observed a series of pentameric hydrogen bond (H-bond) network around Leu-18. However, because of small interstitial space of Crambin crystals, almost all ISWs in Crambin crystals are directly bound to protein atoms and confined in the first water layer on the surface of the protein, thus, cannot be considered as representing “bulk” water.
Results
Database of selected high-resolution structures
Statistics for selected protein structures are summarized in Table I. We have selected 1561 protein crystal structures deposited in the PDB that have better than 1.5 Å resolution with less than 90% sequence similarity with each other. Datasets have an average resolution of 1.3 Å and have an average R-factor of 16% with standard deviation of 0.2 Å and 3%, respectively, indicating that the coordinates used are of high accuracy. The dataset is also diverse as indicated by the fact that the average molecular weight of proteins is 38 kDa with a large standard deviation of 41 kDa, and the average solvent content percentage is 48% with a standard deviation of 7.4%. About 96% of the structures were solved by cryocrystaollography with data collection temperature equal or below 200 K.
Table I.
Crystal and Structure Determination Statistics of 1567 PDB Coordinates Used
| Average | Standard deviation | Maximum | Minimum | |
|---|---|---|---|---|
| Resolution (Å) | 1.32 | 0.18 | 1.50 | 0.65 |
| R (%) | 16.3 | 3.4 | 29.1 | 6.5 |
| R-Free (%) | 19.2 | 3.4 | 32.5 | 7.6 |
| Data collection temp (K) | 110 | 39 | 300 | 75 |
| Crystallization pH | 6.66 | 1.36 | 10.50 | 1.50 |
| Protein molecular weight (kDa) | 38.5 | 41.0 | 460.3 | 4.0 |
| Solvent content (%) | 48 | 7 | 77 | 25 |
Resolution, R-work value (Rwork = Σ|Fo − Fc|/Σ Fo of the all the reflections except reflections excluded for R-free calculation), and R-free values (equivalent to Rwork calculated from a randomly chosen 5% of total reflections excluded from the refinement), data collection temperature, and crystallization pH were directly extracted from the respective PDB files of the protein structures. Seventy-one datasets did not report R-free values and are presumed to be solved before R-free was required for PDB deposition. About 200 datasets did not report data collection temperature and crystallization pH, and they were omitted from the statistics in their respective categories. Solvent content was calculated following delocalized ISW calculation in the Materials and Methods section.
Localized versus delocalized waters
Water statistics are summarized in Table II. Average number of waters per molecular weight of protein is 11.8 kDa−1 with a standard deviation of 3.9 kDa−1. This shows that on an average of 12 water molecules are localized per kDa of protein. Assuming each water molecule occupies 11.5 Å3 (see Materials and Methods section), an average of 87.5% of waters in protein crystals are delocalized with a standard deviation of 5.8%.
Table II.
Statistics of Localized and Delocalized Waters
| Average | Standard deviation | Maximum | Minimum | |
|---|---|---|---|---|
| Localized waters in asymmetric unit | 430 | 453 | 5031 | 9 |
| Localized water per protein MW (kDa−1) | 11.76 | 3.93 | 32.17 | 0.38 |
| Percentage of localized water | 12.5 | 5.8 | 45.6 | 0.2 |
| Percentage of delocalized water | 87.5 | 5.8 | 99.8 | 54.4 |
| Percentage of first-layer localized water | 78.1 | 7.8 | 100.0 | 46.9 |
| Percentage of outer layer localized water | 21.9 | 7.8 | 53.1 | 0.0 |
Localized waters are water molecules that are visible in an electron density map. The first layer is defined as the layer of water molecules that are closer than 3.4 Å from H-bond capable surface protein atoms. The outer layer is defined as the “bulk” space beyond the first layer.
First layer versus “bulk” space waters
ISWs are in an environment similar to bulk water except those in the first water layer on the protein surface. Even ISW on the first layer has free energy and entropic costs similar to the bulk water based on estimations compared with small molecule salt hydrates.14,15 As we want to characterize water polygons close to bulk water environment as much as possible, we categorized ISWs into two categories: first layer and “bulk” space. We defined the first-layer water as any water that is located closer than the estimated H-bond limit, 3.4 Å (see Materials and Methods section), from protein atoms that can form H-bond. We classified all the waters that are not in the first layer as “bulk” water. Localized ISWs in the bulk space are localized primarily because of H-bonding network among waters. We found that on an average of 78% of localized ISWs are on the first layer and 22% are in bulk space with a standard deviation of 8% between the structures in our dataset.
Water polygons
The vertex length range of water polygons is set between 2.4 and 3.2 Å to pick up only specific H-bonding interactions. Furthermore, to reduce the effect of first water layers, we calculated and characterized all water polygons formed mostly by the waters in bulk space by counting polygons that have equal or greater than 2/3 of vertex points in bulk space. For example, trigon with two or three waters, tetragon with three or four waters, hexagon with four to six waters in bulk space, and so forth. All polygons discussed in this article refer to water polygons satisfying these criteria. The statistics of vertex distances and angles are in Table III.
Table III.
Statistics of Vertex Distances and Angles in Water Polygons
| O—O distance (Å) |
O—O—O angle (°) |
|||||
|---|---|---|---|---|---|---|
| Histogram peak | Average | Standard deviation | Histogram peak | Average | Standard deviation | |
| Trigon | 2.70 | 2.80 | 0.21 | 59 | 60 | 6 |
| Tetragon | 2.73 | 2.82 | 0.19 | 89 | 87 | 19 |
| Pentagon | 2.73 | 2.79 | 0.15 | 104 | 104 | 12 |
| Hexagon | 2.70 | 2.79 | 0.16 | 112 | 108 | 16 |
| Heptagon | 2.70 | 2.79 | 0.17 | 107 | 110 | 19 |
Average vertex distance and angle increase, whereas the distance standard deviation decreases as the number of polygon vertices increases. Many heptagons are the fusion of smaller polygons. Statistics for each polygon are sampled from a comparable number of data points (∼10,000).
Water polygon modeling and quantitation
The unit cell views of modeled water polygons in a few diverse crystal structures are shown in Figure 1. As previously discussed, the presence of a large number of pentagons is noticeable in many structures. Figure 1(C) shows one of the structures with water networks forming partial dodecahedron structure. Systematically counting the number of water polygons in a unit cell shows that the trigons are the most common water polygon found in protein crystals (Table IV). From 34,000 water polygons counted (only including trigons to heptagons) from all the structures examined, 43% are trigons followed by pentagons (24%), hexagons (17%), tetragons (12%), and heptagons (4%). Among protein crystals, the average number of polygons per protein crystal follows the same trend, where trigon is the highest (9.3), followed by pentagons (5.2), hexagons (3.7), tetragons (2.5), and heptagons (0.8) (see Figure 2). As the low average number indicates, most protein crystals do not have water polygons. Four hundred eighty structures (31%) have no water polygons at all, and only 72 structures (4.6%) have more than 100 total polygons in a unit cell.
Figure 1.
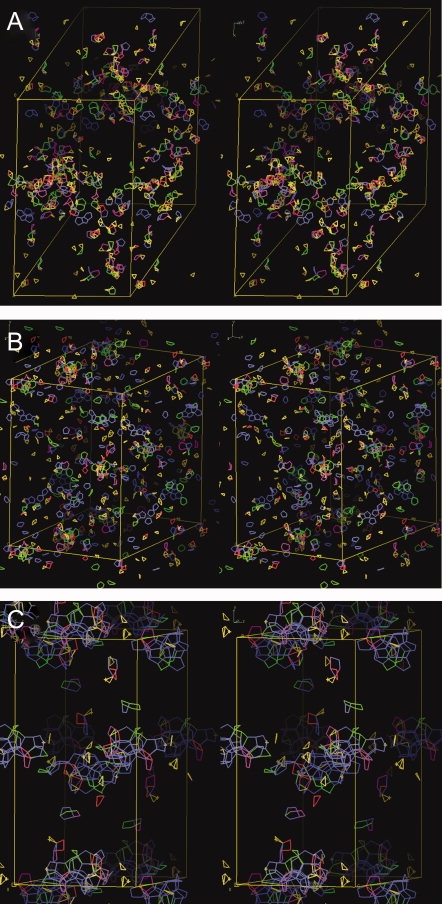
Unit cell view of modeled water polygon. Stereo view of modeled water polygons in three protein crystals with diverse water polygon distribution and with high percentage of water polygons beyond the first water layer of protein surface. Yellow box represents the unit cell boundary. Water polygons are modeled within the volume enclosed from −0.2 to 1.2 fractional coordinate for all three axes. Although trigons are most commonly occurring water polygons in protein crystals, presence of large number of pentagons are noticeable. Different polygon types are colored in different colors. Structures are from (A) PDB ID 1YBK 1.45 Å structure of RHCC, (B) PDB ID 1J0P 0.91 Å structure of cytochrome C3, and (C) PDB ID 1HXH 1.22 Å structure of hydroxysteroid dehydrogenase.
Table IV.
Statistics of Polygon Counts
| Number of polygon vertices |
|||||
|---|---|---|---|---|---|
| 3 | 4 | 5 | 6 | 7 | |
| Total count | 14,555 | 3978 | 8114 | 5793 | 1324 |
| % Total count | 43 | 12 | 24 | 17 | 3.9 |
| Average count per structure | 9.3 | 2.5 | 5.2 | 3.7 | 0.8 |
| Average % composition per structure | 45 | 14 | 23 | 15 | 2.8 |
Total count is a total number of water polygons observed in the unit cell of 1561 structures processed. The average count per structure represents the average number of each polygon observed per structure. Average % composition per structure represents the average percent composition of each polygon per structure, and the protein crystals without any polygons were excluded from the calculation. The low values reflect the fact that most protein crystals do not have water polygons beyond the first water layer. Four hundred eighty structures (31% of the dataset) have no water polygons at all beyond the first water layer, but 72 structures (4.6%) have more than 100 total polygons beyond the first water layer in a unit cell. Most abundant water polygon was trigon followed by pentagon, hexagon, tetragon, and heptagon.
Figure 2.

Sample electron densities of water polygons. Electron densities of different nonfused water polygons: (A) trigon, (B) tetragon, (C) pentagon, hexagon boat conformation (D) side view and (E) top view, hexagon chair conformation (F) side view and (G) top view, (H) heptagon, and (I) nonagon. Numbers written on the vertices represent O—O distance in Angstroms. From heptagon and greater, most of water polygons are fused and nonfused polygons shown here become rare. (A) Trigon model and electron density from PDB ID 1NWZ. (B) Tetragon model and electron density from PDB 1I5G. (C) Pentgaon model and electron density from PDB 1I5G. (D, E) Top view and side view of a boat conformation hexagon observed in PDB 1A7S. (F, G) Top view and side view of a chair conformation hexagon observed in PDB 1A7S. (H) The model and electron density of heptagon from PDB 1N8V. (I) Ring of nonfused nonagon formed as a part of bigger ISW cluster. Nonfused polygon like this is very rare. The model and electron density is from PDB 1N8V. All electron density maps are contoured in 1.3 sigma.
Discussion
The average O—O distance from all polygons was found to be 2.80 Å (Table III), which is very close to experimentally measured O—O distances of 2.82 Å in liquid water at 277 K,16 indicating that the water polygons we studied are in an environment very close to bulk water. The average O—O—O vertex angle from trigons to pentagons closely matches its planar polygon angles suggesting little nonplanarity of these polygons. However, for higher polygons like hexagons and heptagons, greater nonplanarity in angles is observed and the vertex angle maintain close to 108°, the expected angle for tetrahedrally H-bonded waters. We suggest that these localized water polygons formed by water molecules beyond the first layer may be representing the time-averaged (over the time of X-ray diffraction) and space-averaged (over the volume of the crystals exposed to X-ray) stable local structures of water molecules in liquid phase resulting from a long time trajectories of complex ultra-fast hydrogen bonding dynamics in liquid water.
As expected, pentagons and higher polygons are observed more often in larger interstitial space. The high presence of pentagons indicates that the ISW environment in protein crystals is, at least in part, compatible with that for forming the icosahedral water model.2 Nevertheless, we could not find complete dodecahedrons like in caged water nanodrop crystal structures17,18 and small molecule crystal structures, where icosahedral structure formed around a small guest molecules.5 We only observe partial clathrates around hydrophobic portion of ethanol molecules [Fig. 1(C)], which have been already reported in several crystal structures.12,19,20
Trigons and tetragons have been observed in a diverse environment of small as well as large interstitial space beyond the first water layer. Although the high count of trigons may be due to the fact that trigons are small and take the minimum number of vertices to form a trigon, the presence of these stable water polygons in bulk space, especially trigons and tetragons which should have higher density than pentagons and higher polygons, may explain the increase of water density on ice melting. One can imagine a scenario in which open, hexagonal water structure in ice collapses on melting and initiates formation of trigons and tetragons of higher density (than pentagons, hexagons, higher polygons, and partial polygons), thus increasing overall density of water just beyond melting point; As temperature rises beyond 4°C, their population as well as other polygon population are expected to decrease, thus, lowering overall density. We suggest that our observation provides an experimental basis for including these water polygon structures in correlating and predicting various water properties in liquid state.
Materials and Methods
Selection of high-resolution structures
PDB coordinate files were searched and downloaded from RCSB Protein Data Bank website.7 Initially, we downloaded the atomic coordinates of about 1700 PDB structures determined with better than 1.5 Å resolution, molecular weight greater than 5000 Da, and less than 90% similarity in sequence with each other. From those sets, about 150 small structures with no water or in a nonaqueous solvent, or those that cause error in processing were removed leaving 1561 structures to be processed.
Water polygon finder program and water polygon calculation
“Water Polygon Finder” program was developed in Microsoft Visual C# 2005 for .NET Framework 2.0 to read, calculate, and make PDB coordinate file for Coot to analyze and visualize water and water polygon structures from any PDB coordinate files. Specifically, the program parses a PDB coordinate file and then generates symmetry mates. The program calculates and assigns the first-layer waters and “bulk” waters for all water oxygen atoms using the user defined distance from the protein surface, then looks for water to water connection using the user defined cutoff distance. The program then processes through all possible connections to find all possible water polygons. To prevent over counting, polygons with the same vertex water atoms are counted only once. Higher polygons formed by fusion of smaller polygons were removed by excluding all polygons that contain a complete set of vertices from smaller water polygons. The number of water polygons in a unit cell is quantitated by counting the number of waters forming a particular polygon in a fractional coordinate from 0 to 1 and then dividing that number by the number of polygon vertices.
Delocalized (disordered) ISWs
Delocalized water volume is calculated by subtracting the protein volume and localized ISWs from the unit cell volume. Protein volume is estimated from the sequence using residue volumes.21 Total protein volume in a unit cell is calculated by multiplying protein volume with the number of asymmetric units in a unit cell. The volume of localized ISWs is estimated by assuming that a single water molecule occupies 11.5 Å3, which corresponds to the volume of a fixed 1.4 Å sphere as in calculation of solvent excluded volume of a protein.22 Then, the number of delocalized ISWs is determined by dividing delocalized water volume by 11.5 Å3.
First-layer waters
For water pairs and polygons, 3.2 Å maximum and 2.4 Å minimum distant cutoff was used in defining a hydrogen bond. With this criterion, the average distance between water oxygen to oxygen is 2.77 Å with a standard deviation of 0.21 Å. In this study, we used a relaxed definition of the first-layer waters: the first-layer waters were assigned to waters with a distance less than 3.4 Å to the closest H-bonding capable protein atoms (N, O, and S), which corresponds to three standard deviations from the average O—O distance of 2.77 Å. Symmetry atoms were generated from fractional coordinate within −0.2 to 1.2 in all axes to accommodate water polygons lying between the unit cells.
Acknowledgments
The authors thank Drs. Jose Henrique Pereira, Gregory Sims, Sung-Chul Ha, and Kyeung Kyu Kim for their helpful critiques throughout this project. They also thank Dr. Rosalind Kim for proofreading the manuscript. “Water Polygon Finder” program and its output analysis software are licensed by GNU Public License (GPL) and are freely available for download and use without any restrictions from http://sourceforge.net/projects/pdbwaterpolygon/.
References
- 1.Boutron P, Alben R. Structural model for amorphous solid water. J Chem Phys. 1975;62:4848–4853. [Google Scholar]
- 2.Chaplin MF. A proposal for the structuring of water. Biophys Chem. 2000;83:211–221. doi: 10.1016/s0301-4622(99)00142-8. [DOI] [PubMed] [Google Scholar]
- 3.Liu K, Cruzan JD, Saykally RJ. Water clusters. Science. 1996;271:929–933. doi: 10.1126/science.271.5245.59. [DOI] [PubMed] [Google Scholar]
- 4.Xantheas SS. Cooperativity and hydrogen bonding network in water clusters. Chem Phys. 2000;258:225–231. [Google Scholar]
- 5.Udachin KA, Ripmeester JA. A complex clathrate hydrate structure showing bimodal guest hydration. Nature. 1999;397:420–423. doi: 10.1038/17097. [DOI] [PubMed] [Google Scholar]
- 6.Teeter MM. Water-structure of a hydrophobic protein at atomic resolution—pentagon rings of water-molecules in crystals of crambin. Proc Natl Acad Sci USA. 1984;81:6014–6018. doi: 10.1073/pnas.81.19.6014. [DOI] [PMC free article] [PubMed] [Google Scholar]
- 7.Berman H, Henrick K, Nakamura H, Markley JL. The worldwide Protein Data Bank (wwPDB): ensuring a single, uniform archive of PDB data. Nucleic Acids Res. 2007;35:D301–D303. doi: 10.1093/nar/gkl971. [DOI] [PMC free article] [PubMed] [Google Scholar]
- 8.Chatake T, Ostermann A, Kurihara K, Parak FG, Niimura N. Hydration in proteins observed by high-resolution neutron crystallography. Proteins Struct Funct Genet. 2003;50:516–523. doi: 10.1002/prot.10303. [DOI] [PubMed] [Google Scholar]
- 9.Kubinec MG, Wemmer DE. NMR evidence for DNA bound water in solution. J Am Chem Soc. 1992;114:8739–8740. [Google Scholar]
- 10.Henchman RH, McCammon JA. Structural and dynamic properties of water around acetylcholinesterase. Protein Sci. 2002;11:2080–2090. doi: 10.1110/ps.0214002. [DOI] [PMC free article] [PubMed] [Google Scholar]
- 11.Badger J, Caspar DLD. Water-structure in cubic insulin crystals. Proc Natl Acad Sci USA. 1991;88:622–626. doi: 10.1073/pnas.88.2.622. [DOI] [PMC free article] [PubMed] [Google Scholar]
- 12.Nakasako M. Water-protein interactions from high-resolution protein crystallography. Philos Trans R Soc Lond B. 2004;359:1191–1204. doi: 10.1098/rstb.2004.1498. [DOI] [PMC free article] [PubMed] [Google Scholar]
- 13.Thanki N, Thornton JM, Goodfellow JM. Distributions of water around amino-acid residues in proteins. J Mol Biol. 1988;202:637–657. doi: 10.1016/0022-2836(88)90292-6. [DOI] [PubMed] [Google Scholar]
- 14.Billeter M. Hydration water molecules seen by NMR and by X-ray crystallography. Prog Nucl Magn Reson Spectrosc. 1995;27:635–645. [Google Scholar]
- 15.Dunitz JD. The entropic cost of bound water in crystals and biomolecules. Science. 1994;264:670. doi: 10.1126/science.264.5159.670. [DOI] [PubMed] [Google Scholar]
- 16.Narten AH, Danford MD, Levy HA. X-ray diffraction study of liquid water in temperature range 4–200°C. Discuss Faraday Soc. 1967:97–101. [Google Scholar]
- 17.Henry M, Bogge H, Diemann E, Muller A. Chameleon water: assemblies confined in nanocapsules. J Mol Liq. 2005;118:155–162. [Google Scholar]
- 18.Muller AA, Bogge H, Diemann E. Structure of a cavity-encapsulated nanodrop of water. Inorg Chem Commun. 2003;6:52–53. [Google Scholar]
- 19.Nakasako M. Large-scale networks of hydration water molecules around bovine beta-trypsin revealed by cryogenic X-ray crystal structure analysis. J Mol Biol. 1999;289:547–564. doi: 10.1006/jmbi.1999.2795. [DOI] [PubMed] [Google Scholar]
- 20.Nakasako M. Structural characteristics in protein hydration investigated by cryogenic X-ray crystal structure analyses. J Biol Phys. 2002;28:129–137. doi: 10.1023/A:1019982220615. [DOI] [PMC free article] [PubMed] [Google Scholar]
- 21.Zamyatnin AA. Amino-acid, peptide, and protein volume in solution. Annu Rev Biophys Bioeng. 1984;13:145–165. doi: 10.1146/annurev.bb.13.060184.001045. [DOI] [PubMed] [Google Scholar]
- 22.Connolly ML. Computation of molecular volume. J Am Chem Soc. 1985;107:1118–1124. [Google Scholar]