

Abstract
Metabolic fluxes can serve as specific biomarkers for detecting malignant transformations, tumor progression, and response to microenvironmental changes and treatment procedures. We present noninvasive hyperpolarized 13C NMR investigations on the metabolic flux of pyruvate to lactate, in a well-controlled injection/perfusion system using T47D human breast cancer cells. Initial rates of pyruvate-to-lactate conversion were obtained by fitting the hyperpolarized 13C and ancillary 31P NMR data to a model, yielding both kinetic parameters and mechanistic insight into this conversion. Transport was found to be the rate-limiting process for the conversion of extracellular pyruvate to lactate with Km = 2.14 ± 0.03 mM, typical of the monocarboxylate transporter 1 (MCT1), and a Vmax = 27.6 ± 1.1 fmol·min−1·cell−1, in agreement with the high expression level of this transporter. Modulation of the environment to hypoxic conditions as well as suppression of cells' perfusion enhanced the rate of pyruvate-to-lactate conversion, presumably by up-regulation of the MCT1. Conversely, the addition of quercetin, a flavonoidal MCT1 inhibitor, markedly reduces the apparent rate of pyruvate-to-lactate conversion. These results suggest that hyperpolarized 13C1-pyruvate may be a useful magnetic resonance biomarker of MCT regulation and malignant transformations in breast cancer.
Keywords: hyperpolarized NMR, metabolic fluxes, monocarboxylate transporters, pyruvate/lactate conversion, breast cancer metabolism
Imaging is an integral component in the detection and treatment of cancer. Continuous efforts are being invested to develop imaging techniques with the aim of earlier detection as well as for an improved ability to distinguish between malignant and benign growths and to rapidly assess the response of cancer to therapeutic treatments. Anatomical imaging techniques are limited by the inherent contrast between normal and tumor tissue. Therefore, emphasis has been shifted to the development of biomarkers of metabolic processes for functional and molecular imaging, in which contrast between normal and cancerous tissues arises because of their different metabolic properties. The strong homeostasis of living cells makes metabolic fluxes, rather than actual changes in metabolic concentrations, promising biomarkers for detecting malignant transformations—including tumor progressions and their response to therapy. One such process is the elevated rate of anaerobic glycolysis in cancers (1). This phenomenon has been demonstrated in numerous studies, both in vitro and in vivo, and it is used clinically to identify the location of tumors via positron emission tomography (2). Although the origin and mechanism of the enhanced glycolysis in cancers is still being debated (3–5), evidence exists that it reflects the up-regulation of glucose transporters in human malignancies, enhancing glucose influx into the proliferating cancer cells (6).
It has been recently shown that NMR of hyperpolarized precursors, has the potential to become a suitable modality for monitoring metabolism and for measuring changes in metabolic fluxes (7–21). In these studies, stable 13C-labeled metabolites are hyperpolarized and used without changing their functional properties. 13C chemical shifts can be exploited to distinguish between the original molecules and their metabolic products, whereas gradient-based techniques can localize the spatial source of these spectral signatures. Several spectroscopic imaging 13C NMR techniques have thus been proven capable of monitoring cancer metabolism of hyperpolarized pyruvate as an in vivo biomarker, and demonstrated its use for detecting and monitoring response to treatment (8–13, 16, 19–21).
To obtain a thorough understanding of the cellular processes underlying these pyruvate metabolism results, it is important to develop an in vitro cell system in which conditions can be carefully controlled and manipulated. Thus far, a number of studies have monitored the metabolism of hyperpolarized molecules in concentrated cell suspensions in vitro (13, 14); however, such settings could experience unstable, stressed physiological conditions that are likely to modify cellular metabolism. This article discusses hyperpolarized NMR results on human breast cancer cells, that were cultivated on beads and maintained by continuous perfusion under controlled physiological conditions. This enabled a reliable characterization of the kinetics and mechanism of hyperpolarized pyruvate-to-lactate conversions. Initial rates of conversion could be determined noninvasively in this manner by fitting the hyperpolarized 13C and ancillary 31P NMR data to a model that accounted for the transformation of pyruvate into lactate. Concentration-dependent studies of data extracted from the continuously perfused cells yielded a reliable determination of the Michaelis–Menten characteristics of this process, with Km and Vmax values that are typical of pyruvate transport by MCT1. This is one of the main members in the monocarboxylate transporters (MCTs) family that introduces pyruvate into the glycolytic pathway (22, 23), and points toward pyruvate's transport as the rate-limiting step of these in-cell 13C NMR measurements. It is further shown that, as in glycolysis, changes in the environmental conditions such as competitive MCT binding, hypoxia, and suppression of cells' perfusion, modulate these hyperpolarized NMR results. These results suggest that the kinetics of 13C-pyruvate's conversion to lactate, may serve as a biomarker for the up-regulation of MCTs in malignant breast transformations.
Materials and Methods
Cell Cultures.
T47D (clone 11) human breast cancer cells were cultured in RPMI medium1640 supplemented with 10% FCS (Biological Industries), 5 mL of l-glutamine, 0.4 mL of insulin, and 0.1% combined antibiotics (Bio-Lab). For the NMR perfusion studies, cells (>3 × 10⁶) were seeded on 0.5 mL of Biosilon polystyrene beads (160–300 μm, Nunc) in silanized glass vials. Three hours later they were transferred to bacteriological dishes for cultivation, changing medium every second day, as well as on the day before the experiment. After 5–7 days of culture, cells on beads were transferred into a 10-mm NMR test tube and connected to a continuously perfused system circulating the standard medium described above, for the duration of the NMR experiments.
Hyperpolarization.
A solution of 1 M sodium 13C1-pyruvate (Cambridge Isotopes) and 15 mM OX063 stable Trityl radical (GE Healthcare) was prepared, by using an equal-volume D2O:d6-DMSO glass-forming mixture. An aliquot of this sample was inserted into the Hypersense main 3.35-T low-temperature magnet and irradiated at 94.1 GHz at 1.5 K for executing dynamic nuclear hyperpolarization (DNP) of the 13C. After ≈90 min of microwave irradiation, the sample was dissolved in 4 mL of phosphate buffer solution containing 1 mg of EDTA; this solution was heated to 180 °C, pressurized to 10 bar, and flushed into the perfusion–injection system within 2–3 sec.
Perfusion–Injection System.
An inlet for injecting hyperpolarized solutions was added to a cell perfusion system developed in our laboratory (24). A schematic of this injection/perfusion system is shown in Fig. 1A. The culture temperature inside the NMR tube containing the cells-on-beads was maintained at 36 ± 1 °C. The hyperpolarized sample was ejected from the hypersense at ≈39 °C, gathered into a syringe, and then manually injected into the cells (Fig. 1A). The perfusion system was stopped for this injection and for the 13C scanning; and only at the latter's conclusion, after 2–4 min of data acquisition, perfusion was restarted. Following the injection, the DNP inlet line was washed with PBS, and the DNP-derived solution was removed via system recirculation. Under standard conditions, 95% O2 plus 5% CO2 was used as gas mixture for supporting this bioreactor; hypoxia was induced by replacing oxygen with nitrogen. In the transport inhibition experiments, the perfusion medium was supplemented with the MCT1 inhibitor quercetin (Molekula) at the specified concentrations: The NMR bioreactor tube was perfused with quercetin-containing medium for 8 min before the injection of the hyperpolarized solution; after this injection and 2–4 min of data acquisition, perfusion was restarted with the standard medium free of the inhibitor.
Fig. 1.

Scheme of the perfusion system (A) used for the present in-cell study of hyperpolarized precursors, and typical results (B and C) obtained upon monitoring the fate of hyperpolarized 13C1-pyruvate converting into lactate in T47D cells. Highlighted in A are the main inputs/outputs associated with the continuously perfused 10-mm NMR tube. (B) An array of experimental spectra collected 2 sec apart. (C) The red curves show the kinetic best fit of the experimental 13C NMR spectral intensities to Eqs. 3 and 4, leading to the indicated parameters.
NMR Experiments.
NMR spectra were recorded on an 11.7-T Varian spectrometer using a 10-mm broadband probe. 31P spectra were recorded at 202 MHz throughout the experiments to monitor cell viability. 13C spectra were recorded at 125 MHz after injection of the hyperpolarized pyruvate solution by using a broadband, small flip angle (8–20°) pulse, and a repetition time of 1–3 sec.
Data Analysis.
The hyperpolarized 13C1-pyruvate-to-13C1-lactate conversion in breast cancer cells yielded a spectral sequence like the one demonstrated in Fig. 1B. Analysis of such spectra showed a monotonic decay of the hyperpolarized pyruvate signal, predominantly due to T1 decay, paralleled by an increase in the hyperpolarized lactate signal. This reached a maximum ≈10–20 sec after injection and then decayed, once again, primarily due to loss of polarization.
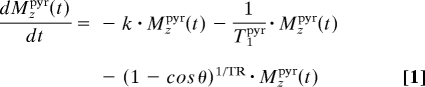
The 13C1-pyruvate and 13C1-lactate signal intensity changes arising from this kind of spectra were fitted to a kinetic model by using custom-written Matlab and Origin routines. These changes were modeled on the basis of the classical Bloch–McConnell differential equations (25), assuming that the conversion of pyruvate to lactate had a rate constant k. No statistical improvement in the data fit resulted under our experimental conditions from considering the back conversion process, and the klac-to-pyr rate constant was thus disregarded. Changes in pyruvate and lactate signal intensities were thus modeled on the basis of their respective z-magnetizations Mzpyr, Mzlac, according to:
 |
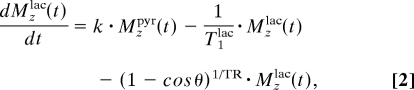 |
where the T1s denote the respective relaxation times of the carbonyl sites, θ is the excitation pulse angle, and TR is the repetition delay. Solving these coupled differential equations with initial conditions Mzlac(t = 0) = 0 and Mzpyr(t = 0) = [Pyr]0 yields the solutions:
where ρpyr/lac = + (1 − cos θ)1/TR is an effective longitudinal decay, and Δρ = . Typical fittings of the pyruvate's and lactate's 13C1 time dependencies are illustrated in Fig. 1C. These fits yielded a nonnormalized conversion rate k, as well as the longitudinal relaxation rates of pyruvate and lactate in our system. For furthering the accuracy of these fits, these measurements were also repeated by using a variety of different pulsing (i.e., θ, TR) conditions. These best fits yielded a T1pyr that, on average, was consistently approximately twice as long as the value arising from T1lac. This, in turn, was significantly shorter than the T1 ≈ 40 sec measured for a 13C1-lactate solution in pure buffer; the significance of this difference is further discussed below.
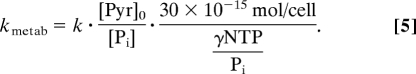
To quantify the biochemical meaning of these hyperpolarized 13C observations, metabolic rate constants had to be normalized according to the number of cells, which varied between experiments. This was done by exploiting the fact that the total nucleoside triphosphate (NTP) content under perfused physiological conditions is proportional to cell number (26): NTP in perfused T47D cells is known to be 30 fmol per cell (27). NTP content was, in turn, determined by taking the ratio between the integrated 31P NMR signal intensities displayed by the NTP and by the inorganic phosphate of known concentration in the medium, [Pi], while accounting for the individual T1 relaxation times of these sites. With this information, the actual metabolic rate per cell could be calculated by combining the 13C hyperpolarized and 31P NMR data, according to:
 |
Results
Reproducibility and Quantitative Consistency.
The importance of a constantly perfused bioreactor lies in the system's ability to (i) yield highly reproducible results even when measurements are separated by long time delays, and (ii) yield rates that are consistent with one another at a quantitative level, even when measured on independent cell batches. The excellent agreement obtained between independent measurements is illustrated in Fig. 2A. This high level of hyperpolarized NMR reproducibility vs. time is possible only because cells are being continually perfused, as evidenced by the constant viability demonstrated by sequential 31P NMR spectra recorded in between injections (Fig. 2B). By contrast, when the perfusion system was turned off, and cells had limited supplies of nutrients and oxygen, the 31P spectra showed the onset of acidosis, a decline in the total NTP content, and a concomitant increase in the rate of lactate synthesis by ≈2-fold (Fig. S1). Because of the high degree of reproducibility as well as our ability to quantify the absolute number of cells in different batches by using the NTP/Pi-integrated 31P signal intensity ratio, it was possible to compare metabolism as a function of normalized cell number (Fig. 2C). This proved an important ingredient for elucidating the kinetics—and thereafter the biochemistry—underlying the changes observed in the hyperpolarized 13C measurements.
Fig. 2.

Advantages associated with the stability of the cell perfusion system. (A) Reproducibility of the pyruvate-to-lactate conversion process in perfused cells, as illustrated by the lactate's normalized signal intensity observed in two 4.8 mM 13C1-pyruvate injections 15 h apart. (B) Independent evidence of the system's stability, as revealed by 31P NMR spectra recorded on perfused T47D human breast cancer cells at various times between the injections of the hyperpolarized pyruvate. PME-phosphomonoesters, PCho-phosphocholine, PCr-phosphcreatine, NTP-nucleoside-triphosphate, UDPS-uridine diphosphosugar. (C) DNP-derived rate parameter k values vs. the γNTP/Pi ratio, for injections of a 9.75 mM hyperpolarized pyruvate solution on eight different batches of T47D cells.
Kinetic Parameters and Mechanism of the 13C1-Pyruvate-to-13C1-Lactate Conversion.
A kinetic analysis on the initial rates exhibited by the hyperpolarized 13C1-pyruvate-to-13C1-lactate conversion was done, as a function of the initial pyruvate concentration [Pyr]0 (Fig. 3A). Analysis of these data, normalized by the number of cells, yielded a Michaelis–Menten-like kinetics from which parameters for the apparent pyruvate-to-lactate conversion process emerged: Km = 2.14 ± 0.03 mM and Vmax = 27.6 ± 1.1 fmol·min−1·cell−1 (Fig. 3B). Based on the amount of protein measured per cell for T47D, 120 pg per cell, the latter number can also be expressed as Vmax = 0.23 ± 0.01 mmol·min−1·g−1. These numbers shed light on the origin of the observed spectral transformations. Indeed, the pyruvate-to-lactate metabolism in the present setup involves two steps: first, the transport of pyruvate from the extracellular medium into the intracellular compartment; second, the intracellular enzymatic conversion of pyruvate to lactate by lactate dehydrogenase (LDH). The activity of LDH and the direction of the pyruvate ↔ lactate reaction depend on the concentration ratios of NAD/NADH and pyruvate/lactate; but in general, under the cell conditions assayed in this study, the Km for the pyruvate conversion is expected to be approximately an order of magnitude lower than the values hereby measured. In effect, a Km ≈ 0.2 mM has been reported for the pyruvate-to-lactate conversion (28); Vmax depends on the specific cell type, but typically orders of magnitude higher values than what revealed by Fig. 3, have been observed for pyruvate's conversion in different cell types (29). These results, therefore, indicate that the process determining the effective rate of the hyperpolarized 13C pyruvate-to-lactate transformation is not related to this enzymatic conversion; we therefore hypothesize that this flux reflects pyruvate's transport rate into the cytoplasm. In this case, the observed rate should be chiefly determined by the kinetic parameters of MCTs, the transporters that facilitate pyruvate's migration from the extracellular space.
Fig. 3.

Normalized rates of pyruvate-to-lactate conversion, as revealed by hyperpolarized 13C NMR studies in T47D cells. (A) Lactate signal intensities observed after injection of various concentrations of hyperpolarized pyruvate to T47D human breast cancer cells. These intensities were normalized by the maximum intensity of their respective pyruvate signals, and divided by the assayed [Pyr]0 concentration for a meaningful visual comparison. Continuous red lines show the best fit to each dataset, leading to the indicated ks. (B) Plot of the rate per cell values vs. pyruvate concentration injected to the medium, showing in red the results of fitting this behavior to a Michaelis–Menten equation (R2 = 0.939).
Fourteen members of the MCTs have so far been cloned, including MCT1, the most widely expressed member of this family (22). MCT1 has been shown to be elevated in a variety of cancers including in MCF7 and MDA-MB-231 human breast cancer cells (30); as shown in Fig. S2, this is also the case for T47D cells. MCT1's Km for pyruvate transport was previously determined to be in the 1- to 4-mM range (22, 23). This is in full coincidence with the Km of 2.14 mM arising from Fig. 3, and suggests that the kinetics observed for the conversion of hyperpolarized 13C1-pyruvate to lactate in perfused T47D breast cancer cells, has a MCT1-mediated pyruvate transport as rate-limiting step. To further explore this hypothesis, we carried out the two series of complementary tests illustrated in Fig. 4. The first set (Fig. 4 Upper) shows the effects arising upon adding quercetin, a well-known MCT1 inhibitor (31, 32), on the rate of pyruvate-to-lactate conversion. Hyperpolarized NMR confirmed a dose-dependent inhibition by quercitin of the pyruvate-to-lactate conversion (Fig. 4A), that was not associated to any apparent effect in cell viability as reflected by the corresponding 31P NMR profiles (Fig. 4B Inset). This provides a first set of hints indicating that, indeed, it is the MCT1-mediated transport of pyruvate that is acting as rate limiting step in the synthesis of lactate in this cell system.
Fig. 4.

Unraveling the rate-limiting step of the pyruvate-to-lactate conversion monitored by NMR studies in T47D cells. (A) Effects observed upon adding quercetin, a naturally occurring inhibitor of pyruvate's transport into cells, on the kinetics of lactate's build-up. These measurements involved injecting repeated aliquots of 5.9 mM hyperpolarized 13C1-pyruvate into batches of T47D cells, to whose perfusing media the indicated concentrations of inhibitor were coadded 8 min before the NMR acquisitions. Red lines indicate the build-up best fits, leading to the indicated k values. (B) 31P NMR spectra showing the constant viability displayed by cells throughout these experiments, despite the marked changes experienced by the pyruvate-to-lactate transformation rates. (C) Washout experiments illustrating the time dependencies of the pyruvate and lactate 13C1 NMR peak intensities, upon suddenly removing the extracellular medium. Shown by the various continuous curves are expectations from a pyruvate-to-lactate conversion whose rate remains unaffected by the washing out (kwash = k0, gray Upper and red Lower); a conversion whose rate is halved vis-à-vis its original level (kwash = k0/2, green Lower); or a conversion whose rate goes suddenly to zero upon restarting the perfusion (kwash = 0, blue Lower). The latter's curves best data fit suggests that a sudden disappearance of the pyruvate leads to a full stop of the pyruvate-to-lactate conversion, and to an ensuing purely longitudinal decay of the latter's hyperpolarization.
A second series of tests, focused on observing the effects of washing out the hyperpolarized medium during the course of the biosynthetic reaction. In these experiments (Fig. 4C), the typical hyperpolarized 13C NMR measurement protocol was started, but a vigorous perfusion of the bioreactor (at a 6.8-mL/min rate) was introduced a short interval (20–30 sec) after the hyperpolarized 13C1-pyruvate's sudden injection. At these vigorous flow rates, a complete turnover of the NMR-active external cell volume occurred within ≤10 sec of restarting the perfusion. This resulted in a very rapid washout of the pyruvate from the medium, as reflected by the rapid decrease in the hyperpolarized 13C1-pyruvate NMR signal. By contrast, the lactate signal showed no sharp changes upon washing out the external medium. In fact, the NMR indicates that the biosynthesized lactate was maintained in the cells throughout the kinetic measurements (≥1 min), and its signal decreased solely due to lactate's natural T1 longitudinal decay. These results provide additional support to the hypothesis that transport into the cells is the rate-determining step. Indeed, if an intracellular LDH-driven pyruvate-to-lactate conversion would be the rate-determining step, then washing out the extracellular pyruvate should not significantly alter the apparent rate of lactate synthesis—not, at least, for the first 10–20 sec after the removal of the extracellular pyruvate supply and while the inner pyruvate pool becomes depleted. Such behavior is not supported by the best fits of these measurements.
Pyruvate Metabolism Under Modulated Conditions: Hypoxia.
A perfusion system like the one used in this work, is well suited for investigating the effects of systematic environmental changes—such as nutrition or administered chemicals—on the tumor cells' metabolism. A particularly amenable observable is hypoxia, because the flow of gases into the cells can be easily controlled. An increase in anaerobic glycolysis found in many tumors is normally attributed to the malignant transformation (3, 4). However, it is possible that the typically hypoxic microenvironment of a tumor further contributes to this elevation. To investigate the effect of oxygen deprivation, the rate of lactate synthesis under hypoxic conditions was monitored over a 20-h period by hyperpolarized NMR. Hypoxia induced an increase in the rate of lactate synthesis as early as 4 h after its initiation, an increase that was maintained throughout the entire experiment (Fig. 5). Notably, 31P NMR spectra recorded sequentially in between the hyperpolarized 13C rate studies, indicated that the cells number, as revealed by the NTP/Pi ratio, remained constant under hypoxia.
Fig. 5.

Hypoxia-induced changes in the pyruvate-to-lactate conversion and in the phosphate profile of T47D cells. (A) Normalized 13C1-lactate signal after injection of 9.75 mM hyperpolarized pyruvate under standard and hypoxic conditions. (B) 31P NMR spectra showing stable NTP but a slightly increased P cho behavior (arrow). (C) Changes in the NMR-derived kmetab rates as a function of hypoxia time.
Discussion
This work explored the ability of hyperpolarized 13C NMR to accurately measure metabolic rates in continuously perfused cells, and to extract from these rates biochemical insight about the observed metabolic process. An important aspect of these measurements was their focus on cells that were kept alive and under stable metabolic conditions for long periods of time. This achieved highly reproducible, repetitive experiments, and allowed us to pool together measurements carried out on different cell batches. A series of concentration-dependent measurements led to a reliable measurement of the Michaelis–Menten enzymatic parameters. In addition, the system's stable operation for extended periods of time permitted monitoring slow changes, such as those occurring during hypoxia (Fig. 5). Another important component in these quantitative analyses was the ability to normalize the 13C-derived data with respect to the number of cells, through concomitant 31P measurements. Although requiring ≈20 min to be collected, these spectra provided a measure of cell number, by the NTP concentration, as well as a constant monitor of the energy status of the cell batches.
The signal intensity behavior observed for hyperpolarized pyruvate and lactate was fitted to a kinetic model that did not assume a priori identical T1 relaxation times for these metabolites. Indeed, fits of the kinetic data repeatedly suggested relatively large differences between the T1s of the lactate (≈19 sec) and pyruvate (≈45 sec). This result is at variance with what can be measured under aqueous in vitro solutions. On the other hand, it is consistent with the washout observations (Fig. 4) that indicate that pyruvate is predominantly localized in the free medium and therefore exhibits a longer, aqueous-like T1, whereas hyperpolarized lactate is mainly localized in the more viscous and restricted environment of the intracellular compartments. A similar reduction in T1 has been reported for 13C-enriched glycine in muscle tissue as compared with free solution (33).
Our results indicate that the rate of metabolism of hyperpolarized pyruvate does not reflect the activity of LDH, but rather the activity of MCT transporters. These results highlight the putative role played by MCT transporters in pyruvate-based molecular imaging. Elevated expressions of MCTs in cancers are associated with their high levels of glycolysis and, hence, with a need to transport lactate out of the cells. Moreover, it has been established that pyruvate has a higher affinity to MCT1 than lactate (22, 23). T47D cells were shown to be highly glycolytic, converting glucose to lactate at very high rates (27, 34). It was further shown that transport is the rate limiting step in this conversion, with a glucose transport Km of 2.6 mM and a Vmax of 12.5 fmol·min−1·cell−1, associated predominantly with the up-regulation of the GLUT1 glucose transporter. Pyruvate transport in these cells was determined to have a very similar Km and a Vmax that is approximately twice as high. These kinetic measurements, as well as Western blot analyses of MCT1 in human breast cancer cells (Fig. S2), suggest high expression levels of MCT1. Hypoxic conditions also induced an increase in the rate of pyruvate-to-lactate conversion, in analogy to the GLUT1 changes induced by hypoxia in human breast cancer cells (6). This suggests the occurence of a hypoxia-induced expressions of MCT1—even if it is too early to conclude that concurrent changes in the up-regulation of LDH are not occurring as well. Further molecular studies on MCTs' expression in breast cancer and their up-regulation by hypoxia are currently underway to validate these hypotheses.
In summary, we have shown that a system for the continuous perfusion of cells provides a unique complement to the application of hyperpolarized 13C NMR in the metabolic characterization of cancer cells. The setup can be used to quantify the kinetics of metabolic processes noninvasively, as well as to investigate the changes in metabolic rates induced by varying the conditions in the extracellular environment. From this study, it appears that, for T47D cells, transport is the rate-limiting process in the conversion of extracellular pyruvate to lactate. This transport appears to be dominated by MCT1 and is induced by hypoxia, providing the cells a survival advantage under stress conditions.
Supplementary Material
Acknowledgments.
We thank Ms. Tamar Kreizman and Mr. Matan Saranga for help with the biochemical studies. This work was supported by Israel Science Foundation Grants ISF 447/09 (to L.F.) and ISF 235/08 (to H.D.) and by National Institutes of Health Grant CA 422238 (to H.D.), and was made possible by the generosity of the Perlman Family Foundation. H.D. is the incumbent of the Fred and Andrea Fallek Professorial Chair for Breast Cancer Research.
Footnotes
The authors declare no conflict of interest.
This article contains supporting information online at www.pnas.org/cgi/content/full/0909049106/DCSupplemental.
References
- 1.Warburg O, Posener K, Negelein E. Über den Stoffwechsel der Tumoren (The Metabolism of Tumor Cells) Biochem Zeitschr. 1924;152:129–169. [Google Scholar]
- 2.Ak I, Stokkel MP, Pauwels EK. Positron emission tomography with 2-[18F]-fluoro-2-deoxy-D-glucose in oncology, Part II. The clinical value in detecting and staging primary tumors. J Cancer Res Clin Oncol. 2000;126:560–574. doi: 10.1007/PL00008466. [DOI] [PMC free article] [PubMed] [Google Scholar]
- 3.Chen Z, Lu W, Garcia-Prieto C, Huang P. The Warburg effect and its cancer therapeutic implications. J Bionenerg Biomembr. 2007;39:267–274. doi: 10.1007/s10863-007-9086-x. [DOI] [PubMed] [Google Scholar]
- 4.Kim JW, Dang CV. Cancer's molecular sweet tooth and the Warburg effect. Cancer Res. 2006;66:8927–8930. doi: 10.1158/0008-5472.CAN-06-1501. [DOI] [PubMed] [Google Scholar]
- 5.Moreno-Sánchez R, Rodríguez-Enríquez S, Marín-Hernández A, Saavedra E. Energy metabolism in tumor cells. FEBS J. 2007;274:1393–1418. doi: 10.1111/j.1742-4658.2007.05686.x. [DOI] [PubMed] [Google Scholar]
- 6.Macheda MI, Rogers S, Best JD. Molecular and cellular regulation of glucose transporter (GLUT) proteins in cancer. J Cell Physiol. 2005;202:6546–6562. doi: 10.1002/jcp.20166. [DOI] [PubMed] [Google Scholar]
- 7.Golman K, et al. Molecular imaging using hyperpolarized 13C. Br J Radiol. 2003:S118–S127. doi: 10.1259/bjr/26631666. 76 Spec No 2. [DOI] [PubMed] [Google Scholar]
- 8.Golman K, Zandt R, Lerche M, Pehrson R, Ardenkjaer-Larsen JH. Metabolic imaging by hyperpolarized 13C magnetic resonance imaging for in vivo tumor diagnosis. Cancer Res. 2006;66:10855–10860. doi: 10.1158/0008-5472.CAN-06-2564. [DOI] [PubMed] [Google Scholar]
- 9.Mansson S, et al. 13C imaging: A new diagnostic platform. Eur Radiol. 2006;16:57–67. doi: 10.1007/s00330-005-2806-x. [DOI] [PubMed] [Google Scholar]
- 10.Mayer D, Levin YS, Hurd RE, Glover GH, Spielman DM. Fast metabolic imaging of systems with sparse spectra: Application for prepolarized 13C imaging. Magn Reson Med. 2006;56:932–937. doi: 10.1002/mrm.21025. [DOI] [PubMed] [Google Scholar]
- 11.Merritt ME, et al. Hyperpolarized 13C allows a direct measure of flux through a single enzyme-catalyzed step by NMR. Proc Natl Acad Sci USA. 2007;104:19773–19777. doi: 10.1073/pnas.0706235104. [DOI] [PMC free article] [PubMed] [Google Scholar]
- 12.Chen AP, et al. Hyperpolarized C-13 spectroscopic imaging of the TRAMP mouse at 3T-initial experience. Magn Reson Med. 2007;58:1099–1106. doi: 10.1002/mrm.21256. [DOI] [PubMed] [Google Scholar]
- 13.Day SE, et al. Detecting tumor response to treatment using hyperpolarized 13C magnetic resonance imaging and spectroscopy. Nat Med. 2007;13:1382–1387. doi: 10.1038/nm1650. [DOI] [PubMed] [Google Scholar]
- 14.Gallagher FA, Kettunen MI, Day SE, Lerche M, Brindle KM. 13C MR spectroscopy measurements of glutaminase activity in human hepatocellular carcinoma cells using hyperpolarized 13C-labeled glutamine. Magn Reson Med. 2008;60:253–257. doi: 10.1002/mrm.21650. [DOI] [PubMed] [Google Scholar]
- 15.Nelson SJ, Kurhanewicz J, Chen A, Bok R, Hurd R. DNP-hyperpolarized 13C magnetic resonance metabolic imaging for cancer applications. Appl Magn Reson. 2008;34:533–544. doi: 10.1007/s00723-008-0136-2. [DOI] [PMC free article] [PubMed] [Google Scholar]
- 16.Albers MJ, et al. Hyperpolarized 13C lactate, pyruvate, and alanine: Noninvasive biomarkers for prostate cancer detection and grading. Cancer Res. 2008;68:8607–8615. doi: 10.1158/0008-5472.CAN-08-0749. [DOI] [PMC free article] [PubMed] [Google Scholar]
- 17.Gallagher FA, et al. Magnetic resonance imaging of pH in vivo using hyperpolarized 13C-labelled bicarbonate. Nature. 2008;453:940–943. doi: 10.1038/nature07017. [DOI] [PubMed] [Google Scholar]
- 18.Schroeder MA, et al. In vivo assessment of pyruvate dehydrogenase flux in the heart using hyperpolarized carbon-13 magnetic resonance. Proc Natl Acad Sci USA. 2008;105:12051–12056. doi: 10.1073/pnas.0805953105. [DOI] [PMC free article] [PubMed] [Google Scholar]
- 19.Schroeder MA, et al. Real-time assessment of Krebs cycle metabolism using hyperpolarized 13C magnetic resonance spectroscopy. FASEB J. 2009;23:2529–2538. doi: 10.1096/fj.09-129171. [DOI] [PMC free article] [PubMed] [Google Scholar]
- 20.Schroeder MA, et al. The effect of hyperpolarized tracer concentration on myocardial uptake and metabolism. Magn Reson Med. 2009;61:1007–1014. doi: 10.1002/mrm.21934. [DOI] [PubMed] [Google Scholar]
- 21.Kohler SJ, et al. In vivo carbon-13 metabolic imaging at 3T with hyperpolarized 13C-1-pyruvate. Magn Reson Med. 2007;58:65–69. doi: 10.1002/mrm.21253. [DOI] [PubMed] [Google Scholar]
- 22.Morris ME, Felmlee MA. Overview of the proton-coupled MCT (SLC16A) family of transporters: Characterization, function and role in the transport of the drug of abuse gamma-hydroxybutyric acid. AAPS J. 2008;10:311–321. doi: 10.1208/s12248-008-9035-6. [DOI] [PMC free article] [PubMed] [Google Scholar]
- 23.Halestrap AP, Price NT. The proton-linked monocarboxylate transporter (MCT) family: Structure, function and regulation. Biochem J. 1999;343:281–299. [PMC free article] [PubMed] [Google Scholar]
- 24.Degani H, Ronen SM, Furman-Haran E. Breast cancer: Spectroscopy and imaging of cells and tumors. In: Gillies RJ, editor. NMR in Physiology and Biomedicine. San Diego: Academic; 1994. pp. 329–351. [Google Scholar]
- 25.McConnell HM. Reaction rates by nuclear magnetic resonance. J Chem Phys. 1958;28:430–431. [Google Scholar]
- 26.Neeman M, Rushkin E, Kadouri A, Degani H. Adaptation of culture methods for NMR studies of anchorage-dependent cells. Magn Reson Med. 1988;7:236–242. doi: 10.1002/mrm.1910070212. [DOI] [PubMed] [Google Scholar]
- 27.Rivenzon-Segal D, Rushkin E, Polak-Charcon S, Degani H. Glucose transporters and transport kinetics in retinoic acid-differentiated T47D human breast cancer cells. Am J Physiol. 2000;279:E508–E519. doi: 10.1152/ajpendo.2000.279.3.E508. [DOI] [PubMed] [Google Scholar]
- 28.Aragón JJ, Felíu JE, Frenkel RA, Sols A. Permeabilization of animal cells for kinetic studies of intracellular enzymes: In situ behavior of the glycolytic enzymes of erythrocytes. Proc Natl Acad Sci USA. 1980;77:6324–6328. doi: 10.1073/pnas.77.11.6324. [DOI] [PMC free article] [PubMed] [Google Scholar]
- 29.Nakae Y, Stoward PJ. The diverse Michaelis constants and maximum velocities of lactate dehydrogenase in situ in various types of cell. Histochem J. 1994;26:292–297. doi: 10.1007/BF00157761. [DOI] [PubMed] [Google Scholar]
- 30.Slomiany MG, et al. Hyaluronan, CD44, and emmprin regulate lactate efflux and membrane localization of monocarboxylate transporters in human breast carcinoma cells. Cancer Res. 2009;69:1293–1301. doi: 10.1158/0008-5472.CAN-08-2491. [DOI] [PMC free article] [PubMed] [Google Scholar]
- 31.Edlund GL, Hapestrap AP. The kinetics of transport of lactate and pyruvate into rat hepatocytes. Biochem J. 1988;249:117–126. doi: 10.1042/bj2490117. [DOI] [PMC free article] [PubMed] [Google Scholar]
- 32.Wang Q, Morris EM. Flavonoids modulate monocarboxylate-1-mediated transport of γ-hydroxybutyrate in vitro and in vivo. Drug Metab Dispos. 2007;35:201–208. doi: 10.1124/dmd.106.012369. [DOI] [PubMed] [Google Scholar]
- 33.Neville MC, Wyssbrod HR. Spin-lattice relaxation times for 13C in isotope-enriched glycine accumulated in frog muscle. Biophys J. 1977;17:255–267. doi: 10.1016/S0006-3495(77)85654-3. [DOI] [PMC free article] [PubMed] [Google Scholar]
- 34.Neeman M, Degani H. Metabolic studies of estrogen- and tamoxifen-treated human breast cancer cells by nuclear magnetic resonance spectroscopy. Cancer Res. 1989;49:589–594. [PubMed] [Google Scholar]
Associated Data
This section collects any data citations, data availability statements, or supplementary materials included in this article.