SYNOPSIS
Objectives
We assessed the added value of using a geocoder to improve sexually transmitted disease (STD) surveillance data and decision support through redistribution of inaccurately assigned morbidity in Richmond, Virginia.
Methods
Virginia initiated geocoding of STD data as a data quality tool in 2002. Geocoded output files were assessed and discordant proportions of reported gonorrhea and chlamydia morbidity were reassigned appropriately for the city of Richmond, Chesterfield County, and Henrico County (2002 to 2006). We used Chi-square analysis to compare assignment proportions and calculated crude odds ratios for 2006 data to estimate increased case reassignment likelihood.
Results
From 2002 to 2006, 149,229 cases of gonorrhea and chlamydia were reported within the Commonwealth of Virginia. Of the reported morbidity, 81% of cases (n=120,875) were successfully geocoded; 7% (n=8,461) of geocoded addresses were reassigned. Approximately 76% (n=6,412) of all reassigned cases occurred within Richmond and Chesterfield and Henrico counties. In 2006, 84% (n=654) of reassigned cases in this tri-city/county area were initially reported as Richmond morbidity. Data quality improvements reduced Richmond's artificially inflated morbidity by 18% and increased Chesterfield and Henrico morbidity by 17% and 55%, respectively. Richmond morbidity was three times more likely to be reassigned than Chesterfield cases (odds ratio [OR] = 2.93, 95% confidence interval [CI] 2.21, 3.90), and two times more likely than Henrico cases (OR=2.12, 95% CI 1.63, 2.76). Richmond's number one national rank for STD rates was reduced beginning in 2002.
Conclusions
Declining rates of STDs were statistically associated with geocoded morbidity reassignments. Implementation of this data quality business process has improved epidemiologic analyses, prevention planning, and assessment of resource allocations. The reduction in Richmond's national STD rankings is indicative of the effect geocoding can have on surveillance data.
Data accuracy is critical for effective public health program decisions.1 Geographic data are important for public health research and practice, given that such data provide valuable insight into a key epidemiologic descriptor—place. City/county-level surveillance data provide a relatively meaningful and efficient means of assessing and evaluating epidemiologic trends at the local, state, and national levels. This level of granularity remains the dominant unit of geographic analysis, reporting, and planning for health departments and for sexually transmitted disease (STD) surveillance reports published by the Centers for Disease Control and Prevention (CDC).
In Virginia, health-care providers and laboratories report STD cases to the Virginia Department of Health (VDH) via a paper-based format inclusive of the patient's street address and a separate field called “City/County of Residence.”2 The information found in this field is used for city/county-level morbidity assignment with the assumption that this field corresponds to the patient's physical address location at the time of STD diagnosis. While this process seems straightforward, the city/county commonly indicated within a patient's postal address may be entirely different from the patient's physical city/county of residence. For example, a patient with the postal address “123 Common Road, Richmond, VA 23456” may be physically located in the adjacent county of Chesterfield. The city/county of the postal address is frequently and erroneously used to populate the City/County of Residence field on the morbidity reporting form. Errors also occur when this field is left blank on the morbidity reporting form. In such instances, a hierarchy for populating the City/County of Residence field is used, beginning with the patient's physical address, followed by the provider's address.
Although the discordance of postal address and physical city/county of residence is not unique to Virginia, the issue is exacerbated greatly because all Virginia cities are, by law, politically independent of any surrounding counties.3–6 This means that a city's morbidity reports are also completely independent of a surrounding county's morbidity. For the purpose of notifiable disease reporting, Virginia's independent cities are categorized as county equivalents. Thirty-nine of the 43 independent cities in the United States are in Virginia.6 Collectively, Virginia has 134 independent cities and counties (39 cities and 95 counties).
In 2002 the VDH Division of Disease Prevention (DDP) instituted geocoding as part of a larger geographic information system (GIS) initiative. In addition to being a fundamental component for detailed spatial analysis,7 the geocoder, which uses the patient's street address and zip code to identify the physical location, became an efficacious tool for identifying cases inadvertently attributed to a wrong city/county. The large percentage of inaccuracies identified during the first few weeks of geocoding resulted in the establishment of a routine data quality management (DQM) business process to ensure geocoding of all gonorrhea and chlamydia morbidity reports.
This article describes the methodology employed to improve data quality and the associated epidemiologic impact within the primary tri-city/county area comprising the city of Richmond and the counties of Chesterfield and Henrico.
METHODS
Background
On a weekly basis, DDP extracts reported cases of gonorrhea and chlamydia from CDC's STD Management Information System (STD*MIS),8 and geocodes the addresses of the case subjects using Centrus™ GeoStan.9 This process began in late 2002 and was retrospectively applied to all 2002 gonorrhea and chlamydia morbidity. Reference files for GeoStan are updated quarterly to ensure geocoding accuracy.
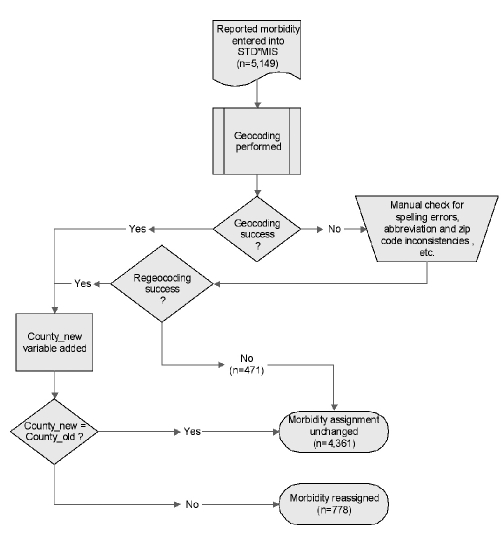
When geocoding is successful, STD cases are correctly assigned to their physical city/county of residence based on the reported postal addresses. If the geocoded city/county of residence (“county_new”) and the original city/county of residence (“county_old”) are discordant, then a change is necessary. This process is referred to as morbidity reassignment, and updates to STD*MIS are completed prior to weekly epidemiologic report generation. Figure 1 represents the business process flow related to STD geocoding. Weekly geocoded data file retention was initiated in 2006, including data variables such as the city/county of residence (originally reported and new addresses), geocoded coordinates, and associated error codes.
Figure 1.
Business process flowchart for geocoding STD morbidity: city of Richmond, Chesterfield County, and Henrico County, Virginia, 2006
STD = sexually transmitted disease
STD*MIS = Sexually Transmitted Disease Management Information System (Source: Centers for Disease Control and Prevention [US]. Sexually transmitted diseases: STD*MIS [cited 2009 May 27]. Available from: URL: http://www.cdc.gov/std/std-mis)
Construction of the dataset
Study cases included reported gonorrhea and chlamydia morbidity from January 1, 2002, through December 31, 2006, that were reassigned based on discordant geocoding results. Data used for formal statistical analyses came from cases reported in 2006, as data from 2002 to 2006 indicated comparable proportions of geocoded reassignments, and only data from 2006 existed in electronic format (Figure 2). The data were restricted to morbidity received for the city of Richmond, Chesterfield County, and Henrico County. The rationale for this restriction was due to this tri-city/county area constituting approximately 76% of Virginia's morbidity reassignments and the subsequent incidence rate reduction that impacted Richmond's national STD rankings after initiation of geocoding. By convention, we excluded cases that were reported more than one time for the same individual within a 31-day period to minimize the likelihood of duplicate infection reports.10
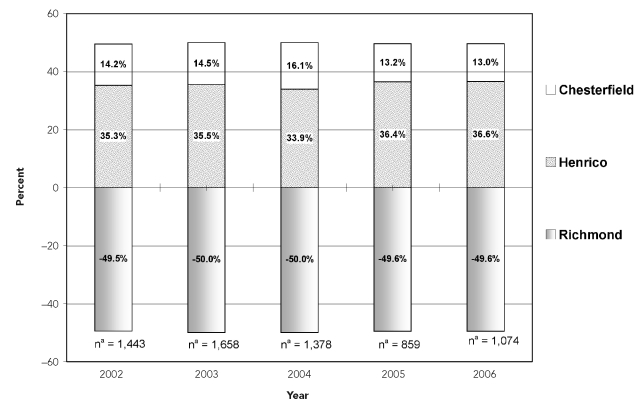
Figure 2.
Net gonorrhea and chlamydia morbidity reassignment percentages: city of Richmond, Chesterfield County, and Henrico County, Virginia, 2002–2006
aTotal number of net reassigned cases for the three jurisdictions
Data analysis
We analyzed data based on STDs, rather than individuals, because an individual could be diagnosed with gonorrhea and/or chlamydia more than once during a given year. For each year, we subtracted the number of cases lost from the number of cases gained to calculate the number of net reassigned cases. This calculation was performed independently for each of the three tri-city/county areas. We used the total number of net reassigned cases to calculate net reassigned percentages. A positive percentage indicated a net gain of cases and a negative percentage indicated a net loss of cases. We used a Chi-square test (two-sided, alpha = 0.05) to compare the city/county-specific morbidity before and after geocoding. We calculated the odds ratios (ORs) with 95% confidence intervals (CIs) to estimate case reassignment likelihood by city/county and to further our understanding of the effect of morbidity reassignment on the city of Richmond.
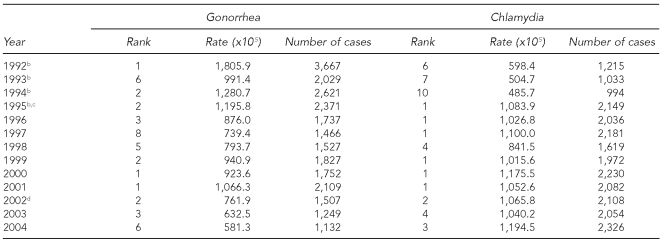
An assessment of Richmond's national ranking of gonorrhea and chlamydia rates was extracted from CDC's Annual Sexually Transmitted Disease Surveillance reports. We reviewed annual rankings for the years 1992 through 2004 to indicate the impact of Richmond's morbidity reassignment on national data and to provide historical context (Table 1).11 Subsequent annual data are not comparable, as the CDC ranking method was changed as of 2005.
Table 1.
Ranking of Richmond, Virginia, based on national summary of gonorrhea and chlamydia rates among cities with >200,000 population, 1992–2004a
aData source: Centers for Disease Control and Prevention (US). Sexually transmitted disease surveillance reports, 1992–2004 [cited 2009 May 27]. Available from: URL: http://www.cdc.gov/std/stats
bData from 1992–1995 for chlamydia rankings are based on non-rank tables requiring manual calculation.
cThe Virginia Department of Health initiated increased chlamydia screening criteria. Source: Virginia Department of Health. Revised chlamydia screening criteria for women. Internal correspondence to Virginia's local health district directors. 1995 Jun 7. Correspondence on file with authors.
dGeocoding was implemented for all data beginning in January 2002.
We performed all analyses using SAS® version 9.112 and created maps using ArcGIS version 9.2.13
RESULTS
From 2002 to 2006, a total of 149,229 chlamydia and gonorrhea cases were reported in Virginia. Of these cases, 81% (n=120,875) were geocoded to at least the city/county level. Of the total geocoded morbidity, 7% (n=8,461) were reassigned. Approximately 76% (n=6,412) of Virginia reassigned cases were reassigned within the tri-city/county Richmond area (annual mean = 1,264; range 859–1,568 cases).
Table 2 presents the distribution of chlamydia and gonorrhea morbidity in the tri-city/county Richmond area in 2006. A total of 5,149 cases were reported, of which 15% (n=778) were reassigned after geocoding (Figure 1). Within the city of Richmond, 3,625 combined gonorrhea and chlamydia cases were originally reported, of which 18% (n=654) were reassigned (lost) to the outlying counties. Richmond gained 3% (n=117) of initially reported morbidity, based on cases erroneously assigned to the counties. Lost morbidity accounted for 7% (n=56) in Chesterfield County and 9% (n=68) in Henrico County of originally reported cases; gained morbidity accounted for 24% (n=195) in Chesterfield and 64% (n=466) in Henrico. Geocoded redistribution of gonorrhea and chlamydia cases decreased Richmond's morbidity reports by 15%, while redistribution in Chesterfield and Henrico counties increased morbidity reports by 17% and 55%, respectively. Differences in city/county morbidity proportions before and after geocoding were statistically significant (p<0.001).
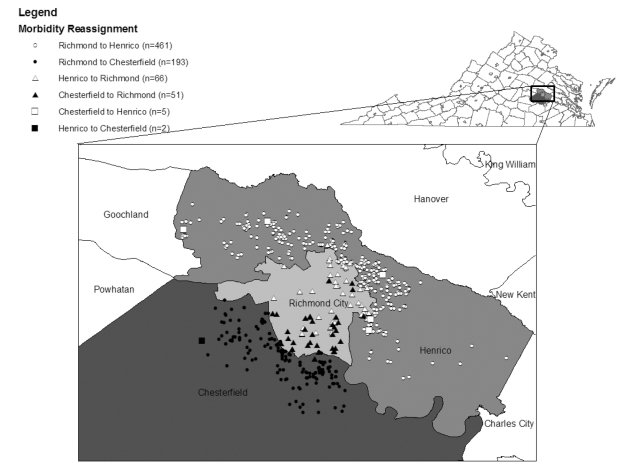
In 2006, 80% (n=654) of reassigned cases were initially reported as Richmond morbidity, of which 70% (n=461) and 30% (n=193) were reassigned to Henrico and Chesterfield, respectively. Figure 3 provides a visual assessment of differences in locality-to-locality reassignments—i.e., cases reassigned from Richmond to Henrico County are dispersed throughout the county more than cases reassigned from Richmond to Chesterfield County. Although Chesterfield County is not entirely depicted on the map, case reassignments were clustered in the northern section of the county. As depicted in Figure 2, the percentage of net morbidity reassignments by year (2002 to 2006) remained stable. The city of Richmond lost approximately 50% of the total reassigned cases, while the surrounding counties of Chesterfield and Henrico had a net gain of about 14% and 36%, respectively.
Figure 3.
Visual redistribution of STD morbiditya based on geocoded reassignment: city of Richmond, Henrico County, and Chesterfield County,b Virginia, 2006
aEach case location was randomly displaced by a fixed distance to maintain data confidentiality and avoid reengineering of points back to an actual residence.
bOnly the geographically affected area of Chesterfield County is pictured.
STD = sexually transmitted disease
The magnitude of reassignment in 2006 was significantly higher among cases initially reported as Richmond morbidity, as they were three times more likely to be reassigned than cases initially reported as Chesterfield (OR=2.93, 95% CI 2.21, 3.90), and two times more likely than cases initially reported as Henrico (OR=2.12, 95% CI 1.63, 2.76). Although morbidity initially reported as Henrico was more likely to be reassigned than cases reported in Chesterfield, this was not statistically significant (OR=1.39, 95% CI 0.96, 2.00).
As shown in Table 1, since 1992 the city of Richmond has ranked number one nationally for gonorrhea rates three times and number one for chlamydia rates six times. In June 1995, VDH initiated increased chlamydia screening criteria,14 which appear to have highly impacted Richmond's national ranking. In 2005, CDC's ranking tables became based on metropolitan statistical areas;15 therefore, 2005 data were not included.
DISCUSSION
The reassignment of STD morbidity within the tri-city/county Richmond area has been substantial since the implementation of geocoding as a DQM business process. Because of geocoding, reported morbidity has been routinely redistributed to appropriate cities/counties, resulting in a significant reduction in Richmond's proportion of total cases, and a proportional increase of case reports for both Chesterfield and Henrico counties. Since 2002, reassignment of approximately 15% of all reported gonorrhea and chlamydia cases has occurred annually within the tri-city/county Richmond area. Data from 2002 to 2006 indicated that the proportion of morbidity reassignments was approximately the same each year.
The results of this analysis also suggest that Richmond's net loss of STD morbidity from 2002 to 2004 had a direct effect on the national ranking of STD rates for cities with populations greater than 200,000. Richmond remained a leading city for rates of both gonorrhea and chlamydia from 2002 to 2004; however, it no longer held the number one ranking for gonorrhea or chlamydia rates in the U.S.
This analysis shows that the adoption of geocoding as a tool for improving morbidity reassignment is advantageous to Virginia's STD surveillance efforts. And, it indicates that the incorporation of geocoding into notifiable disease reporting standards or recommendations can lead to improved data quality, as well as enhanced spatial analysis capabilities for local, state, and national data.16
Limitations
This analysis had several limitations. The evaluation was based on a single five-year interval, beginning with 2002, the initial year geocoding was incorporated as a business process. Analysis was also limited to the tri-city/county Richmond area, which may have overestimated the value of morbidity reassignment for other urban areas, unless similar address issues exist. Although procedures are in place to minimize data-entry errors, the 2006 data used for this analysis were based on manual data entry into Virginia's STD*MIS application. And, the use of geocoding solutions are only as good as their underlying database(s) and data enhancement capacity.17 Lastly, any geocoding or other site-specific data quality procedures performed by other STD project areas that submit data to CDC are unknown, which may have had additional impact on historical national rankings.
Data quality improvements, based on geocoding morbidity addresses, produce an intrinsic added value for Virginia's STD surveillance activities. It has improved local health department perceptions of data value, enabled feasible time and effort requirements for assessing and correcting morbidity, and helped to ensure surveillance data accuracy. The most obvious data quality improvement to date has been the generation of more precise epidemiologic reports. Improvement to morbidity assignments is also translating into more refined knowledge of localized STD activity, better assessments of disease intervention staffing needs, and a greater understanding and rationale for more targeted STD prevention efforts.18
Caution must be exercised, however, when assessing STD clinic staffing capacity based on geocoded morbidity reassignments. Evaluation of staffing requirements based predominantly on reassigned surveillance data may misrepresent clinical and surveillance staffing needs. Although the geocoded morbidity is more accurate, clinical staffing needs should assign more weight to the historical volume of attendees and related diagnoses at the respective clinics than to strict interpretation of surveillance-related data quality improvements.
Healthy People 2010 objectives suggest that public health applications should strive to incorporate geocoding capabilities as part of overall DQM.19 Geocoding will provide additional opportunities for STD data quality improvement as GIS becomes more common within public health programs.20–25 To continuously strive for data quality improvements, public health programs must include the translation and dissemination of these types of findings into program modifications or service delivery.26
CONCLUSIONS
We believe this is the first analysis to show how GIS-related DQM procedures impact epidemiologic surveillance of STDs, as existing geocoding literature related to epidemiology primarily focuses on usage and investigation of positional accuracy.20,27 Improving surveillance through morbidity reassignments is just one of many potentially useful applications of GIS-related technologies. In the future, state and federal agencies should consider inclusion of geocoding standardization within new communicable-disease application development. Such standards, including integration of front-end address verification and geocoding, will improve overall public health planning through enhanced data comparability, epidemiologic analyses, and data visualization capacity.
Table 2.
Distribution of gonorrhea and chlamydia based on geocoded morbidity assignments in the tri-city/county Richmond area,a 2006
aThe tri-city/county Richmond area comprised the city of Richmond and the counties of Chesterfield and Henrico.
bNon-geocodable cases (n=471) were retained within the city/county of initial morbidity report and are included in the redistributed case counts for each city/county in the table. Hence, the total reported cases and redistributed cases are equal.
REFERENCES
- 1.Miller L, Rodriguez A. An exercise in decision support: analyzing healthy data. Healthy GIS, ESRI, Spring 2008. [cited 2009 May 27]. p. p. 2. Also available from: URL: http://www.esri.com/library/newsletters/healthygis/healthygis-spring08.pdf.
- 2.Virginia Department of Health. Regulations for disease reporting and control, October 24, 2007. [cited 2009 May 27]. Available from: URL: http://www.vdh.virginia.gov/Epidemiology/documents/pdf/regs.pdf.
- 3.Casper ML, Barnett E, Williams GI, Jr, Halverson JA, Braham VE, Greenlund KJ. Atlanta: Centers for Disease Control and Prevention (US); 2003. Atlas of stroke mortality: racial, ethnic, and geographic disparities in the United States. [Google Scholar]
- 4.Virginia Department of Housing and Community Development. Former second class cities in Virginia, November 13, 2003. [cited 2008 Feb 5]. Available from: URL: http://www.dhcd.virginia.gov/CommissiononLocalGovernment/PDFs/second.class.cities.pdf.
- 5.Grymes CA. Town and city boundaries and annexation, Virginia places. [cited 2009 Feb 27]. Available from: URL: http://www.virginiaplaces.org/vacities/towncityboundaries.html.
- 6.Economic Expert.com. Independent city. [cited 2009 Feb 27]. Available from: URL: http://www.economicexpert.com/a/Independent:city.htm. [Google Scholar]
- 7.Goldberg DW, Wilson JP, Knoblock CA. From text to geographic coordinates: the current state of geocoding. Urban and Regional Information Systems Association [URISA] 2006. Jul 31, [cited 2008 Jul 10]. Available from: URL: http://www.urisa.org/goldberg.
- 8.Centers for Disease Control and Prevention (US) Sexually transmitted diseases: STD*MIS. [cited 2009 May 27]. Available from: URL: http://www.cdc.gov/std/std-mis.
- 9. Pitney Bowes/Group 1 Software, Inc. Centrus™ GeoStan: Version 5. Lanham (MD): Pitney Bowes/Group 1 Software, Inc.; 2009.
- 10.Sexually transmitted diseases treatment guidelines, 2006. MMWR Recomm Rep. 2006;55(RR-11):1–94. published erratum appears in MMWR Recomm Rep 2006;55(36):997. [PubMed] [Google Scholar]
- 11.CDC (US), Division of STD/HIV Prevention. Sexually transmitted disease surveillance,1992–2004. [cited 2009 May 27]. Available from: URL: http://www.cdc.gov/std/stats.
- 12. SAS Institute, Inc. SAS®: Version 9.1. Cary (NC): SAS Institute, Inc.; 2008.
- 13. Environmental Systems Research Institute. ArcGIS: Version 9.2. Redlands (CA): ESRI; 2006.
- 14.Virginia Department of Health. Revised chlamydia screening criteria for women. Internal correspondence to Virginia's local health district directors. 1995 Jun 7; Correspondence on file with authors. [Google Scholar]
- 15.CDC (US), Division of STD Prevention. Sexually transmitted disease surveillance, 2005. [cited 2009 May 27]. Available from: URL: http://www.cdc.gov/std/stats05.
- 16.Clarke KC, McLafferty SL, Tempalski BJ. On epidemiology and geographic information systems: a review and discussion of future directions. Emerg Infect Dis. 1996;2:85–92. doi: 10.3201/eid0202.960202. [DOI] [PMC free article] [PubMed] [Google Scholar]
- 17.Pitney Bowes/Group 1 Software, Inc. Lot 54, where are you? Geocoding: the key to determining location characteristics. [cited 2009 May 27]. Available from: URL: http://www.pbinsight.com/files/resource-library/resource-files/Lot_54_Where_are_you_-_Geocoding.pdf.
- 18.National Alliance of State and Territorial AIDS Directors. Targeting populations using geo-mapping and social network strategies. June 2007 HIV Prevention Bulletin. [cited 2009 May 27]. Available from: URL: http://www.nastad.org/Publications/bulletin.aspx.
- 19.Department of Health and Human Services (US) Healthy People 2010, volume II: objectives for improving health (part B: focus area 23: public health infrastructure) [cited 2008 Feb 5]. Available from: URL: http://www.healthypeople.gov/Document/HTML/Volume2/23PHI.htm#_Toc491137862.
- 20.Zimmerman DL, Fang X, Mazumdar S, Rushton G. Modeling the probability distribution of positional errors incurred by residential address geocoding. Int J Health Geogr. 2007;6:1. doi: 10.1186/1476-072X-6-1. [DOI] [PMC free article] [PubMed] [Google Scholar]
- 21.Croner CM. Public health, GIS, and the Internet. Annu Rev Public Health. 2003;24:57–82. doi: 10.1146/annurev.publhealth.24.012902.140835. [DOI] [PubMed] [Google Scholar]
- 22.Krieger N, Waterman P, Lemieux K, Zierler S, Hogan JW. On the wrong side of the tracts? Evaluating the accuracy of geocoding in public health research. Am J Public Health. 2001;91:1114–6. doi: 10.2105/ajph.91.7.1114. [DOI] [PMC free article] [PubMed] [Google Scholar]
- 23.Law DC, Serre ML, Christakos G, Leone PA, Miller WC. Spatial analysis and mapping of sexually transmitted diseases to optimize intervention and prevention strategies. Sex Transm Infect. 2004;80:294–9. doi: 10.1136/sti.2003.006700. [DOI] [PMC free article] [PubMed] [Google Scholar]
- 24.McKenna E. GIS takes flight in public health sector. [cited 2009 May 27];Washington Technology. 1999 14(2) Also available from: URL: http://www.washingtontechnology.com/print/14_2/491-1.html. [Google Scholar]
- 25.Vine MF, Degnan D, Hanchette C. Geographic information systems: their use in environmental epidemiologic research. Environ Health Perspect. 1997;105:598–605. doi: 10.1289/ehp.97105598. [DOI] [PMC free article] [PubMed] [Google Scholar]
- 26.Kalmuss D, Armstrong B. Service-based research: linking public health research and practice to improve the quality of public health programs. J Public Health Manag Pract. 2008;14:62–5. doi: 10.1097/01.PHH.0000303415.96979.0f. [DOI] [PubMed] [Google Scholar]
- 27.Kravets N, Hadden WC. The accuracy of address coding and the effect of coding errors. Health Place. 2007;13:293–8. doi: 10.1016/j.healthplace.2005.08.006. [DOI] [PubMed] [Google Scholar]


