Abstract
Several prodrug approaches were taken to mask amino groups in two potent and selective neuronal nitric oxide synthase (nNOS) inhibitors containing either a primary or secondary amino group to lower the charge and improve blood-brain barrier (BBB) penetration. The primary amine was masked as an azide and the secondary amine as an amide or carbamate. The azide was not reduced to the amine under a variety of in vitro and ex vivo conditions. Despite the decrease in charge of the amino group as an amide and as carbamates, BBB penetration did not increase. It appears that the use of azides as prodrugs for primary amines or amides and carbamates as prodrugs for secondary amines are not universally effective approaches for CNS applications.
Keywords: amine prodrug, neuronal nitric oxide synthase inhibitor, blood-brain barrier, organic azide
1. Introduction
Central nervous system (CNS) disorders comprise the second largest therapeutic area (behind cardiovascular disorders).i These diseases can be the most difficult to treat because drugs must penetrate the blood-brain barrier (BBB) to be effective. The BBB protects the brain parenchyma from blood-borne agents, including potential neurological therapeutics.ii,iii In fact, it is estimated that only about 2% of potential CNS compounds can penetrate the BBB.iv The physicochemical requirements for a small molecule to diffuse passively across the BBB have been well studied, and guidelines for these properties have been postulated.v In general, the BBB will not allow compounds to pass into the CNS that are highly polar, have a large number of hydrogen bond donor groups, or that carry several charges, unless they are specifically taken up by an active transport system. This means that a great many potential drugs with high efficacy in vitro have little or no activity in vivo.
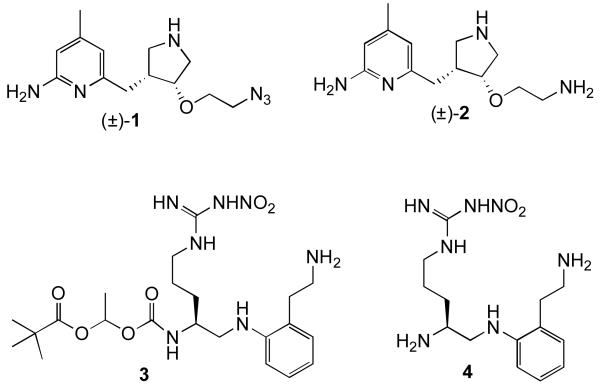
In our search for selective inhibitors of neuronal nitric oxide synthase (nNOS) we have designed compounds that possess high in vitro activity, but at physiological pH they contain multiple hydrogen bond donors and two positive charges; these characteristics limit their ability to cross the BBB. We found we could lower the number of hydrogen bond donors by one by substitution of an oxygen atom for one of the secondary amino groups without a detrimental effect on potency;vi this resulted in only a small increase in BBB penetration. To make a more substantial impact on BBB penetration, we wished to eliminate one of the charges and increase lipophilicity by various prodrug approaches. One approach is by the substitution of an azido group for a primary amino group. The potential benefits of this prodrug are that (1) the only by-product of metabolic conversion to the drug would be molecular nitrogen; (2) it has a low molecular weight; (3) azides are easily synthesized, and (4) azides are relatively inert in vivo.7 For the purpose of CNS penetration, they are not charged, are nonpolar (relative to a primary amine), are not H-bond donors, do not add rotatable bonds, and do not significantly affect the water solubility of the molecule. However, they would only be suitable as prodrug moieties if they become reduced to primary amines on a physiologically relevant time scale. There are numerous examples of compounds that possess azido functional groups that are converted to amines in vivo.viii,ix,x,xi,xii,xiii For example, the azido group of the HIV drug AZT is metabolized to an amine.12 With other nucleotide drugs, amines have been masked as azides to prevent rapid deamination, and the azide is then enzymatically converted back to the amine. Encouraged by these studies, we decided to investigate whether an azide prodrug would be effective with our nNOS-selective inhibitors.xiv An azide version (1, Figure 1) of one of our truncated 2-aminopyridine-based inhibitors (2)6 was chosen for the investigation. L-Nitroarginine-based inhibitor 4xv was synthesized with a pivaloylethoxycarbamate prodrug moiety capping one of its primary amino groups (3) for comparative purposes and to determine whether this type of prodrug is effective for CNS therapeutics.
Figure 1.
Primary amine prodrug analogues
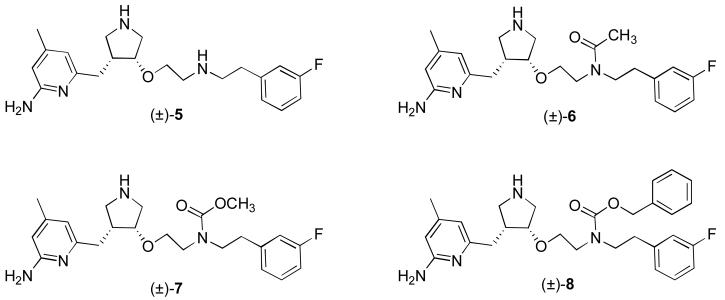
A prodrug approach for our secondary amine selective nNOS inhibitors, such as 5 (Figure 2),xvi also was attempted. Recent studies on the ability of 5 to cross the BBB indicated that it does cross into the brain, but only to a small degree.6 Compound 5 has a molecular weight in the desirable range for bioavailability of a CNS drug (372 Da), its number of hydrogen bond acceptors is favorable (5), and its polar surface area (74) is in the appropriate range.5 The pKa of the aminopyridine moiety is about 7, but that of the two secondary amines is about 9, indicating a total charge of +2 at physiological pH. Also, at physiological pH, the two secondary amines should be protonated, producing a total of 6 hydrogen bond donors; most CNS drugs have fewer than four.5 Furthermore, the log D, predicted to be approximately −0.1 for 5,6 is lower than the desired range of 1-3 for a brain penetrant drug.xvii Consequently, we thought that a prodrug of 5, in which one of the secondary amino groups was neutralized as an amide or carbamate, would be useful to enhance BBB penetration by lowering the total charge to +1, by removing two hydrogen bond donors, and by raising the log D. A carbamate linkage is significantly less polar than an amide bond;xviii therefore, a carbamate should have more of an impact on brain uptake, as the passive diffusion rate should be much greater. It was anticipated that once the prodrug crossed the BBB, it would be converted back to the dicationic form, which is needed for potency and selectivity as a nNOS inhibitor.16 Three prodrug analogues were synthesized (6-8, Figure 2) for this purpose.
Figure 2.
Structure of nNOS inhibitor 5, and analogs 6-8, designed to test whether removing a charge and increasing lipophilicity leads to greater BBB penetration.
2. Results
2.1 Azide Prodrug (1)
2.1.1 Chemistry
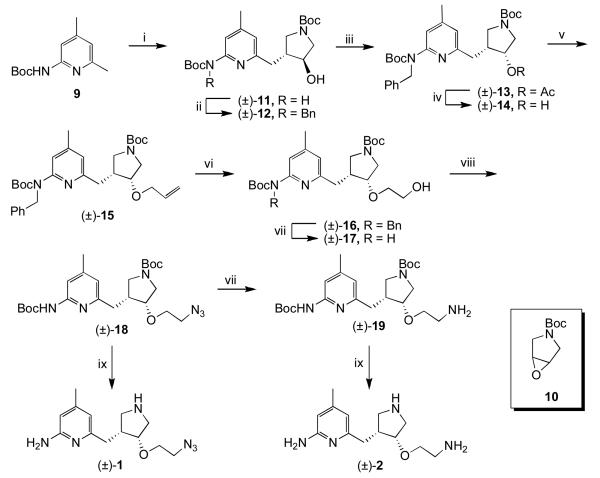
Azide 1 was synthesized using chemistry described previously up to (±)-15 (Scheme 1).6 Boc protected 2-amino-4,6-dimethylpyridine 9 was deprotonated with n-BuLi and used to open epoxide 10. The carbamate group of the resulting alcohol ((±)-11) was protected with a benzyl group ((±)-12), and then a Mitsunobu reaction was performed to install the oxygen with cis stereochemistry ((±)-13). The ester was hydrolyzed, and the resulting alcohol ((±)-14) was deprotonated with sodium hydride and alkylated with allyl bromide to give (±)-15. Ozonolysis, followed by reduction of the ozonide with NaBH4, gave alcohol (±)-16. The benzyl group was removed ((±)-17), and a Mitsunobu reaction using DPPA as a source of azide was performed. A portion of the resulting azide ((±)-18) was reduced to amine 13. Both 18 and 19 were treated with acid to remove the Boc groups and give 1 and 2, respectively.
Scheme 1.
i) nBuLi, THF, −78 °C to rt, 30 min, then 10, −78 °C to rt, 4h; ii) NaH, DMF, 0 °C, 30 min, then BnBr, rt, 16h; iii) PPh3, DIAD, AcOH, THF, rt, 16h; iv) 1N NaOH (aq), MeOH, rt, 16h; v) NaH, DMF, 0 °C, 30 min, then allyl bromide; vi) O3, MeOH, −78 °C, 1h, then NaBH4, rt, 3h; vii) H2, Pd / C, MeOH, 2d; viii) PPh3, DIAD, DPPA, THF, rt, 16h; ix) 4N HCl, dioxanes, rt, 16h.
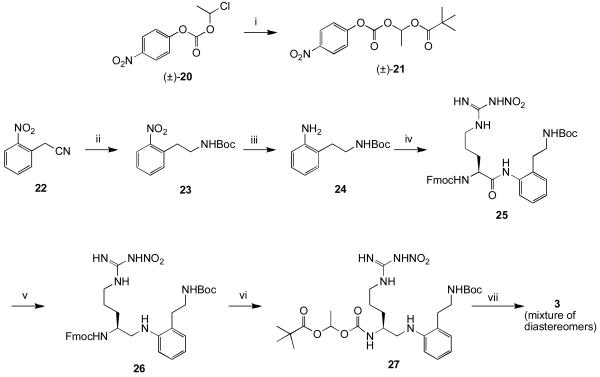
The synthesis and activity of inhibitor 4 have been described previously.15 Compound 3 was synthesized via the route shown in Scheme 2. Activated carbonate 21 was synthesized as a racemic mixture using 20 and mercuric pivalate.xix The nitrile group of 22 was reduced selectively with borane in THF. After Boc protection of the resulting primary amine, the nitro group was reduced under hydrogenation conditions to give 24. Coupling of Fmoc protected nitroarginine to 24 proved troublesome, but could be achieved by generating the acid fluoride using TFFH. Reduction of the amide bond with borane gave 26. The Fmoc group was removed, and the resulting primary amine was coupled to activated carbonate 21. Removal of the Boc group with TFA gave 3 as a diastereomeric mixture of salts.
Scheme 2.
i) Hg(tBuCOO)2, pivalic acid, 80 °C; ii) BH3-THF, then Boc2O, p-dioxane, 10% NaHCO3; iii) H2, Pd/C, MeOH/H2O/AcOH; iv) Fmoc-Arg(NO2)-OH, TFFH, HOAt, CH2Cl2/aq. NaHCO3; v) BH3-THF, −10 °C; vi) 20% piperidine, DMF, then 21, DIEA, CH3CN; vii) TFA, CH2Cl2.
2.1.2 Metabolism of 1-4
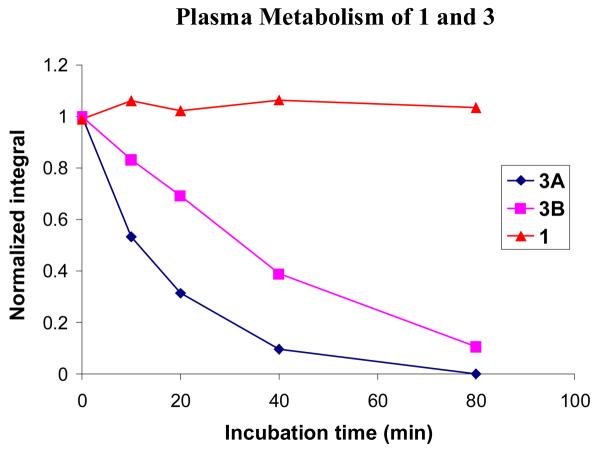
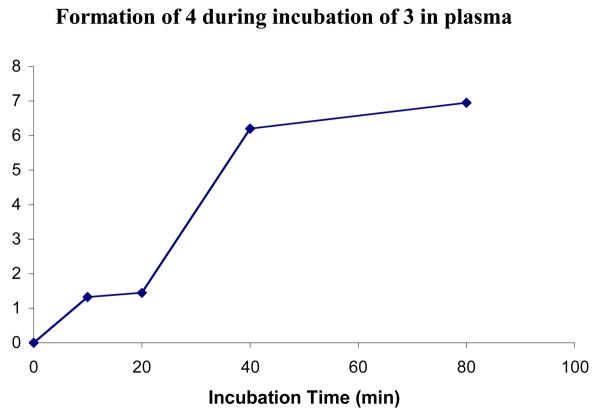
Compounds 1 and 3 were incubated in fresh mouse plasma at 37 °C in the presence of a NADPH regenerating system, as azide reduction is believed to be NADPH dependent. Compound 3 was used mainly to show that the plasma was active. At certain time intervals, the reactions were quenched, and the amount of prodrug remaining was quantified by HPLC. Figure 3 shows the normalized peak integrals for each compound. No significant metabolism of azide 1 was observed over 80 minutes. This is to be expected as the concentration of P450s in plasma is extremely low, and 1 should be stable to hydrolysis. In contrast, the metabolism of 3 was rapid because of the abundance of esterases in plasma. As a result of the presence of a stereogenic center in the prodrug moiety, 3 is a mixture of two diastereomers, which are separable by HPLC. The two isomers (3A and 3B) are metabolized at different rates. One diastereomer was metabolized with a half-life of approximately 10 minutes and was almost completely consumed by 80 minutes. The other was hydrolyzed more slowly with a half-life of approximately 30 minutes and could still be quantified at the 80-minute time point. The peak in the HPLC corresponding to the parent compound (4), was also analyzed (Figure 4). A clear increase in peak area over time was observed, indicating that the prodrug was indeed being converted to the parent compound and that the mouse plasma was active.
Figure 3.
Incubation of 1 and 3 in fresh mouse plasma. The area under the peak was integrated and the value was normalized based on the integration at 0 min. Two diastereoisomers of 3 are shown separately (3A and 3B).
Figure 4.
Formation of compound 4 from prodrug 3 during incubation in fresh mouse plasma (not normalized)
Compounds 1 and 3 were incubated with fresh mouse brain homogenate in phosphate buffered saline (pH 7.4) at 37 °C with NADPH added in excess to investigate the extent of metabolism in brain tissue. At various time points the reactions were stopped by heating to 95 °C for 1 minute. The mixtures were partially purified by solid phase extraction (SPE), and the amount of compound was quantified by HPLC (see Supporting Information). The amount of each diastereomer of 3 decreased over the course of the experiment. As in the case of the plasma metabolism, one of the diastereomers was metabolized slightly faster than the other. However, the rate of metabolism was not nearly as rapid as it was in plasma because of the decreased abundance of esterases. The concentration of 1 did not decrease over the course of the experiment, indicating that no significant metabolism occurred to the azide.
Since no azide reduction was observed in the brain homogenate experiment, a simpler system with an abundance of reducing enzymes was investigated. Microsomes, a concentrated mixture of liver enzymes rich in cytochrome P450s, were added to the compounds at several concentrations, and the mixtures were incubated in the presence of excess NADPH. At certain time points, the reactions were stopped by the addition of acetonitrile. After centrifugation, the supernatant was analyzed by HPLC. Typically, microsomes tend to metabolize compounds very rapidly under these conditions, and it was expected that the azide would be degraded over time. It would then be necessary to prove whether the degradation was due to reduction of the azide to the amine, or due to some other type of metabolism. The experiment was performed in parallel with a control, minaprine, a prescription drug that is known to be rapidly metabolized under similar assay conditions, to determine whether the microsomes contained active P450s. As expected, the diastereomers of 3 were metabolized over time at different rates (See Supporting Information). A peak corresponding to the active compound (4) did grow in, but it was difficult to quantify, as it was small and overlapped with other peaks. Because the concentration of esterases in the mixture is not very high, and microsomes denature fairly rapidly at 37 °C, 3 was not fully degraded, and the concentration of prodrug remaining leveled off after 20 minutes. The minaprine was rapidly degraded, confirming the P450 activity of the microsome mixture. However, no significant loss of the azide was observed. It appears that this compound is stable to P450 metabolism.
Because in vitro azide reduction by P450s is inhibited by oxygen,11 the incubation was repeated with increasingly stringent anaerobic conditions, ultimately using vials with rubber septa under a balloon of nitrogen with the reaction run in deoxygenated buffer. However, although minaprine was metabolized readily, no statistically significant loss in azide was detected. Mass spectral analysis of the reaction mixtures showed no peak corresponding to the amine. The acyloxyalkylcarbamate prodrug (3) was cleaved relatively quickly in plasma, but more slowly in brain homogenate and with liver microsomes (data not shown).
2.2. Amido and Carbamate Prodrugs 6-8
2.2.1 Chemistry
Three analogues of 5 were synthesized (6-8) to determine the effect of neutralization of one of the amino groups. The N-acetyl analogue (6) was synthesized in a straightforward way starting from (±)-283 as shown in Scheme 3.
Scheme 3.
i) Ac2O, MeOH, rt, 1h; ii) H2, Pd(OH)2 / C, MeOH, 60 °C, 1-2 d; iii) 4N HCl, dioxanes, rt 16h
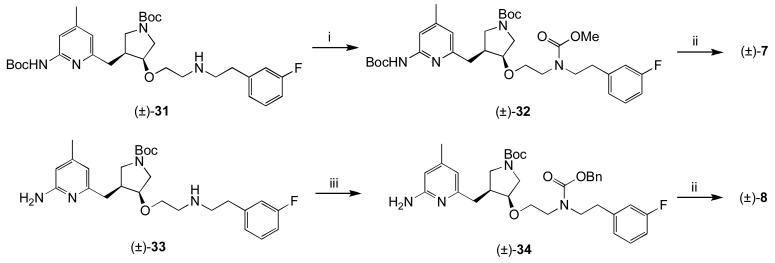
The two carbamate prodrugs (7 and 8) were synthesized by the routes in Scheme 4.
Scheme 4.
i) ClCOOMe, MeOH, rt, 4h; ii) 4N HCl, dioxanes, rt 16h; iii) ClCOOBn, MeOH, rt 4h.
2.2.2. Metabolism of 5-8
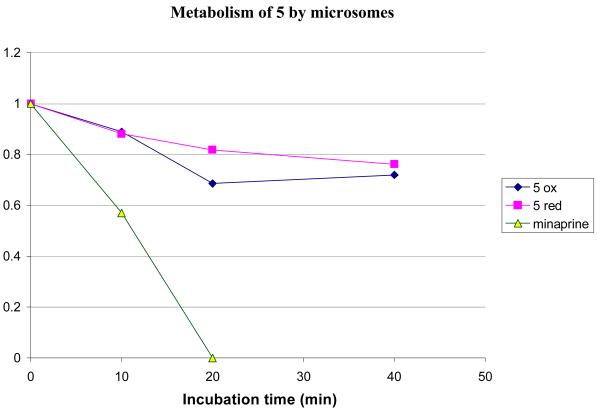
Compound 5 was treated with rat liver microsomes in the presence and absence of NADPH, to determine whether any metabolism observed was NADPH dependent. The results are shown in Figure 5.
Figure 5.
Metabolic stability of 5 with microsomes at 37 °C. The experiment was performed in the presence (5 red) and absence (5 ox) of additional NADPH. Minaprine concentration at 20 min was >0 but was not quantifiable.
Clearly, there is some degree of metabolism under both sets of conditions, suggesting that the metabolism is not NADPH dependent. However, the amount of compound lost is relatively small; approximately 20% is lost over 30 minutes. Given that the microsomes are concentrated in enzymes, this equates to reasonable metabolic stability. The background metabolism of 5 should not interfere with possible prodrug conversion studies or BBB penetration studies, especially since the compounds will not be administered orally.
Compounds 6-8 were compared to 5 for metabolic stability in the same assay. All were comparably stable; greater than 80% remained after a 40-minute incubation at 37 °C. Compound 8 was less stable, possibly the result of oxidation of the benzyl group. Nonetheless, greater than 60% of 8 remained after a 40-minute incubation (See Supporting Information).
2.2.3. Brain Penetration of 5-8
A mouse brain uptake study of 5 was carried out using LCMS/MS detection, which is approximately 1000 times more sensitive than HPLC with UV detection and gives reliable and consistent quantification. The internal standard selected was 35, as it is a structural isomer of 5, yet elutes differently by LC. A known amount of the internal standard was added prior to all extractions, and the final quantification was performed as a ratio of the compound of interest to the internal standard. Standard curves for the concentration of 5 in plasma and in brain are shown in Supporting Information. 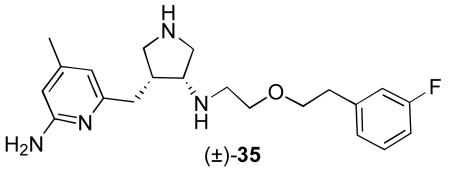
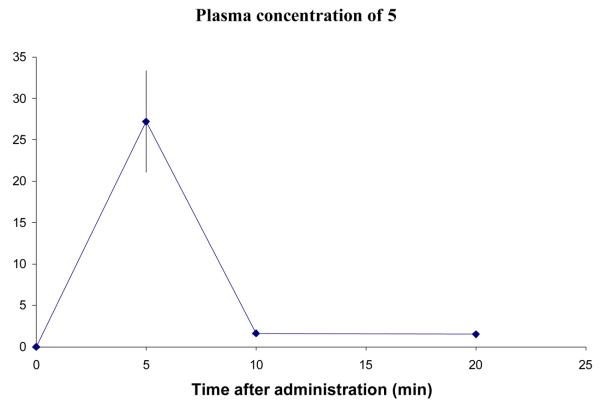
Six mice were given 5 by intraperitoneal (i.p.) injection at 3.7 mg/kg, a concentration at which no toxicity was observed. Three mice were sacrificed 5 minutes after administration; the other three were sacrificed 10 minutes after administration. Blood and brain samples were taken from each mouse, and the compounds were extracted. At a later date, three more mice were given 5 and sacrificed 20 minutes after administration. The plasma data are shown in Figure 6 and the brain data are in Figure 7. The amount of 5 was calculated in μg/mL of plasma, and μg/g of brain. This value was converted to μM for display to allow a straightforward comparison between compounds. The conversion for calculating the concentration in the brain assumed that the brain density is 1.0 g/mL. The density of brain may be greater than this, which would mean that the real concentrations would be higher than shown.
Figure 6.
Concentration of 5 in plasma after an i.p. dose of 3.7 mg/kg. Error bars show standard error mean.
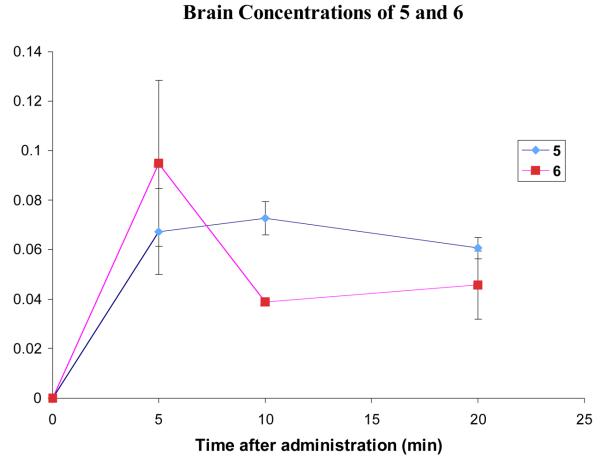
Figure 7.
Comparison of the brain concentrations of 5 and 6 after administration of 3.7 mg/kg and 4.1 mg/kg respectively. Error bars show standard error mean.
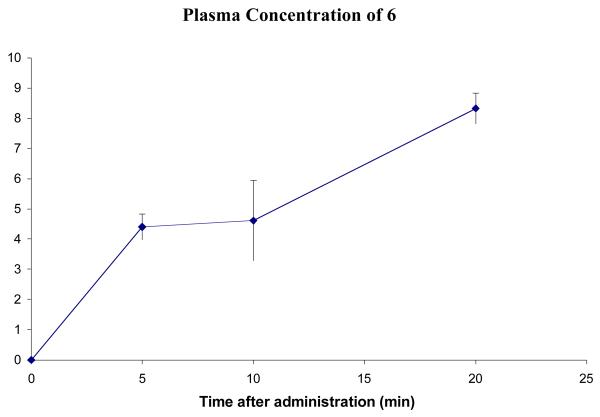
A brain uptake study of 6 was carried out in mice (Figures 8 and 7). The blood profile of 6 does not match that of 5 in that the plasma concentration appears to increase continually up for at least 20 minutes. This could mean that 6 is taking longer to diffuse across the lining of the peritoneal cavity into the blood stream.
Figure 8.
Concentration of 6 in plasma after a dose of 4.1 mg/kg. Error bars show standard error mean.
The brain concentration of 6 (Figure 7) peaks at 5 min and then drops, suggesting that the compound might be a substrate for efflux pumps that are actively removing the compound from the brain. Analysis of the brain samples showed no presence of 5, indicating that the acetyl group was not cleaved during the 20-minute experiment.
Comparing the brain penetration curves of 5 and 6 (Figure 7) gives a surprising result. The concentration of 6 at 5 minutes is comparable or slightly higher than that of 5, but drops to a level that is below that of 5 by the 10-minute time point, and so the AUC for each compound over the 20-minute experiment is roughly the same. As the two compounds were administered at the same dose, this indicates that the acetylation of 5 to give 6 results in no increase in brain uptake. It was predicted that the elimination of one positive charge would have a significant positive effect on brain uptake, but this is not the case with 6.
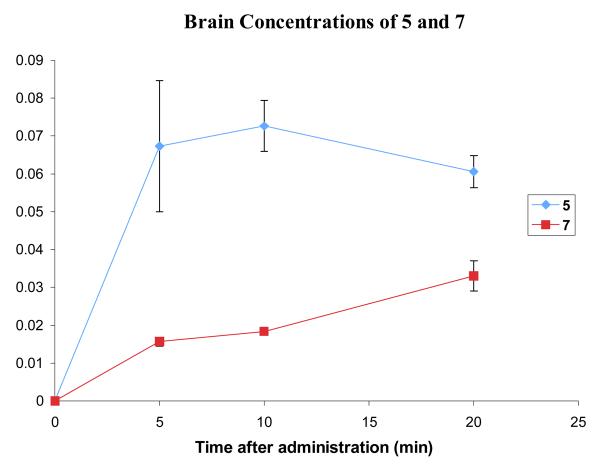
A brain uptake study of the more lipophilic methyl carbamate 7 at 4.3 mg/kg was carried out using the same procedure as for 6 (Figure 9). The plasma (see Supporting Information) and brain levels were calculated by LCMS/MS. Plasma levels of 7 peak at 5 minutes and decline slowly over the next 15 minutes. The brain levels of 7 are very low at 5–10 minutes but continue to rise at 20 minutes and might peak at a higher level. These data seem to suggest that the rate at which 7 crosses the BBB is slow. Although the brain levels have not peaked, it is unlikely that they will reach a level that is significantly higher than that of 5 (Figure 9). The AUC up to 20 minutes for 5 was much greater than that for 7. This implies that for overall brain uptake the methyl carbamate modification is even less effective than acetylation.
Figure 9.
Comparison of the brain concentrations of 5 and 7 after a dose of 3.7 and 4.3 mg/kg, respectively. Error bars show the standard error mean.
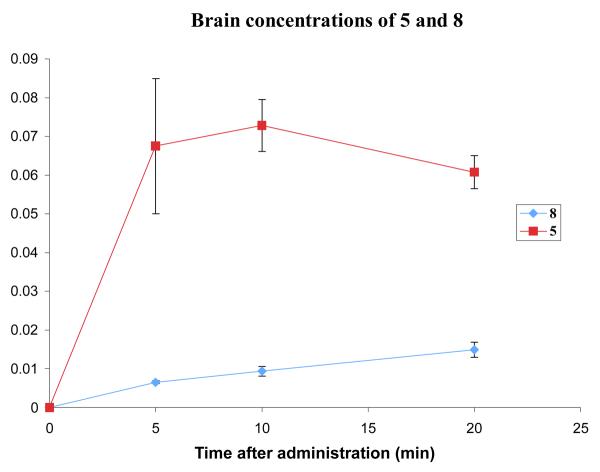
For the brain uptake study with 8, compound 7 was used as the internal standard, as these two compounds are more similar than 8 and 35, and the chromatography was therefore more reliable. Compound 8 was administered to mice at a dose of 5.1 mg/kg. Two mice were sacrificed at each time point, and the plasma and brain samples were analyzed by LCMS (see Supporting Information). The plasma concentration curve for 8 is similar to that for 7, peaking at around 1 μM and declining slowly over the course of the experiment. The curve for the brain concentration of 8 also resembles that for 7. The levels at 5 minutes are extremely low, but are steadily increasing throughout the course of the experiment. However, even by the 20-minute time point, the concentration of 8 is still far below that of 5 (Figure 10), and the AUC over the 20-minute experiment is much lower.
Figure 10.
Comparison of the brain concentrations of 5 and 8 after a dose of 3.7 and 5.1 mg/kg, respectively. Error bars show the standard error mean.
In the case of carbamates 7 and 8, the prodrug modification is detrimental to brain uptake over the first 20 minutes. The brain levels for both compounds increase, whereas those for 5 are beginning to decrease, and so over the course of a longer uptake study the concentration of carbamate may eventually exceed that of 5. This is not encouraging for the use of (acyloxy)alkyl carbamate prodrugs such as 3, as these would be hydrolyzed before they could offer any advantage for brain uptake.
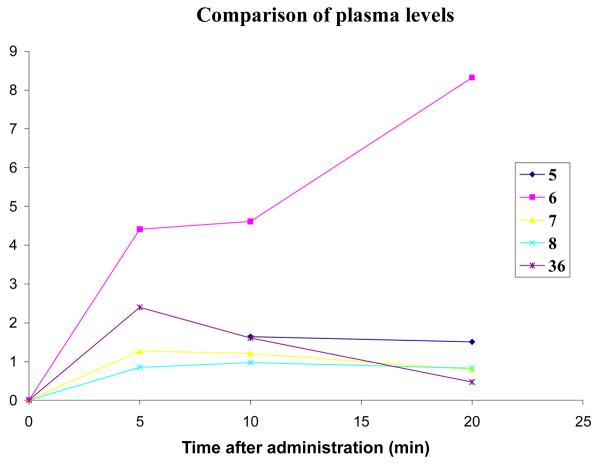
A comparison of the in vivo concentrations of all of the compounds tested, as well as 36,16 the amino analogue of 5, allows some conclusions to be drawn. Figure 11 shows the plasma levels of all of the compounds used in this study. For clarity, the error bars have been omitted, and the five-minute point for 5 was omitted, as it is much higher than the others. 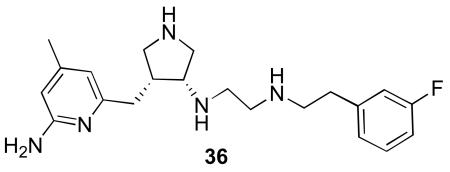
Figure 11.
Comparison of the plasma levels of 5, 6, 7, 8, 36 after i.p. injection.
The two carbamates (7 and 8) behave similarly in that their levels are fairly constant over 20 minutes but are lower than those of 5 and 36 (except at the 20-minute time point). This may be caused by a low rate of diffusion from the peritoneal cavity into the blood or that these compounds bind to more proteins and cellular components than 5 so that their free plasma concentrations are lower. The compound that displays a different profile is 6, the acetylated compound. In the case of this compound, the plasma levels are higher than the other compounds and are actually increasing with time. It could be that although this compound is diffusing slowly into the blood, it is ultimately more bioavailable than the other compounds.
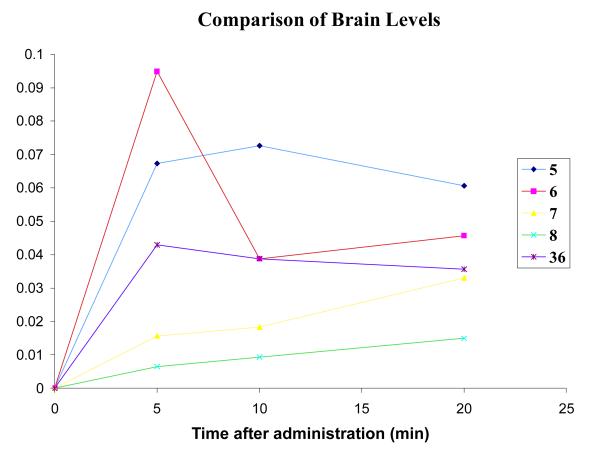
A comparison of the brain levels of each compound is shown in Figure 12. It is apparent that over the course of the 20-minute experiment there is not much difference among the overall brain concentrations of the compounds tested. As noted earlier,6 brain uptake by 5 is greater than that for 36, presumably because of the one less hydrogen bond donor in 5. Compounds 5 and 6 have a similar AUC, indicating similar overall brain penetration. Surprisingly, the brain concentrations of the two carbamates (7 and 8) are less than the other compounds. Even though their plasma levels were lower, it was expected that the brain levels would be higher, as the compounds are more lipophilic (see Table 1 for calculated log D values) and should diffuse across the BBB more readily. A summary of the brain penetration results for compounds 5-8 is shown in Table 1.
Figure 12.
Comparison of brain concentrations of 5, 6, 7, 8, 36 after i.p. injection.
Table 1.
Average concentrations of compounds 10 min after administration of an intraperitoneal dose of 10 μmol/g of compounds 5-8, and 36. Errors are standard error mean.
| Compound | Log D7.4 | Plasma (μM) | Brain (nM) | Brain/Blood |
|---|---|---|---|---|
| 5 | −1.46 | 1.6 ± 0.2 | 73 ± 7 | 0.046 |
| 6 | 0.01 | 4.6 ± 1.3 | 39 ± 1 | 0.008 |
| 7 | 0.81 | 1.21 ± 0.05 | 18 ± 1 | 0.015 |
| 8 | 2.65 | 0.49 ± 0.025 | 9 ± 1 | 0.018 |
| 36 | −2.36 | 1.6 ± 0.2 | 39 ± 2 | 0.024 |
3. Discussion
Initially, the goal of this research was to design prodrugs for selective nNOS inhibitors to allow for enhanced penetration into the brain. When it became apparent that the prodrug moieties selected were more stable than expected, the new goal was to determine if enhancing the lipophilicity and lowering the charge of the molecules would have a beneficial effect on BBB penetration. If so, other prodrug approaches could be considered. We were surprised to find that making these changes had no effect on BBB penetration.
Ideally, a prodrug designed to increase brain uptake should be stable in plasma and the liver, but become rapidly metabolized in the brain. In reality, this is very difficult to achieve, as there are few enzymes specific to the brain that could be used to convert a prodrug to a drug. Azides are stable in plasma, but the rate of reduction of 1 in brain appears to be slow or nonexistent. Although there are reports of in vivo azide reduction activating azide prodrugs, in our hands, there was no evidence that this occurred with 1, suggesting that, at best, azides can be used as a prodrug only in limited cases. If azide reduction is extremely sensitive to oxygen, this further limits its use as a CNS prodrug moiety, as the brain is well supplied with oxygenated blood.
Surprisingly, prodrug analogues of 5, namely 6-8, also exhibited little metabolism by plasma or microsomes. Despite the observation that 1 and 6-8 were not converted back to their parent compounds, it was important to determine what effect decreasing charge and increasing lipophilicity had on BBB penetration, the initial purpose for selecting those prodrug moieties.
It was anticipated that neutralization of the secondary amine of 5 to give an acetylated prodrug (6) would increase passive diffusion from the peritoneal cavity into the blood, leading to higher plasma levels. This appears to be the case. However, it was also anticipated that 6 would diffuse more readily across the BBB and that the brain concentration would be higher than that of 5. In fact, the brain concentration of 6 is lower than that of 5 and also of 36, whose Log D is much more negative. Even more surprisingly, increasing the lipophilicity of 5 further as methyl- and benzyl carbamates to give 7 and 8, respectively (see Table 1), leads to a further lowering of total brain concentration.
The simple hypothesis that neutralization of a secondary amine and enhancement of lipophilicity will increase BBB penetration is clearly not universal. There are more factors that must be considered when attempting to increase BBB penetration. From a molecular properties standpoint, the addition of lipophilic functionality, such as carbamates, adds molecular weight and hydrogen bond acceptors. The carbamates 7 and 8 also have additional rotatable bonds. Nonetheless, it was anticipated that the significant increase in Log D relative to 5 and 36 would overcome these problems. This did not occur.
An alternative explanation for these results is that the increase in the Log D may be responsible for producing undesirable results. For example, there could be increased non-specific binding to proteins and cellular contents.xx This would reduce the free concentration in plasma so that less compound is available to diffuse across the BBB. Additionally, an increase in the number of nitrogen or oxygen atoms and an increase in the molecular weight favor better binding to efflux pumps.xxi Given that similar results were obtained with the parent amine as with the amide and carbamate prodrug analogues, possibly the polarities of amide and carbamate groups are sufficiently great to offset the decrease in charge by acylation or carbamoylation.
4. Conclusions
In conclusion, two prodrug approaches were taken to enhance BBB penetration of amine-containing nNOS inhibitors. The use of an azido group (1) as a prodrug for the primary amino group of 2 was not effective because of the inability of a brain homogenate or of liver microsomes to reduce the azide to the amine. The poor brain uptake properties of nNOS inhibitor 5 were attributed to its basic secondary amino groups that are charged at physiological pH. It was thought that neutralization of one of the secondary amines would lead to an increase in brain penetration. Acetylated and carbamoylated prodrug analogues of 5 having increased lipophilicity and lower charge, surprisingly, caused a decrease in BBB penetration. These results suggest that late stage optimization of an amine-containing lead by conversion to an acetylated or carbamoylated prodrug may not necessarily result in increased BBB penetration.
5. Experimental section
5.1. General methods
Proton nuclear magnetic resonances (1H NMR) were recorded in deuterated solvents on a Mercury 400 (400 MHz) or a Varian Inova 500 (500 MHz) spectrometer. Chemical shifts are reported in parts per million (ppm, δ) relative to tetramethylsilane (δ 0.00). 1H NMR splitting patterns are designated as singlet (s), doublet (d), triplet (t), quartet (q). Splitting patterns that could not be interpreted or easily visualized were recorded as multiplet (m) or broad (br). Coupling constants are reported in Hertz (Hz). Proton-decoupled carbon (13C-NMR) spectra were recorded on a Mercury 400 (100 MHz) or a Varian Inova 500 (125 MHz) spectrometer and are reported in ppm using the solvent as an internal standard (CDCl3, δ 77.23). NMR spectra recorded in D2O were not normalized. In many cases, the presence of rotamers made the NMR spectra complex. In the case of two peaks that are clearly a pair of rotamers, but are too far apart for an average to accurately represent the spectrum, the pair is written enclosed in parentheses. Electrospray mass spectra (ESMS) were obtained using an LCQ-Advantage with methanol as the solvent in positive ion mode, unless otherwise stated. For most compounds, 1H and 13C NMR and ESMS data are presented.
All chemical reagents were purchased from Aldrich and were used without further purification unless stated otherwise. NADPH, calmodulin, and human ferrous hemoglobin were also obtained from Sigma-Aldrich. Tetrahydrobiopterin (H4B) was purchased from Alexis Biochemicals. HEPES, DTT, and some conventional organic solvents were purchased from Fisher Scientific.
Tetrahydrofuran (THF) was distilled from sodium and benzophenone prior to use. Methylene chloride (CH2Cl2) was distilled from calcium hydride prior to use, if dry solvent was required. Dimethylformamide (DMF) was purchased as an anhydrous solvent and used directly.
Purity of compounds and bioanalytical analyses (e.g. for microsome assay) were determined on a Dionex HPLC system (Dionex, Sunnyvale, CA) using a Phenomenex (Torrance, CA) Luna C18 column (250 × 2.0 mm; 5 μM) and guard column with a flow rate of 0.2 mL / min. All water used was Milli-Q water obtained using a Biocel A10 water purification system from Millipore Corporation (Bedford, MA). Solid phase extraction was carried out using Waters Oasis HLB or MCX 1cc cartridges or MCX micro-elution plates (Waters Chromatography, Milford, MA). Analysis of biological samples was carried out using an API 3000 liquid chromatography-tandem mass spectrometry system (Applied Biosystems, Foster City, CA) equipped with an Agilent 1100 series HPLC system (Agilent Technologies, Wilmington, DE). Sample concentration was performed in a Genevac EZ-2plus (Genevac Inc., Valley Cottage, NY). NADPH regeneration solutions and rat liver microsomes were purchased from Bectin-Dickinson.
5.2. tert-Butyl 3-((6-(benzyl(tert-butoxycarbonyl)amino)-4-methylpyridin-2-yl)methyl)-4-(2-hydroxyethoxy)-pyrrol-idine-1-carboxylate ((±)-16)
A solution of (±)-156 (220 mg, 0.41 mmol) in methanol (5 mL) was cooled to −78 °C. Ozone was bubbled through the solution for 1 h. NaBH4 (57 mg, 1.5 mmol) was added, and the mixture was allowed to warm to room temperature. The solution was poured into saturated NH4Cl and extracted with ethyl acetate (3 × 15 mL). The organic layers were combined, dried over anhydrous Na2SO4, and concentrated in vacuo. The crude product was purified using flash column chromatography (silica gel, ethyl acetate/hexanes, 1:1) to afford (±)-16 as an oil (133 mg, 0.246 mmol, 60%). 1H NMR (500 MHz, CDCl3) δ 7.34 (m, 1H), 7.24 (m, 5H), 6.72 (s, 1H), 5.14 (s, 2H), 3.69 – 3.43 (m, 5H), 3.26 – 3.11 (m, 3H), 2.97 (m, 1H), 2.72 (m, 1H), 2.56 (m, 2H), 2.30 (s, 3H), 1.46 (s, 9H), 1.42 (s, 9H); 13C NMR (125 MHz, CDCl3) δ 158.2, 155.0, 154.7, 154.2, 149.1, 139.9, 128.3, 127.3, 127.2, 126.8, 120.5, 118.0, 81.4, 79.5, 78.5, 70.6, 61.9, (51.1 + 50.7), 50.5, (49.6 + 49.1), (43.4 + 42.8), 34.6, 28.8, 28.4, 21.3; ESMS m/z = 542 (M + H)+.
5.3. tert-Butyl 3-((6-(tert-butoxycarbonylamino)-4-methyl-pyridin-2-yl)methyl)-4-(2-hydroxyethoxy)-pyrrolidine-1-carboxylate ((±)-17)
To a solution of (±)-16 (133 mg, 0.246 mmol) in ethanol (5 mL) was added Pd(OH)2/C (~10 mg). The mixture was stirred under a hydrogen atmosphere at 60 °C for 2 days. The mixture was filtered through Celite, and the solvent was removed in vacuo. The crude product was purified using flash column chromatography (silica gel, ethyl acetate/hexanes, 3:2) to afford (±)-17 as an oil (41 mg, 0.091 mmol, 37%). 1H NMR (500 MHz, CDCl3) δ 8.07 (m, 1H), 7.72 (s, 1H), 6.66 (m, 1H), 5.59 (br, 1H), 3.84 – 3.51 (m, 6H), 3.33 (m, 1H), 3.19 (m, 2H), 2.64 (m, 1H), 2.31 (m, 4H), 1.52 (s, 9H), 1.46 (m, 9H); 13C NMR (125 MHz, CDCl3) δ 158.2, 155.0, 154.8, 153.0, 152.2, 150.9, 119.0, 110.9, 81.0, 79.6, 78.2, 70.4, 61.0, (51.0 + 50.6), (49.7 + 49.3), (45.7 + 45.0), 34.2, 28.8, 28.5, 21.6; ESMS m/z = 452 (M + H)+.
5.4. tert-Butyl 3-(2-azidoethoxy)-4-((6-(tert-butoxy-carb-onylamino)-4-methylpyridin-2-yl)methyl)-pyrrol-idine-1-carboxylate ((±)-18)
To a solution of (±)-17 (41 mg, 0.091 mmol) in anhydrous THF (5 mL) were added PPh3 (26 mg, 0.1 mmol), DPPA (26 μL, 0.12 mmol) and DIAD (21 μL, 0.11 mmol). The mixture was stirred for 16 h. The solvent was removed in vacuo and the crude product was purified using flash column chromatography (silica gel, ethyl acetate/hexanes, 1:3) to afford (±)-18 as an oil (34 mg, 0.072 mmol, 79%). 1H NMR (500 MHz, CDCl3) δ 7.60 (m, 1H), 7.17 (s, 1H), 6.69 (m, 1H), 3.99 – 3.63 (m, 3H), 3.53 – 3.28 (m, 5H), 3.15 (m, 1H), 2.95 (m, 1H), 2.76 – 2.60 (m, 2H), 2.31 (m, 3H), 1.52 (s, 9H), 1.45 (s, 9H); 13C NMR (125 MHz, CDCl3) δ 158.4, 155.1, 152.7, 151.6, 150.2, 119.6, 110.4, (81.1 + 80.3), (79.6 + 79.2), 70.3, (68.6 + 68.4), 51.3, (50.9 + 50.4), (43.5 + 42.8), (34.9 + 34.7), (28.8 + 28.5), 22.2, 21.6; ESMS m/z = 477 (M + H)+.
5.5. tert-Butyl 3-(2-aminoethoxy)-4-((6-(tert-butoxy-carbonyl-amino)-4-methylpyridin-2-yl)methyl)-pyrrolidine-1-carboxylate ((±)-19)
To a solution of (±)-18 (14 mg, 0.03 mmol) in ethanol (5 mL) was added Pd/C (~10 mg). The mixture was stirred under a hydrogen atmosphere for 16 h. The mixture was filtered through Celite and the solvent was removed in vacuo. The crude product was purified using flash column chromatography (silica gel, ethyl acetate/methanol, 9:1) to afford (±)-19 as a colorless oil (11 mg, 0.025 mmol, 83%). 1H NMR (500 MHz, CDCl3) δ 7.55 (s, 1H), 7.20 (s, 1H), 6.58 (s, 1H), 3.73 (m, 1H), 3.58 – 3.20 (m, 6H), 3.08 (m, 1H), 2.82 (m, 2H), 2.61 (m, 1H), 2.46 (m, 1H), 2.22 (s, 3H), 1.45 (s, 9H), 1.39 (s, 9H); ESMS m/z = 451 (M + H)+.
5.6. 6-((4-(2-Azidoethoxy)pyrrolidin-3-yl)methyl)-4-methyl-pyridin-2-amine ((±)-1)
A solution of (±)-18 (19 mg, 0.04 mmol) in 4N HCl in dioxanes (3 mL) was stirred for 16 h. The solvent was removed under a stream of nitrogen and the residue was dissolved in water, washed with ethyl acetate and concentrated to give (±)-1 as a white dihydrochloride salt (7.3 mg, 0.02 mmol, 50%). 1H NMR (500 MHz, CDCl3) δ 6.55 (s, 2H), 4.00 (m, 1H), 3.62 (m, 2H), 3.50 (m, 1H), 3.43 (m, 1H), 3.34 (m, 2H), 3.17 (m, 1H), 3.05 (m, 1H), 2.84 (m, 2H), 2.68 (m, 1H), 2.20 (s, 3H); ESMS m/z = 277 (M + H)+. HRMS (ESI): m/z calcd for C13H21N6O (M + H)+ 277.1771; found 277.1774.
5.7. 6-((4-(2-Aminoethoxy)pyrrolidin-3-yl)methyl)-4-methyl-pyridin-2-amine ((±)-2)
A solution of (±)-19 (11 mg, 0.025 mmol) in 4N HCl in dioxanes (3 mL) was stirred for 16 h. The solvent was removed under a stream of nitrogen and the residue was dissolved in water, washed with ethyl acetate and concentrated to give (±)-2 as a white trihydrochloride salt (5.5 mg, 0.015 mmol, 60%). 1H NMR (500 MHz, CDCl3) δ 6.55 (s, 1H), 6.50 (s, 1H), 4.06 (m, 1H), 3.67 (m, 1H), 3.51 (m, 2H), 3.40 (m, 1H), 3.21 – 3.04 (m, 4H), 2.80 (m, 1H), 2.68 (m, 1H), 2.19 (s, 3H); ESMS m/z = 251 (M + H)+.
5.8. 1-((S)-1-{2-[2-aminoethyl]phenylamino}-5-nitroguanidinopentan-2-ylcarbamoyloxy)ethyl pivalate (3)
5.8.1. 1-Chloroethyl p-nitrophenyl carbonate (20)
To an ice-cold mixture of p-nitrophenol (100 mg, 0.72 mmol) and pyridine (57 mg, 0.72 mmol) in CHCl3 (5 mL) was added 1-chloroethyl chloroformate (113 mg, 0.79 mmol). The cooling bath was removed after 30 min, and the reaction mixture was stirred at room temperature for 18 h. After being washed successively with water, 0.5% aq. NaOH, and water, the chloroform layer was dried over Na2SO4 and evaporated to a viscous yellowish oil. After trituration with hexane, 20 was obtained as a white solid (151 mg, 78%); mp 71.0-71.7 °C. 1H NMR (500 MHz, CDCl3) δ 8.30 (d, J = 9.0 Hz, 2H), 7.42 (d, J = 8.5 Hz, 2H), 6.50 (d, J = 5.5 Hz, 1H), 1.92 (d, J = 5.5 Hz, 3H); 13C NMR (125 MHz, CDCl3) δ 155.2, 150.7, 145.9, 125.7, 121.9, 85.5, 25.3.
5.8.2. 1-(Trimethylacetoxy)ethyl p-nitrophenyl carbonate (21)
Mercuric trimethylacetate was prepared on a small scale as follows: A mixture of yellow mercuric oxide (449 mg, 2.07 mmol) and trimethylacetic acid (424 mg, 4.15 mmol) was heated at 85 °C in CCl4 overnight. After filtration and evaporation, a white solid was obtained (619 mg, 74%); mp 235.5-236.2 °C. A mixture of mercuric trimethylacetate (1.64 g, 4.07 mmol), 20 (1.00 g, 4.07 mmol), and trimethylacetic acid (13.5 g) was heated at 80 °C in an oil bath overnight. The reaction mixture was cooled down, dissolved in ether (50 mL), and filtered. The filtrate was washed several times with 1% NaHCO3 (30 mL) to remove the trimethylacetic acid completely. The organic layer was concentrated in vacuo, and the residue was purified by flash column chromatography (hexane/EtOAc = 7 : 1, Rf = 0.30) to afford 21 (1.33 g, 91%) as yellowish crystals; mp 53.9-54.3 °C. 1H NMR (500 MHz, CDCl3) δ 8.30 (d, J = 9.0 Hz, 2H), 7.41 (d, J = 9.5 Hz, 2H), 6.83 (q, J = 5.5 Hz, 1H), 1.63 (d, J = 5.5 Hz, 3H), 1.246 (s, 9H); 13C NMR (125 MHz, CDCl3) δ 176.6, 155.4, 150.7, 145.7, 125.5, 122.0, 92.7, 38.9, 27.0, 19.5.
5.8.3. [2-(2-Nitrophenyl)ethyl]carbamic acid tert-butyl ester (23)
To 2-nitrophenylacetonitrile (22, 2.25 g, 13.9 mmol) was added dropwise a BH3-THF solution (1.0M, 100 mL) at 0 °C, and the mixture was stirred at room temperature overnight under nitrogen. The reaction mixture was cooled down to 0 °C, and an ice-cold solution of 6N HCl (60 mL) was added carefully, giving a white precipate. After evaporation of the THF, the aqueous phase was washed with CH2Cl2, basified with 4N NaOH to pH = 10, and extracted twice with EtOAc. The organic phase was washed with brine and dried over Na2SO4. After evaporation, the residue was dried overnight to provide a brown oil (1.90 g, 11.4 mmol, 82%), which was dissolved in a mixture of 1,4-dioxane (20 mL) and 10% aq. NaHCO3 (5 mL). To this solution was added Boc2O (3.74 g, 17.2 mmol) in 1,4-dioxane (5 mL) dropwise at 0 °C. After being stirred for 24 h at room temperature, the reaction mixture was partitioned between EtOAc (30 mL) and water (30 mL). The organic layer was washed with brine, dried over Na2SO4, and concentrated. The residue was purified by flash column chromatography (hexane/EtOAc = 4 : 1, Rf = 0.35) to afford 23 (2.79 g, 92%) as a brown oil. 1H NMR (500 MHz, CDCl3) δ 7.86 (d, J = 7.5 Hz, 1H), 7.49 (t, J = 7.0 Hz, 1H), 7.34 (m, 2H), 4.93 (s, 1H), 3.40 (q, J = 6.5 Hz, 2H), 3.04 (t, J = 7.0 Hz, 2H), 1.36 (s, 9H); 13C NMR (125 MHz, CDCl3) δ 156.1, 149.7, 134.4, 133.3, 132.9, 127.8, 125.0, 79.4, 41.2, 29.0, 28.6; MS (ESI, CH3CN) [2M+H+] = 533.0.
5.8.4. [2-(2-Aminophenyl)ethyl]carbamic acid tert-butyl ester (24)
Compound 23 (769 mg, 2.89 mmol) was dissolved in a mixture of MeOH/H2O/AcOH (7:2:1, 20 mL) and subjected to catalytic hydrogenation on 10% Pd/C (80 mg) at 1 atm. After 2.5 h, the reaction mixture was filtered through Celite, and the filtrate was concentrated to dryness to afford an oily residue 24 (648 mg, 95%). Rf = 0.20 (hexane/EtOAc = 4 : 1); 1H NMR (500 MHz, CDCl3) δ 7.05 (t, J = 7.5 Hz, 1H), 6.99 (d, J = 7.0 Hz, 1H), 6.70 (t, J = 7.0 Hz, 1H), 6.67 (d, J = 8.0 Hz, 1H), 5.26 (s, 1H), 4.33 (s, 2H), 3.27 (dd, J = 8.0 Hz, J = 6.0 Hz, 2H), 2.70 (t, J = 7.0 Hz, 2H), 1.48 (s, 9H); 13C NMR (125 MHz, CDCl3) δ 156.8, 145.4, 130.4, 127.9, 123.3, 118.5, 115.9, 79.4, 40.3, 32.5, 28.7; MS (ESI, CH3CN) [M+H+] = 237.1.
5.8.5. (S)-tert-Butyl 2-(2-{9H-fluoren-9-ylmethylcarbamoyl}-5-nitroguanidinopentanamido)phenethylcarbamate (25)
To an ice-cold solution of Fmoc-Arg(NO2)-OH (168 mg, 0.38 mmol) and 24 (45 mg, 0.19 mmol) dissolved in a mixture of CH2Cl2 (4 mL) and aq. Na2CO3 (0.17M, 4 mL), was added a solution of TFFH (127 mg, 0.48 mmol) and HOAt (52 mg, 0.38 mmol) in CH2Cl2 (3 mL). The reaction mixture was stirred at room temperature for 3 days under nitrogen. An excess amount of CH2Cl2 (20 mL) was added. The organic layer was separated, washed with water (20 mL) and brine (20 mL) and dried over Na2SO4. The solution was concentrated in vacuo, and the residue was purified by flash column chromatography (hexane/EtOAc = 1 : 3, Rf = 0.25) to afford 25 (107 mg, 85%) as a white foam; mp 100.2-102.0 °C. 1H NMR (500 MHz, CDCl3) δ 8.90 (s, 1H), 8.74 (s, 1H), 7.92 (s, 1H), 7.72 (t, J = 6.0 Hz, 2H), 7.57 (d, J = 7.0 Hz, 2H), 7.31-7.37 (m, 2H), 7.24 (m, 3H), 7.08-7.13 (m, 2H), 6.70 (s, 1H), 5.28 (s, 1H), 4.64 (s, 1H), 4.39 (d, J = 6.0 Hz, 2H), 4.17 (m, 1H), 3.42 (s, 1H), 3.33 (s, 1H), 3.10 (m, 2H), 2.77 (s, 2H), 2.00 (m, 1H), 1.87 (s, 1H), 1.77 (s, 2H), 1.42 (s, 9H); 13C NMR (125 MHz, CDCl3) δ 171.5, 159.6, 157.4, 157.0, 143.9, 143.8, 141.5, 135.7, 130.4, 128.0, 127.8, 127.3, 125.3, 120.2, 80.6, 67.4, 60.7, 47.3, 41.5, 40.8, 32.9, 28.6, 21.3, 14.5; MS (ESI, CH3CN) [M+Na+] = 682.6.
5.8.6. (S)-tert-Butyl 2-(2-{9H-fluoren-9-ylmethylcarbamoyl}-5-nitroguanidinopentylamino)phenethylcarbamate (26)
Compound 25 (0.83 g, 1.25 mmol) was treated dropwise with a solution of 1.0 M BH3 (13 mL) in THF at −10 °C under argon. The reaction temperature was allowed to rise to 0 °C. After being stirred at 0 °C for 10 h, the residual BH3 was quenched by cautious addition of MeOH (30 mL) at 0 °C, and the mixture was stirred overnight at room temperature. The solution was evaporated under reduced pressure and treated three times with MeOH (50 mL), evaporating to dryness after each addition to remove boric acid as trimethyl borate. The residue was purified by flash column chromatography (hexane/EtOAc = 1 : 2, Rf = 0.25) to afford 26 (0.38 g, 46%) as an oily residue. 1H NMR (500 MHz, CDCl3) δ 8.77 (s, 1H), 7.75 (d, J = 7.5 Hz, 2H), 7.58 (d, J = 6.0 Hz, 2H), 7.38 (m, 2H), 7.27 (t, J = 7.5 Hz, 2H), 7.16 (t, J = 7.5 Hz, 1H), 7.00 (d, J = 7.0 Hz, 1H), 6.67 (t, J = 7.0 Hz, 1H), 6.60 (d, J = 8.0 Hz, 1H), 6.39 (d, J = 8.5 Hz, 1H), 5.23 (s, 1H), 4.93 (s, 1H), 4.37 (d, J = 6.5 Hz, 2H), 4.07 (s, 1H), 3.39 (m, 1H), 3.33 (m, 1H), 3.16-3.23 (m, 4H), 2.73 (t, J = 7.0 Hz, 2H), 1.85 (br s, 1H), 1.76 (m, 1H), 1.69 (m, 2H), 1.45 (s, 9H); 13C NMR (125 MHz, CDCl3) δ 171.6, 159.6, 157.5, 157.4, 146.4, 144.0, 141.5, 130.3, 128.4, 128.0, 127.3, 125.4, 122.6, 120.3, 117.1, 110.2, 80.3, 67.1, 60.7, 48.1, 47.4, 41.2, 40.1, 33.3, 28.7, 21.3, 14.5.
5.8.7. 1-((S)-1-{2-[2-(tert-Butoxycarbonylamino)ethyl]phenylamino}-5-nitroguanidinopentan-2-ylcarbamolyoxy)ethyl pivalate (27)
Piperidine (1 mL) was added to a solution of 26 (240 mg, 0.37 mmol) in DMF (4 mL), and the mixture was stirred at room temperature for 0.5 h (monitoring by TLC). The volatile components were removed under reduced pressure. The residue was dissolved in dry CH3CN (7 mL). To this solution was added successively DIEA (48 mg, 0.37 mmol) and 21 (115 mg, 0.37 mmol) dissolved in dry CH3CN (1 mL). The reaction mixture was stirred at room temperature overnight under nitrogen. The solution was evaporated under reduced pressure, and the residue was purified by flash column chromatography (hexane/EtOAc = 1 : 2, Rf = 0.25) to afford 27 (183 mg, 83%) as a white foam; mp 73.2-74.0 °C. 1H NMR (500 MHz, CDCl3) δ 8.66 (s, 1H), 7.11 (t, J = 7.5 Hz, 1H), 6.97 (d, J = 7.0 Hz, 1H), 6.75-6.82 (m, 1H), 6.62 (t, J = 7.0 Hz, 1H), 6.57 (d, J = 8.0 Hz, 1H), 6.39-6.48 (m, 1H), 5.28 (t, J = 6.5 Hz, 1H), 4.98 and 4.90 (2 × s, 1H), 4.06 (m, 1H), 3.26-3.40 (m, 4H), 3.15 (t, J = 6.0 Hz, 2H), 2.70 (s, 2H), 1.84 (s, 1H), 1.72 (s, 1H), 1.65 (s, 2H), 1.47 and 1.46 (2 × s, 9H), 1.39 (m, 3H), 1.15 and 1.13 (2 × s, 9H), diastereomers.
5.8.8. 1-((S)-1-{2-[2-aminoethyl]phenylamino}-5-nitroguanidinopentan-2-ylcarbamoyloxy)ethyl pivalate (3)
Compound 27 (27 mg, 0.05 mmol) was treated with trifluoroacetic acid/CH2Cl2 (1 mL/2 mL) at 0 °C under argon. The reaction temperature was maintained at 0 °C, and stirring continued for 20 min. Excess TFA and solvent were removed by evaporation in vacuo. The residue was repeatedly dissolved in CH2Cl2 (10 mL) and the solvents evaporated to remove traces of TFA. The residue was dissolved in a small amount of water, and the solution was washed with CH2Cl2 and lyophilized to give 3 (25 mg, 93%) as a white solid; mp 76.3-78.5 °C. TLC (CH2Cl2/MeOH/Et3N, 10:1:0.1) Rf = 0.30; 1H NMR (500 MHz, CD3OD) δ 7.15 (t, J = 7.0 Hz, 1H), 7.04 (d, J = 7.5 Hz, 1H), 6.78 (m, 1H), 6.67 (m, 1H), 3.86 (s, 1H), 3.28 (s, 2H), 3.15-3.24 (m, 5H), 2.87 (m, 2H), 1.77 (br s, 2H), 1.66 (br s, 1H), 1.52 (m, 1H), 1.47 and 1.43 (2 × d, J = 5.0 Hz, 3H), 1.18 and 1.17 (2 × s, 9H), diastereomers; HRMS (ESI): m/z calcd for C22H38N7O6 (M + H+) 496.2884, found 496.2882; Anal. Calcd for C22H37N7O6·2.5TFA·1.5H2O: C, 40.15, H, 5.30, N, 12.14; Found: C, 40.17, H, 5.30, N, 12.24.
5.9. tert-Butyl 3-((6-(benzyl(tert-butoxy-carbonyl)-amino)-4-methylpyridin-2-yl)methyl)-4-(2-(N-(3-fluorophenethyl)-acetamido)ethoxy)-pyrrolidine-1-carboxylate ((±)-29)
To a solution of (±)-28 (79 mg, 0.12 mmol) in methanol (5 mmol) was added acetic anhydride (13 μL, 0.14 mmol) and triethylamine (20 μL, 0.14 mmol). The mixture was stirred for 4 h. The solvent was removed in vacuo and the residue was dissolved in sat NaHCO3 and extracted with ethyl acetate (3 × 20 mL). The organic layers were combined, dried over anhydrous Na2SO4 and concentrated in vacuo. The crude product was purified using flash column chromatography (silica gel, ethyl acetate / hexanes, 4:1) to afford (±)-29 as a colorless oil (84 mg, 0.12 mmol, quant). 1H NMR (500 MHz, CDCl3) δ 7.41 (m, 1H), 7.23 (m, 6H), 6.98 – 6.86 (m, 3H), 6.60 (m, 1H), 5.15 (s, 2H), 3.57 (m, 4H), 3.39 (m, 4H), 3.15 (m, 2H), 3.03 (m, 1H), 2.83 (m, 3H), 2.69 – 2.50 (m, 2H), 2.28 (m, 3H), (2.11 + 1.94 + 1.91) (s, rotamers, 3H), 1.44 (m, 9H), 1.41 (s, 9H); 13C NMR (125 MHz, CDCl3) δ 171.1, 164.1, 162.2, 157.8, 155.0, 154.6, 154.2, 148.9, 142.1, 140.1, 130.6, 130.2, 128.3, 127.2, 127.1, 127.0, 126.8, 124.7, 120.1, 117.4, 115.9, 113.4, 81.5, 79.9, 79.6, 79.1, 61.7, 52.0, 50.7, 50.2, 49.4, 48.1, 46.5, 42.8, 35.2, 33.9, 28.8, 28.4, 22.1, 21.5, 21.3; ESMS m/z = 705 (M + H)+.
5.10. tert-Butyl 3-((6-(tert-butoxycarbonyl-amino)-4-methylpyridin-2-yl)methyl)-4-(2-(N-(3-fluorophenethyl)acet-amido)ethoxy)-pyrrolidine-1-carboxylate ((±)-30)
To a solution of (±)-29 (84 mg, 0.12 mmol) in ethanol (5 mL) was added Pd(OH)2/C (~10 mg). The mixture was stirred under a hydrogen atmosphere at 60 °C for 2 days. The mixture was filtered through Celite, and the solvent was removed in vacuo. The crude product was purified using flash column chromatography (silica gel, ethyl acetate/hexanes, 5:1) to afford (±)-30 as a colorless oil (55 mg, 0.09 mmol, 75%). 1H NMR (500 MHz, CDCl3) δ 7.59 (m, 1H), 7.43 (m, 1H), 7.25 (m, 1H), 7.00 – 6.88 (m, 3H), 6.58 (m, 1H), 3.76 – 3.24 (m, 10H), 3.08 (m, 1H), 2.85 (m, 3H), 2.67 – 2.48 (m, 2H), 2.27 (m, 3H), (2.16 + 1.96 + 1.93) (s, rotamers, 3H), 1.52 (s, 9H), 1.43 (m, 9H); ESMS m/z = 615 (M + H)+.
5.11. N-(2-(4-((6-Amino-4-methylpyridin-2-yl)-methyl)pyrrolidin-3-yloxy)ethyl)-N-(3-fluoro-phenethyl)acetamide ((±)-6)
A solution of (±)-30 (55 mg, 0.09 mmol) in 4N HCl in dioxanes (3 mL) was stirred for 16 h. The solvent was removed under a stream of nitrogen and the residue was dissolved in water, washed with ethyl acetate and concentrated to give (±)-6 as a white dihydrochloride salt (29 mg, 0.06 mmol, 67%). mp 59–61 °C. 1H NMR (500 MHz, D2O) δ 7.21 (m, 1H), 6.89 (m, 3H), (6.53 + 6.47) (s, rotamers, 1H), (6.41 + 6.34) (s, rotamers, 1H), 3.97 (m, 1H), 3.69 (m, 1H), 3,62 – 3,42 (m, 5H), 3.39 – 3.15 (m, 4H), 3.01 (m, 1H), 2.79 – 2.60 (m, 4H), (2.17 + 2.13) (s, rotamers, 3H), (2.02 + 1.71) (s, rotamers, 3H); ESMS m/z = 415 (M + H)+. HRMS (M + H)+ calcd for C23H32FN4O2 415.2504; found 415.2522.
5.12. tert-Butyl 3-((6-(tert-butoxycarbonyl-amino)-4-methylpyridin-2-yl)methyl)-4-(2-(3-fluoro-phenethylamino)-ethoxy)pyrrolidine-1-carboxylate ((±)-31)
To a solution of (±)-28 (199 mg, 0.3 mmol) in ethanol (5 mL) was added Pd(OH)2/C (~10 mg). The mixture was stirred under a hydrogen atmosphere at 60 °C for 2 days. The mixture was filtered through Celite, and the solvent was removed in vacuo. A mixture of (±)-31 and (±)-33 were formed. The crude products were purified using flash column chromatography (silica gel, ethyl acetate / methanol, 1:9) to afford (±)-31 (61 mg, 0.11 mmol, 37 %) and (±)-33 (42 mg, 0.09 mmol, 30 %) as white solids. (±)-31 1H NMR (500 MHz, CDCl3) δ 7.60 (d, J = 10 Hz, 1H), 7.28 – 7.18 (m, 2H), 6.90 (m, 3H), 6.58 (s, 1H), 3.67 (m, 2H), 3.46 (m, 2H), 3.34 (m, 1H), 3.24 (dd, J = 4, 12 Hz, 1H), 3.08 (m, 1H), 2.95 – 2.73 (m, 6H), 2.57 (m, 2H), 2.47 (m, 1H), 2.30 (s, rotamers, 3H), 1.52 (s, 9H), 1.45 (s, 9H); 13C NMR (125 MHz, CDCl3) δ 164.1, 162.1, 158.4, 154.9, 152.9, 151.9, 150.0, 142.7, 130.1, 124.6, 119.0, 115.7, 113.2, 110.3, 80.8, 79.5, 78.6, 68.8, 50.9, 50.5, (49.5 + 49.2), (44.1 + 43.3), 36.3, 29.0, 28.8, 28.3, 21.5; ESMS m/z = 573 (M + H)+.
5.13. tert-Butyl 3-((6-(tert-butoxy-carbonyl-amino)-4-methylpyridin-2-yl)methyl)-4-(2-((3-fluorophenethyl)-(methoxy-carbonyl)amino)ethoxy)pyrrolidine-1-carboxylate ((±)-32)
To a solution of (±)-31 (61 mg, 0.11 mmol) in CH2Cl2 (5 mL) were added methyl chloroformate (10 μL, 0.12 mmol) and TEA (16 μL, 0.11 mmol). The mixture was stirred for 4 h. The solvent was removed in vacuo, and the residue was dissolved in sat NaHCO3 and extracted with ethyl acetate (3 × 20 mL). The organic layers were combined, dried over anhydrous Na2SO4 and concentrated in vacuo. The crude product was purified using flash column chromatography (silica gel, ethyl acetate / hexanes, 1:1) to afford (±)-32 as a colorless oil (55 mg, 0.087 mmol, 91%). 1H NMR (500 MHz, CDCl3) δ 7.60 (m, 1H), 7.28 (m, 2H), 6.91 (m, 3H), 6.57 (s, 1H), 3.70 (m, 4H), 3.59 – 3.25 (m, 8H), 3.10 (m, 1H), 2.84 (m, 3H), 2.60 (m, 3H), 2.28 (m, 3H), 1.52 (s, 9H), 1.44 (m, 9H); 13C NMR (125 MHz, CDCl3) δ 164.1, 162.2, 158.4, (157.0 + 156.8), (155.0 + 154.8), (152.7 + 151.7), 150.1, 141.8, 130.1, 124.7, 119.3, 115.9, 113.5, 110.5, 81.0, 79.9, 79.5, 68.3, 60.6, 52.8, 50.8, 50.4, 49.5, 49.1, 48.4, 47.9, 43.7, 35.2, 28.9, 28.4, 21.5; ESMS m/z = 631 (M + H)+.
5.14. tert-Butyl 3-((6-amino-4-methylpyridin-2-yl)-methyl)-4-(2-((benzyloxycarbonyl)-(3-fluoro-phenethyl)amino)ethoxy)-pyrrolidine-1-carboxylate ((±)-34)
To a solution of (±)-33 (42 mg, 0.09 mmol) in methanol (3 mL) was added benzyl chloroformate (20 μL, 0.1 mmol). The mixture was stirred for 4 h. The solvent was removed in vacuo, and the residue was dissolved in sat NaHCO3 and extracted with ethyl acetate (3 × 20 mL). The organic layers were combined, dried over anhydrous Na2SO4 and concentrated in vacuo. The crude product was purified using flash column chromatography (silica gel, ethyl acetate/methanol, 9:1) to afford (±)-34 (45 mg, 0.075 mmol, 83%) as a white solid. 1H NMR (500 MHz, CDCl3) δ 7.34 (m, 5H), 7.21 (m, 1H), 6.88 (m, 3H), 6.25 (m, 1H), 6.14 (m, 1H), 5.13 (m, 2H), 4.33 (m, 2H), 3.78 – 3.25 (m, 10H), 3.07 (m, 1H), 2.90 – 2.75 (m, 3H), 2.57 (m, 2H), 2.15 (m, 3H), 1.43 (m, 9H); ESMS m/z = 507 (M + H)+.
5.15. Methyl 2-(4-((6-amino-4-methylpyridin-2-yl)-methyl)pyrrolidin-3-yloxy)ethyl(3-fluoro-phenethyl)carbamate ((±)-7)
A solution of (±)-32 (55 mg, 0.087 mmol) in 4N HCl in dioxanes (3 mL) was stirred for 16 h. The solvent was removed under a stream of nitrogen and the residue was dissolved in water, washed with ethyl acetate and concentrated to give (±)-7 as a greasy colorless solid (8.4 mg, 0.02 mmol, 23%). 1H NMR (500 MHz, D2O) δ 7.16 (q, J = 6 Hz, 1H), 6.83 (m, 3H), 6.48 (s, 1H), 6.33 (s, 1H), 3.91 (m, 1H), 3.66 (m, 1H), 3.58 (s, 1H), 3.52 – 3.40 (m, 4H), 3.33 – 3.13 (m, 7H), 2.99 (m, 1H), 2.70 – 2.63 (m, 4H), 2.12 (s, 3H); ESMS m/z = 431 (M + H)+. HRMS (ESI): m/z calcd for C23H32FN4O3 (M + H)+ 431.2453; found 431.2460.
5.16. Benzyl 2-(4-((6-amino-4-methylpyridin-2-yl)-methyl)pyrrolidin-3-yloxy)ethyl(3-fluoro-phenethyl)carbamate ((±)-8)
A solution of (±)-34 (45 mg, 0.075 mmol) in 4N HCl in dioxanes (3 mL) was stirred for 16 h. The solvent was removed under a stream of nitrogen, and the residue was dissolved in methanol, which was then removed in vacuo. Anhydrous diethyl ether was added, causing a white precipitate to form. The ether was decanted, and the precipitate was dried to give (±)-8 as a greasy colorless solid (18 mg, 0.031 mmol, 42%). HPLC and LCMS revealed that (±)-8 was contaminated with (±)-5 (~10%). It is unclear whether this was caused by loss of the CBZ group during deprotection, or whether it is from an intermediate being carried through. 1H NMR (500 MHz, CD3OD) δ 7.35 (m, 6H), 6.97 (m, 3H), 6.67 (s, 1H), 6.50 (m, 1H), 5.08 (m, 2H), 4.21 (m, 1H), 3.99 (m, 1H), 3.75 – 3.23 (m, 9H), 3.23 (m, 1H), 2.88 (m, 2H), 2.78 (m, 2H), 2.32 (s, 3H); ESMS m/z = 507 (M + H)+. HRMS (ESI): m/z calcd for C29H35FN4O3 (M + H)+ 507.2766, found 507.2768.
5.17. HPLC analysis
See Supporting Information for chromatograms.
5.18. Determination of metabolism of 1 and 3 in plasma
Three mice were sacrificed under anesthesia by exsanguination and decapitation. The blood was collected in a pre-heparinized tube. The tubes were centrifuged to precipitate the blood cells, and the plasma supernatant was transferred to separate vials. To an aliquot of plasma (84 μL) was added NADPH regeneration solution A (5 μL), NADPH regeneration solution B (1 μL), and either 1 or 3 (10 μL of 200 μM stock). Samples were incubated at 37 °C and removed at various time points (t = 0, 10, 20, 40 min). To quench the sample, acetonitrile (400 μL) and 35 (10 μL of 200 μM stock) were added. The samples were centrifuged, and the supernatant was transferred to borosilicate tubes and concentrated to dryness using a Genevac. The residues were reconstituted in 2% formic acid / water (50 μL) and the mixtures were analyzed by HPLC monitoring at 310 nm for 1 and 35, and at 260 nm for 3. For each sample, the area under the peak corresponding to the compound of interest (3A, 3B, or 1) and to the internal standard (35) was integrated. The ratio of compound of interest to internal standard was measured and normalized by dividing by the ratio at t = 0 min.
5.19. Determination of metabolism of 1 and 3 in brain homogenate
Three fresh mice brains were homogenized, each in PBS (phosphate buffered saline, pH 7.4, 1 mL per brain) with NADPH regeneration buffer A (50 μL) and NADPH regeneration buffer B (10 μL). The homogenates were combined to form one stock. To an aliquot of homogenate (190 μL) was added either 1 or 3 (10 μL of 200 μM stock). The samples were incubated at 37 °C for varying lengths of time (0, 10, 20 and 40 min.) At each time point, a sample was removed from the water bath and heated to 95 °C for 1 min. A mixture of 2% formic acid in water (500 μL) was added to each sample, followed by 35 (20 μL of 100 μM stock). The 1 samples were loaded onto 1cc Oasis MCX SPE columns. The columns were washed with 2% formic acid in water (1 mL), and with 80% acetonitrile, 2% formic acid in water (1 mL), and the compounds were eluted with 5% NH4OH in methanol (2 mL). The eluents were concentrated to dryness and reconstituted in 2% formic acid (50 μL). The 3 samples were loaded onto 1cc Oasis HLB SPE columns. The columns were washed with 2% formic acid in water (1 mL), and the compounds were eluted with 80% acetonitrile, 2% formic acid in water (2 mL). The eluents were concentrated to dryness and reconstituted in 2% formic acid (50 μL). The mixtures were analyzed by HPLC monitoring at 310 nm for 1 and 35, and at 260 nm for 3. For each sample, the area under the peak corresponding to the compound of interest (3A, 3B, or 1) and to the internal standard (35) was integrated. The ratio of compound of interest to internal standard was measured and normalized by dividing by the ratio at t = 0 min.
5.20. Standard microsome assay
To PBS (257 μL) was added NADPH regeneration buffer A (15 μL) and NADPH regeneration buffer B (3 μL), and the compound of interest, e.g. minaprine (10 μL of 300 μM stock). The tubes were vortexed and equilibrated at 37 °C. Rat liver microsomes (15 μL) were added, and the samples were incubated at 37 °C for varying lengths of time (0, 10, 20, 40 min.). To quench the reaction, acetonitrile (500 μL) was added, and the tubes were chilled to 0 °C to precipitate out the proteins. The samples were centrifuged (14 krpm, 10 min), and the supernatants were transferred to separate tubes. The samples were concentrated to dryness and reconstituted in 2% formic acid (50 μL). The mixtures were analyzed by HPLC. Peak integrals were normalized by dividing by the area for the peak at t = 0 min.
5.21. Anaerobic microsome assay for azide metabolism
Nitrogen gas was bubbled through PBS (2.35 mL) for 15 min to deoxygenate it. To the buffer was added NADPH regeneration buffer A (125 μL) and NADPH regeneration buffer B (25 μL). To 2 mL vials with PTFE faced rubber septa were added the deoxygenated PBS mixture (240 μL) and the azide (30 μL of 100 μM stock). The vials were sealed, and the volume above the solution in the vial was purged with nitrogen. A balloon was used to maintain a nitrogen atmosphere inside the vial. The vials were equilibrated in a water bath at 37 °C. Microsomes (30 μL) were added through the rubber septum, and the mixtures were incubated at 37 °C for various lengths of time (0, 10, 20 and 40 minutes). Acetonitrile (600 μL) was added to quench the reaction. The mixtures were transferred to centrifuge tubes and cooled to 0 °C to precipitate the proteins. The samples were centrifuged at 14 krpm for 10 minutes. The supernatants were concentrated to dryness and the residues were reconstituted in 2% formic acid (50 μL) and analyzed by HPLC. Peak integrals were normalized by dividing by the area for the peak at t = 0 min.
5.22. Preparation of plasma standard curve
Samples were prepared to obtain final concentrations in μg/mL. A typical standard curve contained the concentrations 0.01, 0.05, 0.1, 0.5 and 1.0 μg/mL, but additional points were measured as needed. For example, to prepare a sample of 0.01 μg/mL of 5 in plasma, 5 (13.45 μL of 1 μM stock) was added to blank plasma (487 μL). The molecular weight of 5 is 372; therefore, 1 μg = 0.00269 μmol, and 1 μg/mL = 2.69 μM. An aliquot of 13.45 μL in 500 μL of 1 μM stock = 0.0269 μM = 0.01 μg/mL.
To an aliquot of the sample (100 μL) was added 35 (10 μL of 10 μM stock). The mixture was diluted with 2% acetic acid (500 μL) and loaded onto a preconditioned Oasis MCX micro-elution plate. The well was washed with 2% formic acid (500 μL), and methanol (500 μL), and the compound was eluted with 5% NH4OH in methanol (2 × 400 μL). The solvent was removed under a stream of nitrogen and the residue was reconstituted in LCMS/MS mobile phase (200 μL, see below for constitution). An aliquot (20 μL) was analyzed by LCMS. Standards were run in triplicate.
5.23. Preparation of brain standard curve
To a homogenizer was added 2% formic acid in water/acetonitrile (2:1, 700 μL) and 35 (10 μL of 100 μM stock). The compound of interest was added to obtain a final concentration in μg/mL based on a total volume of 1 mL. A typical standard curve would contain the concentrations 0.001, 0.005, 0.01, 0.05 and 0.1 μg/mL, but additional measurements were made as needed. For example, to obtain a concentration of 0.005 μg/mL of 6, 12.08 μL of 1 μM stock was added. To the solution was added a mouse brain, a rat pup brain, or a piece of pig brain weighing between 300 and 500 mg. The brain was homogenized and transferred to a centrifuge tube. The homogenizer was washed with 2% formic acid in water/acetonitrile (2:1, 300 μL), which was also added to the centrifuge tube. The samples were centrifuged (10 krpm, 12 min), and the supernatant was transferred to a separate tube. An aliquot (400 μL) was loaded onto an Oasis MCX micro-elution plate. The well was washed with 2% formic acid (500 μL) and methanol (500 μL), and the compound was eluted with 5% NH4OH in methanol (2 × 400 μL). The solvent was removed under a stream of nitrogen, and the residue was reconstituted in the LCMS/MS mobile phase (200 μL). An aliquot (20 μL) was analyzed by LCMS. Standards were run in triplicate.
5.24. Administration of compounds to mice
Compounds were diluted in PBS to form a 1 mM solution. Mice were weighed and then given the compound (100 μL per 10 g) via intraperitoneal injection. Three minutes before the desired time of sacrifice, the mouse was injected with pentobarbital (100 μL of a 50 mg/mL solution in PBS). Once the animal was no longer responsive, its thoracic cavity was opened, and blood was removed from the right ventricle of the heart using a syringe that had been treated with heparin and transferred to Microtainer PST pre-heparinized tubes. The tubes were centrifuged (5 min at 6 krpm), and the plasma supernatants were transferred to labeled tubes. The brain was perfused with PBS by inserting a needle through the left ventricle and allowing PBS under pressure to flow into it. The right atrium was cut to relieve the pressure. The mouse was decapitated, and the brain was removed. All samples were flash-frozen in liquid nitrogen and stored at −20 °C until analyzed.
5.25. Preparation of plasma samples for quantification
To an aliquot of the sample (100 μL) was added 35 (10 μL of 10 μM stock). The mixture was diluted with 2% acetic acid (500 μL) and loaded onto a preconditioned Oasis MCX micro-elution plate. The well was washed with 2% formic acid (500 μL) and methanol (500 μL), and the compound was eluted with 5% NH4OH in methanol (2 × 400 μL). The solvent was removed under a stream of nitrogen, and the residue was reconstituted in the LCMS/MS mobile phase (200 μL). An aliquot (20 μL) was analyzed by LCMS. Quantification of the compounds was carried out by calculating the ratio of the mass spectral peak intensity of the compound to the mass spectral peak intensity of the internal standard and comparing it to the standard curve.
The data were originally obtained in μg/mL, but were converted to μM for ease of comparison. The error bars on the charts represent the standard error mean. This was calculated by dividing the standard deviation of the data for each time point by the square root of the number of animals used for that point.
5.26. Preparation of brain samples for quantification
Brains were thawed and weighed. The brain was added to a homogenizer containing 2% formic acid/acetonitrile (2:1, 700 μL) and 35 (10 μL of 100 μM). The brain was homogenized and transferred to a centrifuge tube. The homogenizer was washed with 2% formic acid in water/acetonitrile (2:1, 300 μL), which was also added to the centrifuge tube. The samples were centrifuged (10 krpm, 12 min), and the supernatant was transferred to a separate tube. An aliquot (400 μL) was loaded onto an Oasis MCX micro-elution plate. The well was washed with 2% formic acid (500 μL) and methanol (500 μL), and the compound was eluted with 5% NH4OH in methanol (2 × 400 μL). The solvent was removed under a stream of nitrogen, and the residue was reconstituted in the LCMS/MS mobile phase (200 μL). An aliquot (20 μL) was analyzed by LCMS. Quantification of the compounds was carried out by calculating the ratio of the peak intensity of the compound to the peak intensity of the internal standard and comparing it to the standard curve. The final value in μg/mL was divided by the mass of the brain to obtain a concentration in μg of compound/g of brain. For display on the charts, this was converted to a concentration in μM by assuming that the density of the brain tissue is approximately 1 g/mL.
5.27. LCMS/MS Conditions
Samples containing 5, 6, and 35 were eluted isocratically from a Phenomenex MAX column (50 × 2.0 mm, Phenomenex, Torrance, CA) with a mobile phase consisting of water and methanol (80:20) containing 0.1% TFA at a flow rate of 250 μL/min. The tandem mass spectrometer was operated with its electrospray source in the positive ionization mode. The mass to charge ratios of the precursor-to-product ion reactions monitored were 373.3→123.1 for 5 and 35 and 415.3→208.2 for 6. The retention time of 5 was 2.38 min, that of 35 was 4.74 min, and that of 6 was 6.12 min.
Samples containing 36, 35, and 7 were eluted isocratically from a Phenomenex MAX column (50 × 2.0 mm, Phenomenex, Torrance, CA) with a mobile phase consisting of water and methanol (75:25) containing 0.1% TFA at a flow rate of 125 μL/min. The tandem mass spectrometer was operated with its electrospray source in the positive ionization mode. The mass to charge ratios of the precursor-to-product ion reactions monitored were 372.3→123.2 for 36, 415.3→208.2 for 7. The retention time of 36 was 2.46 min, that of 35 was 4.74 min, and that of 7 was 9.27 min.
Samples containing 8 and 7 were eluted isocratically from a Phenomenex MAX column (50 × 2.0 mm, Phenomenex, Torrance, CA) with a mobile phase consisting of water and methanol (70:30) containing 0.1% TFA at a flow rate of 125 μL/min. The tandem mass spectrometer was operated with its electrospray source in the positive ionization mode. The mass to charge ratios of the precursor-to-product ion reactions monitored were 507.3→91.1 for 8. The retention time of 7 was 3.58 min and that of 8 was 15.7 min.
Supplementary Material
Acknowledgments
The authors are grateful to the National Institutes of Health (GM49725) for financial support of this research. The authors wish to thank Dr. Michael Avram and Lynn Luong of the Northwestern Clinical Pharmacology Core Facility and the Pharmaceutical Chemistry Translational Resource of the Center for Drug Discovery and Chemical Biology for carrying out the SPE and LCMS experiments.
Footnotes
Supporting Information Available: Chromatographic conditions and chromatograms for various compounds; standard curves for quantification of 5 in plasma and brain; brain concentration of 5, 6, 7, 8; plasma concentration of 7 and 8. This material is available free of charge via the Internet at http://pubs.acs.org.
References
- i.IMS Retail Drug Monitor
- ii.Rubin LL, Staddon JM. Annu. Rev. Neurosci. 1999;22:11. doi: 10.1146/annurev.neuro.22.1.11. [DOI] [PubMed] [Google Scholar]
- iii.Ballabh P, Braun A, Nedergaard M. Neurobiol. Dis. 2004;16:1. doi: 10.1016/j.nbd.2003.12.016. [DOI] [PubMed] [Google Scholar]
- iv.Pardridge WM. Drug Discov. Today. 2001;6:1. doi: 10.1016/s1359-6446(00)01583-x. [DOI] [PubMed] [Google Scholar]
- v.(a) Doan KMM, Humphreys JE, Webster LO, Wring SA, Shampine LJ, Serabjit-Singh CJ, Adkison KK, Polli JW. J. Pharmacol. Exp. Ther. 2002;303:1029. doi: 10.1124/jpet.102.039255. [DOI] [PubMed] [Google Scholar]; (b) Pardridge WM. J. Neurochem. 1998;70:1781. doi: 10.1046/j.1471-4159.1998.70051781.x. [DOI] [PubMed] [Google Scholar]; (c) Zhao YH, Abraham MH, Ibrahim A, Fish PV, Cole S, Lewis ML, de Groot MJ, Reynolds DP. J. Chem. Inf. Model. 2007;47:170. doi: 10.1021/ci600312d. [DOI] [PubMed] [Google Scholar]; (d) Liu XR, Smith BJ, Chen CP, Callegari E, Becker SL, Chen X, Cianfrogna J, Doran AC, Doran SD, Gibbs JP, Hosea N, Liu JH, Nelson FR, Szewc MA, Van Deusen J. J. Pharmacol. Exp. Ther. 2005;313:1254. doi: 10.1124/jpet.104.079319. [DOI] [PubMed] [Google Scholar]
- vi.Lawton GR, Ralay Ranaivo H, Wing LK, Ji H, Xue F, Martásek P, Roman LJ, Watterson DM, Silverman RB. Bioorg. Med. Chem. 2009;17:2371. doi: 10.1016/j.bmc.2009.02.017. [DOI] [PMC free article] [PubMed] [Google Scholar]
- vii.(a) Kiick KL, Saxon E, Tirrell DA, Bertozzi CR. Proc. Natl. Acad. Sci. U.S.A. 2002;99:19. doi: 10.1073/pnas.012583299. [DOI] [PMC free article] [PubMed] [Google Scholar]; (b) Agard Nicholas J., Baskin Jeremy M., Prescher Jennifer A., Lo Anderson, Bertozzi Carolyn R. ACS Chem. Biol. 2006;1(10):644. doi: 10.1021/cb6003228. [DOI] [PubMed] [Google Scholar]; (c) Dieterich Daniela C., Lee Jennifer J., Link A. James, Graumann Johannes, Tirrell David A., Schuman Erin M. Nat. Protocols. 2007;2(3):532. doi: 10.1038/nprot.2007.52. [DOI] [PubMed] [Google Scholar]
- viii.Kotra LP, Manouilov KK, CrettonScott E, Sommadossi JP, Boudinot FD, Schinazi RF, Chu CK. J. Med. Chem. 1996;39:5202. doi: 10.1021/jm960339p. [DOI] [PubMed] [Google Scholar]
- ix.Kotra LP, Manouilov KK, Sommadossi JP, Boudinot DF, Schinazi RF, Chu CK. Abstr. Pap. Am. Chem. S. 1996;211:16. [Google Scholar]
- x.Koudriakova T, Manouilov KK, Shanmuganathan K, Kotra LP, Boudinot FD, CrettonScott E, Sommadossi JP, Schinazi RF, Chu CK. J. Med. Chem. 1996;39:4676. doi: 10.1021/jm960140c. [DOI] [PubMed] [Google Scholar]
- xi.Fayz S, Inaba T. Antimicrob. Agents Ch. 1998;42:1654. doi: 10.1128/aac.42.7.1654. [DOI] [PMC free article] [PubMed] [Google Scholar]
- xii.Inaba T, Fayz S. Clin. Pharmacol. Ther. 1997;61:58. [Google Scholar]
- xiii.Damen EWP, Nevalainen TJ, van den Bergh TJM, de Groot FMH, Scheeren HW. Bioorg. Med. Chem. 2002;10:71. doi: 10.1016/s0968-0896(01)00235-8. [DOI] [PubMed] [Google Scholar]
- xiv.Ji H, Stanton BZ, Igarashi J, Li H, Martásek P, Roman LJ, Poulos TL, Silverman RB. J. Am. Chem. Soc. 2008;130(12):3900. doi: 10.1021/ja0772041. [DOI] [PMC free article] [PubMed] [Google Scholar]
- xv.Hah J-M, Martásek P, Roman LJ, Silverman RB. J. Med. Chem. 2003;46:1661. doi: 10.1021/jm0202932. [DOI] [PubMed] [Google Scholar]
- xvi.Ji H, Li H, Martásek P, Roman LJ, Poulos TL, Silverman RB. J. Med. Chem. 2009;52(3):779. doi: 10.1021/jm801220a. [DOI] [PMC free article] [PubMed] [Google Scholar]
- xvii.Comer JEA. In: Methods and Principles in Medicinal Chemistry 18. Artursson P, Lennernas H, van de Waterbeemd H, editors. Wiley-VCH; Weinheim: 2003. p. 21. [Google Scholar]
- xviii.Cox C, Lectka T. J. Org. Chem. 1998;63(8):2426. doi: 10.1021/jo9800863. [DOI] [PubMed] [Google Scholar]
- xix.Alexander J, Cargill R, Michelson SR, Schwam H. J. Med. Chem. 1988;31:318. doi: 10.1021/jm00397a008. [DOI] [PubMed] [Google Scholar]
- xx.Liu XR, Chen CP. Curr. Opin. Drug Disc. 2005;8:505. [PubMed] [Google Scholar]
- xxi.Didziapetris R, Japertas P, Avdeef A, Petrauskas A. J. Drug Target. 2003;11:391. doi: 10.1080/10611860310001648248. [DOI] [PubMed] [Google Scholar]
Associated Data
This section collects any data citations, data availability statements, or supplementary materials included in this article.


