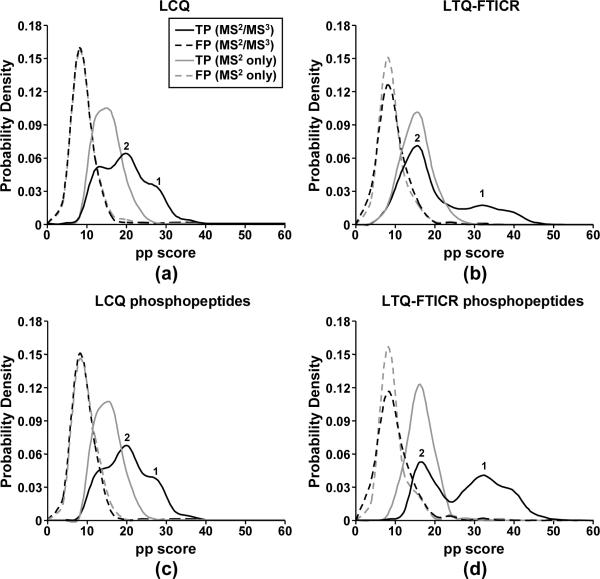
Figure 5.
Score distributions of TPs and FPs in the hierarchical MS2/MS3 searches and the searches of MS2 data only: (a) all the peptide matches returned for the LCQ data set, (b) all the peptide matches returned for the LTQ-FTICR data set, (c) phospopeptide matches for the LCQ data set, and (d) phosphopeptide matches for the LTQ-FTICR data set. The score distributions for TPs were split into two groups as labeled “1” and “2”.

