

Abstract
The purpose of this study was to investigate whether signaling through insulin, Fibroblast Growth Factor (FGF) receptors, and Mitogen-Activated Protein Kinase (MAPK) pathways protect retinal neurons against excitotoxicity and regulate the proliferation of Müller glia. We found that intraocular injections of insulin or FGF2 had variable effects upon the phosphorylation of ERK1/2, p38 MAPK and CREB, and the expression of immediate early genes, cFos and Egr1. Accumulations of pERK1/2, p38 MAPK, pCREB, cFos and Egr1 in response to insulin or FGF2 were confined to Müller glia, whereas retinal neurons did not appear to respond to growth factors. Unlike FGF2, insulin stimulated microglia-like cells to up-regulate the intermediate filament transitin and lysosomal membrane glycoprotein (LMG). The affects of insulin and FGF2 upon microglia-like cells and/or MAPK-signaling in Müller glia had profound effects upon numbers of dying neurons in response to excitotoxic damage. Although FGF2 significantly reduced numbers of dying neurons, insulin significantly increased numbers of dying neurons. In addition to neuroprotective affects, FGF2 also “primed” the Müller glia to proliferate following retinal damage, whereas insulin had no effect upon glial proliferation. Further, we found that FGF receptor isoform 1 (FGFR1) and FGFR3 are prominently expressed in the retina, whereas the insulin receptor and FGFR2 are not expressed, or are expressed at very low levels. We conclude that MAPK-signaling through FGF receptors stimulates Müller glia to become more neuroprotective and progenitor-like, whereas insulin acting on Müller and microglia-like cells through unidentified receptors had the opposite effect.
Introduction
Müller glia are the predominant type of support cell in retina, providing structural, nutritive and metabolic support to neurons; the Müller glia function much like astrocytes in the brain. There is a growing body of evidence that Müller glia may protect retinal neurons against injury. However, the mechanisms that regulate the ability of Müller glia to protect retinal neurons from injury remain uncertain. There is some evidence that pro-survival factors may act by influencing that activity of the Müller glia. For example, Ciliary Neuro Trophic factor (CNTF) is known to support the survival of different types of retinal neurons, but CNTF-mediated signaling (Jak-STAT) is active primarily in the Müller glia, not neurons (reviewed by (Frank and Greenberg 1996). Similarly, glial cell line-derived neurotrophic factor (GDNF) protects retinal neurons from damage by acting through Müller glia (Harada et al. 2003; Harada et al. 2002). Similar to GDNF and CNTF, FGF is known to protect retinal neurons from different types of damage and degeneration (reviewed by (Chaum 2003; Russell 2003). However, the signaling pathways and cellular targets of FGF-mediated neuronal survival in the mature retina remain uncertain. Accordingly, one purpose of this study was to identify the signaling pathways that are activated by growth factors, including insulin and FGF2, which are known to influence retinal neurons and glia.
The secreted factors that influence the proliferation of Müller glia are slowly being revealed. Close and colleagues demonstrated that light-damage stimulates Müller glia in the rodent retina to up-regulate the expression of the EGF receptor (Close et al. 2006). Consequently, Müller glia proliferate in response to intraocular injections of EGF. Similarly, Wnt-signaling has been shown to stimulate the proliferation of Müller glia in acutely damaged rodent retina (Osakada et al. 2007). In addition, Notch-signaling is increased in Müller glia-derived cells and may be required for re-entry into the cell cycle in the chicken retina (Hayes et al. 2007). We have recently demonstrated that the ERK1/2 MAPK pathway is activated in Müller glia in damaged retinas and that small molecule inhibitors of MEK and the FGF receptor suppress glial proliferation (Fischer et al. 2009). The proliferation of Müller glia is an integral step in the transdifferentiation of these cells during neuronal regeneration in acutely damaged retinas (reviewed by (Fischer 2005; Fischer and Reh 2003; Lamba et al. 2008; Ohta et al. 2008). Although many factors have been identified to stimulate the proliferation and transdifferentiation of Müller glia in acutely damaged retina, little is known about the factors in the damaged retina that enable transdifferentation and whether glial transdifferentiation can be stimulated without first damaging the retina.
There is one report of glial proliferation and transdifferentiation in the retina without first eliciting neuronal damage. In the absence of retinal damage, the combination of insulin and FGF2, but not either factor alone, is known to cause Müller glia to de-differentiate, proliferate, express transcription factors normally expressed by retinal progenitors, and produce a few new neurons (Fischer et al. 2002b). Intraocular injections of the combination of insulin and FGF2 induced a response in Müller glia similar to that observed in acutely damaged retinas (Fischer and Reh 2003). However, it remains unknown (i) whether insulin and FGF2 act directly on the Müller glia, (ii) what receptor types are involved, and (iii) what cell signaling pathways regulate the proliferation and transdifferentiation of Müller glia.
The MAPK-signaling pathway is known to be activated by tyrosine kinases such as the receptors for insulin and FGF. However, the activation of the MAPK pathway by insulin and FGF2 in undamaged retinas remains uncertain. Accordingly, in this study we; (i) identify the retinal cell types that respond to insulin and FGF2, (ii) investigate whether exogenous growth factors activate the ERK1/2 or p38 MAPK pathways, and (iii) whether immediate early genes that are known to be downstream of MAPK signaling are expressed by cells treated with insulin or FGF in the intact retina. In addition, we test whether these factors influence the survival of retinal neurons following an excitotoxic insult.
Methods and Materials
Animals
The use of animals was in accordance with the guidelines established by the National Institutes of Health and the Ohio State University. Newly hatched leghorn chickens (Gallus gallus domesticus) were obtained from the Department of Animal Sciences at the Ohio State University and kept on a cycle of 12 hours light, 12 hours dark (lights on at 7:00 am). Chicks were housed in a stainless steel brooder at about 28°C and received water and Purinatm chick starter ad libitum.
Intraocular injections
Chickens were anesthetized by inhalation of 2.5% isoflurane in oxygen at a flow rate of 1.5 l/min. Injections were made using a 25-μl Hamilton syringe and a 26-gauge needle with a beveled, curved tip. Penetration of the needle was consistently made through the upper eyelid into the dorsal quadrant of the vitreous chamber. In all experiments, 20 μl of vehicle containing the test compound was injected into the experimental (left) eye, and 20 μl of vehicle alone was injected into the control (right) eye. The vehicle was sterile saline (0.9% NaCl in dH20) containing bovine serum albumin, 50 μg/ml, as carrier. Test compounds included NMDA (N-methyl-D-aspartate; 1 μmol per dose; Sigma-Aldrich), recombinant human FGF2 (300 ng/dose; R&D Systems), purified bovine insulin (1 μg/dose; Sigma-Aldrich) and recombinant human EGF (300 ng/dose; R&D Systems).
We used 3 different injection paradigms: (1) Paradigm A – on post-hatch day 7 (P7) the left eye received a single injection of test compound and the right eye received vehicle. Retinas were harvested 3 hrs later. (2) Paradigm B – on P5 and P6 the left eye received an injection of test compound and the right eye received vehicle. Retinas were harvested 24 hrs later. (3) Paradigm C - on P5 and P6 the left eye received an injection of test compound and the right eye received vehicle. On P7, both eyes received an injection of 1 μmol NMDA. On P8, both eyes received an injection of 2 μg BrdU, and retinas were harvested 4 hrs later.
Reverse transcriptase PCR
mRNA was harvested from the retinas of P7 chicks by using the Rheas Kit (Quiagen) as per the manufacturer's instructions. Purified RNA was re-suspended in 100 μl RNAse free water and DNA was removed by using the DNAse I (Ambion). cDNA was synthesized from mRNA by using oligo dT primers and Superscripttm III First Strand Synthesis System (Invitrogen) according to the manufacturer's protocol. Control reactions were performed by excluding the reverse transcriptase to assess whether primers were amplifying genomic DNA.
PCR primers were designed by using the web-based program Primer3 from the Whitehead Institute for Biomedical Research (http://frodo.wi.mit.edu/). Primer sequences were as follows: insulin receptor – forward 5′ TTG CCA TAA TCA TTG CTG GA 3′ - reverse 5′ CCT CTG TTT CCA GAG GCT TG 3′; FGFR1 forward 5′ ATA ACA CCA AGC CGA ACC AG 3′ – reverse 5′ GGC AGC TCA TAC TCG GAG AC 3′; FGFR2 forward 5′ GCT GTC CAC AAG CTG ACA AA 3′ – reverse 5′ GGT GCA GTT GGC AGG TTT AT 3′; FGFR3 forward 5′ TTG GCC TTG CTA GAG ACG TT 3′ – reverse 5′ AGG GCA GTA CCC TCA GGT TT 3′. Predicted product sizes, in base pairs, were 1065 (insulin receptor), 970 (FGFR1), 948 (FGFR2), and 854 (FGFR3). PCR reactions were performed by using standard protocols, Platinumtm Taq (Invitrogen) or TITANIUMtm Taq (Clontech) and an Eppendorf thermal cycler. PCR products were run on an agarose gel to verify the predicted product sizes, TOPO-cloned (as described below) and sequenced to verify the identity of the products.
TOPO cloning
PCR products were run on a 1.2% agarose gel, extracted and purified by using Qiagen's Qiaex II kit according to the manufacturer's instructions. TOPO cloning was performed using Invitrogen's TOPO TAtm Cloning Kit and the pCR–II vector according to manufacturer's instructions.
In situ hybridization
Standard procedures were used for in situ hybridization as described elsewhere (Fischer et al. 2002a; Fischer et al. 2004a). In short, riboprobes were synthesized by using a kit provided by Roche and stored at -80°C until use. Ocular tissues from P7 eyes were dissected in RNase-free Hanks Balanced Salt Solution (HBSS), fixed for 2 hours at room temperature in 4% paraformaldehyde buffered in 0.1 M dibasic sodium phosphate, and embedded in OCT-compound (Tissue-Tek). Cryosections were processed for in situ hybridization with digoxigenin-labeled RNA probes as described previously (Fischer et al. 2002a; Fischer et al. 2004a). Hybridization was detected by using Fab fragments to dioxygenin that were conjugated to alkaline phosphatase (anti-DIG-AP; Roche) plus 10% normal goat serum, 10 mM levamisole, and 10 mM glycine in MABT (0.05 M maleic acid buffer, 0.1% Tween-20). Ntiro-blue tetrazolium (NBT) and 5-Bromo-4-Chloro-3′ Indolyphosphate p-Toluidine (BCIP) in 0.1 M NaCl, 0.1 M tris-HCl pH 9.5, 0.05 M MgCl2 and 0.01% Tween-20 were used to precipitate chromophore from the anti-DIG-AP.
Fixation, sectioning and immunocytochemistry
Enucleated eyes were hemisected equatorially and the gel vitreous removed from the posterior eye cup. Eye cups were fixed (4% paraformaldehyde plus 3% sucrose in 0.1 M phosphate buffer, pH 7.4, 30 min at 20°C), washed three times in PBS (phosphate-buffered saline; 0.05 M sodium phosphate, 195 mM NaCl, pH 7.4), cryoprotected in PBS plus 30% sucrose, immersed in embedding medium (OCT-compound; Tissue-Tek), and mounted onto sectioning blocks. Vertical sections, nominally 12 μm thick, were cut consistently from the posterior pole of the eye in the nasotemporal plane, and thaw-mounted onto SuperFrost Plustm slides (Fisher Scientific). Sections from control and treated eyes from the same individual were placed consecutively on each slide to ensure equal exposures to reagents. Sections were air-dried and stored at -20°C until use.
Sections were thawed, ringed with rubber cement, washed three times in PBS, covered with primary antibody solution (200 μl of antiserum diluted in PBS plus 5% normal goat serum, 0.2% Triton X-100, and 0.01% NaN3), and incubated for about 24 h at 20°C in a humidified chamber. The slides were washed three times in PBS, covered with secondary antibody solution, and incubated for at least 1 hour at 20°C in a humidified chamber. Finally, samples were washed three times in PBS, rubber cement removed from the slides, and coverglass mounted on 4:1 (v:v) glycerol to water.
Working dilutions and sources of antibodies used in this study included; goat anti-Egr1 was used at 1:1000 (AF2818; R&D Systems); rabbit pERK1/2 was used at 1:200 (137F5; Cell Signaling Technologies); rabbit anti-p38 MAPK was used at 1:80 (12F8; Cell Signaling Technologies); rabbit anti-pCREB was used at 1:600 (87G3; Cell Signaling Technologies); rabbit anti-cFos was used at 1:400 (K-25; Santa Cruz Immunochemicals); goat anti-Sox2 was used at 1:1000 (Y-17; Santa Cruz Immunochemicals); rabbit anti-Sox9 was used at 1:2000 (AB5535; Chemicon); rat anti-BrdU was used at 1:200 (OBT0030S; Serrotec); mouse anti-transitin was used at 1:600 (7B3A5; Dr. P. Henion, The Ohio State University); mouse anti-2M6 was used at 1:100 (Dr. P. Linser, University of Florida); rabbit anti-cleaved caspase 3 was used at 1:1500 (AF853; R&D Systems); mouse anti-lysosomal membrane glycoprotein (LMG) was used at 1:80 (LEP100; Developmetal Studies Hybridoma Bank, DSHB); and mouse anti-BrdU was used at 1:100 (G3B4; DSHB). None of the observed labeling appeared to be due to secondary antibody or fluorophore because sections labeled with secondary antibodies alone were devoid of fluorescence. Secondary antibodies included donkey-anti-goat-Alexa488, goat-anti-rabbit-Alexa488, goat-anti-mouse-Alexa488/568, rabbit anti-goat Alexa488 and goat-anti-mouse-IgM-Alexa568 (Invitrogen) diluted to 1:1000 in PBS plus 0.2% Triton X-100.
TUNEL
To identify dying cells that contained fragmented DNA we used the TUNEL method. We used an In Situ Cell Death Kit (TMR red; Roche Applied Science), as per the manufacturer's instructions.
Photography, measurements, cell counts, and statistical analyses
Photomicrographs were taken by using a Leica DM5000B microscope equipped with epifluorescence and a 12 megapixel Leica DC500 digital camera. Confocal microscopy was done by using a Zeiss LSM 510. Images were optimized for color, brightness and contrast, and double-labeled images overlaid by using Adobe™ Photoshop 6.0. Cell counts were made from at least 5 different animals, and means and standard deviations calculated on data sets. To avoid the possibility of region-specific differences within the retina, cell counts were consistently made from the same region of retina for each data set.
Immunofluorescence was quantified by using ImagePro 6.2. Identical illumination, microscope and camera settings were used to obtain images for quantification. Areas (800 × 200 pixels or 232 × 54 μm) were sampled from 5.4 MP digital images. The areas were randomly sampled over the IPL where the microglia reside. Measurements were made for regions containing pixels with intensity values (0 = black, 255 = saturated red or green) of >90 for transitin and >72 for LMG; thresholds that included labeling in the processes of microglia in control and treated samples. The total area was calculated for regions with pixel intensities above threshold and the density sum was calculated as the total of pixel values for all pixels within thresholded regions. Measurements were made for IPL regions sampled from at least 6 different retinas for each experimental condition.
Results
Distribution of insulin and FGF receptors expressed
The distribution and types of receptors for insulin and FGF's in the post-hatch chicken retina remain unknown. Thus, we sought to assess whether receptors to FGFs and insulin were expressed in the retina by using RT-PCR. We failed to detect mRNA for the insulin receptor in the retina, whereas high levels of expression were detected in the liver, a positive control (Fig. 1a). By comparison, FGFR1 and FGFR3 were readily amplified from cDNA obtained from the retina, whereas little FGFR2 was detected (Fig. 1a). All 3 isoforms of the FGF receptor were detected in cDNA from the liver (Fig. 1a). PCR products were TOPO-cloned and sequenced to verify the identity of the genes.
Figure 1.
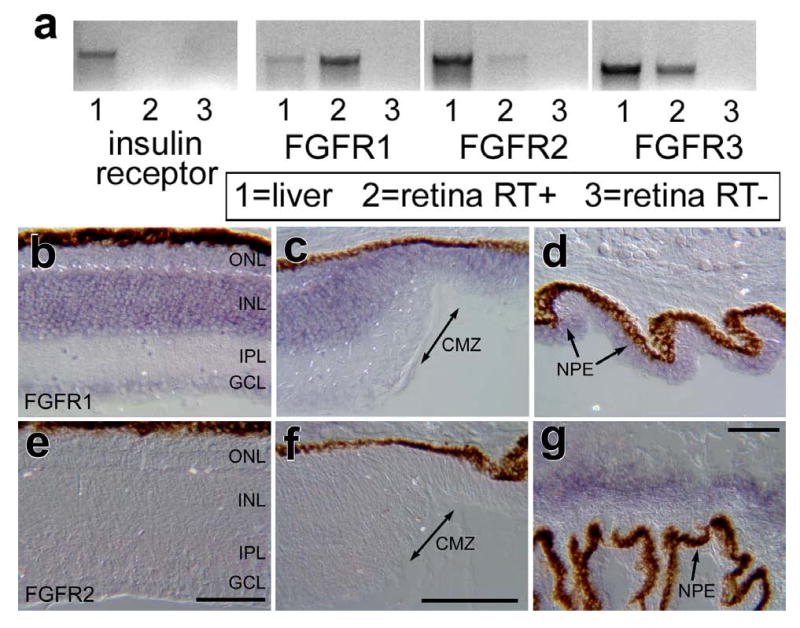
In the post-hatch chicken retina, FGFR1 and FGFR3 are highly expressed, FGFR2 is expressed at low levels, and receptors for insulin are not expressed. RT-PCR was used to detect mRNA in the post-hatch retina and liver (positive control; a). In situ hybridization was used to detected mRNA for FGFR1 (b-d) and FGFR2 (e-g) in vertical sections of the retina (b and e), CMZ (c and f), and ciliary body (d and g). The calibration bar (50 μm) in panel e applies to b and e, the bar in f applies to c and f, and the bar in g applies to d and g. Abbreviations: ONL – outer nuclear layer, INL – inner nuclear layer, IPL – inner plexiform layer, GCL – ganglion cell layer, CMZ – circumferential marginal zone.
Riboprobes were generated from the TOPO-cloned PCR products and in situ hybridization (ISH) performed to determine where the receptors were expressed within the retina. We detected widespread expression of FGFR1 in the retina which was prevalent in the INL (Fig. 1b). The ISH-labeling for FGFR1 extend across central and peripheral regions of the retina, through the circumferential marginal zone (CMZ) and into non-pigmented epithelium of the ciliary body (Figs. 1 b-d). Consistent with the findings from RT-PCR, we did not find significant ISH signal for FGFR2 in the retina or CMZ (Figs. 1e and f). However, significant ISH signal for FGFR2 was observed in the ciliary body underlying folds in the pars plicata (Fig. 1g).
Effects of FGF2 on MAPK-signaling in the retina
We next assessed whether intraocular injections of FGF2 influence MAPK signaling in the retina. Activation of receptor tyrosine kinases (RTKs), such as insulin and FGF receptors, can result in the phosphorylation of ERK1/2 (i.e. ligand• RTK• Ras• Raf• MEK1/2• ERK1/2). Assays for pERK1/2 (also known as p42/p44) are a read-out of active MAPK signaling. We found that monoclonal antibodies to pERK1/2 labeled a few amacrine cells in undamaged retinas (Fig. 2a), consistent with a previous report (Fischer et al. 2009). Three hours after a single injection of 300 ng FGF2, there was an increase in pERK1/2-immunoreactivity in presumptive Müller glia compared to saline-treated retinas (Figs. 2a and 2b). FGF2 did not appear to increase the labeling for pERK1/2 in amacrine cells, or other types of retinal neurons. In FGF2-treated retinas, elevated levels of pERK1/2 were observed in Müller glia in peripheral regions of the retina compared to the levels observed in the central regions (Figs. 2b and 2c). The pERK1/2-immunoreactivity was concentrated in the vitread endfeet in the nerve fiber layer (NFL) and somata of the Müller glia in the middle of the INL (Figs. 2b and 2c). By comparison, control retinas did not contain detectable levels of pERK1/2-immunoreactivity in the NFL or mid-INL (Fig. 2a). We found that all (n=423 cells) Sox2-positive Müller glia were immunoreactive for pERK1/2 (Figs. 2d-f).
Figure 2.
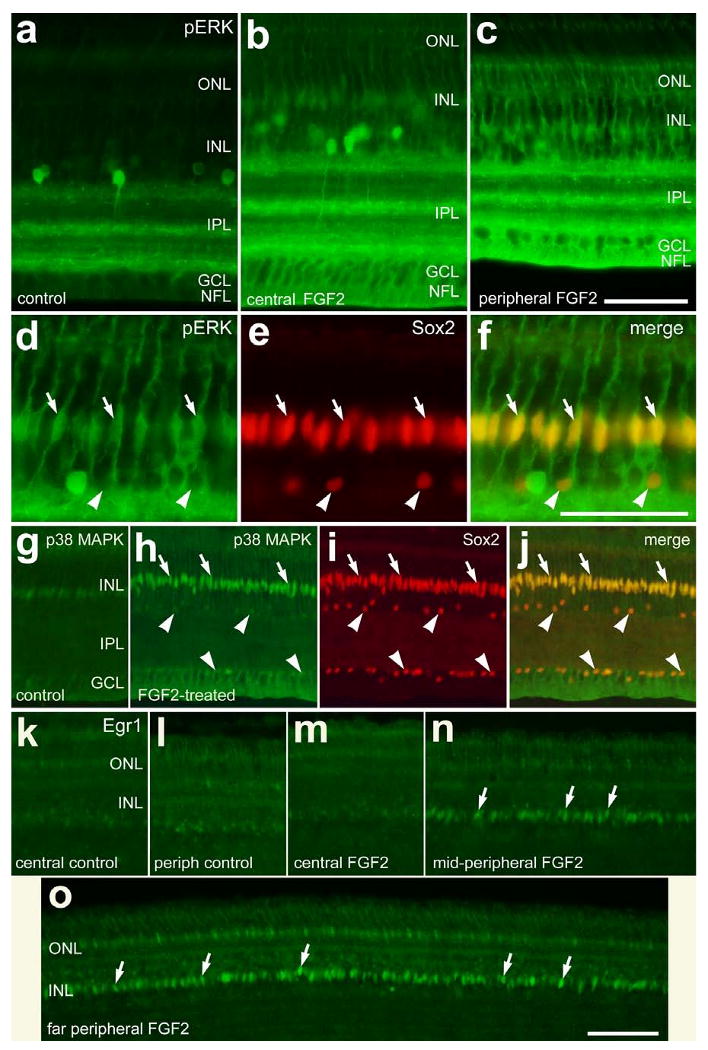
Short-term exposure to FGF2 stimulates the accumulation of pERK, p38 MAPK and Egr1 in Müller glia in peripheral regions of the retina. Vertical sections of the retina were labeled with antibodies to pERK (green; a-d and f), Sox2 (red; e, f, i and j), p38 MAPK (green; g, h and j) or Egr1 (k-o). Arrows indicate the nuclei of Müller glia that are labeled for pERK and Sox2 (d-f), p38 MAPK and Sox2 (h-j), or Egr1 (k and o). The arrow-heads indicate Sox2-positive nuclei of cholinergic amacrine cells in the INL and displaced to the GCL (d-f and h-j). The calibration bar (50 μm) in panel c applies to a-c, the bar in f applies to d-f, and the bar in o applies to g-o. Abbreviations: ONL – outer nuclear layer, INL – inner nuclear layer, IPL – inner plexiform layer, GCL – ganglion cell layer.
Another branch of the MAPK pathway involves MEKK1-4, MKK3/6 and p38 MAPK; the phosphorylation of p38 promotes the translocation from the cytoplasm to the nucleus where transcription is affected. In untreated retinas, we found low levels of p38-immunoreactivity in the nuclei of cells located near the middle of the INL (Fig. 2g), and in a few cells scattered across the IPL, GCL and NFL (shown in Figs. 6f-i). The p38-positive cells in proximal retinal layers were presumptive microglia-like cells that were weakly immunoreactive for transitin (see Fig. 5e for an example). Transitin is an intermediated filament that is known to be expressed by microglia-like cells in the post-hatch chicken retina (Fischer and Omar 2005). Three hours after treatment with FGF2, we found a dramatic increase in p38 MAPK-immunoreactivity in the nuclei of Sox2-positive Müller glia (Figs. 2h-j). In addition, short-term exposure to FGF2 increased p38-immunoreactivity in the vitread Müller glial endfeet that permeated the GCL and NFL (Figs. 2h-j). There was no apparent increase in p38 MAPK-immunoreactivity in microglia-like cells scattered across the IPL in FGF2-treated retinas (data not shown). Downstream of activated MAPK-signaling the expression of immediate early genes, such as cFos or Egr1, is often induced (Cahill et al. 1996). Although control retinas contain few Egr1-positive nuclei (Figs. 2k and 2l), Egr1 was present in the fusiform nuclei of Müller glia 3 hours after treatment with FGF2 (Figs. 2m-o). Egr1 was highly expressed by Müller glia in peripheral retinal regions, whereas the expression of Egr1 was low in the nuclei of Müller glia in central regions (Figs. 2m-o). We failed to detect the accumulation of cFos or pCREB in Müller glia or retinal neurons 3 hours after treatment with FGF2 (data not shown). Injections of vehicle had no effect upon the accumulation of pERK, pCREB, p38 MAPK, Egr1 or cFos in retinal cells compared to uninjected controls (data not shown).
Figure 6.
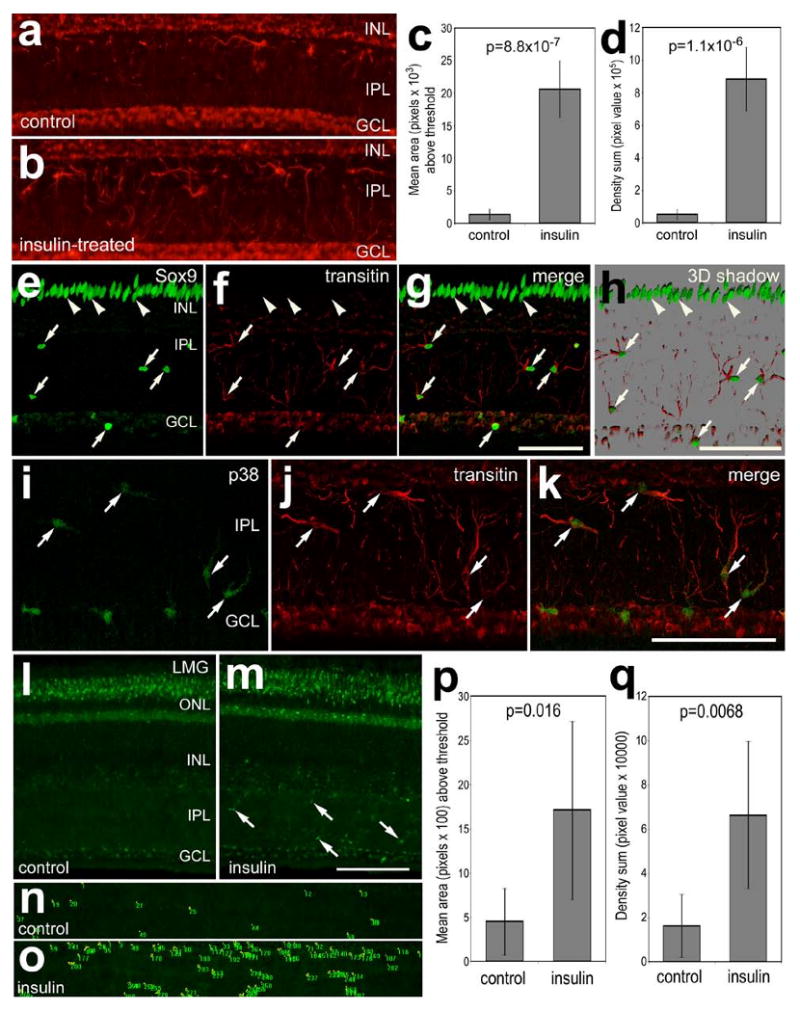
Consecutive daily injections of insulin stimulate cells in inner retinal layers to up-regulate transitin and lysosomal membrane glycoprotein. Retinas were obtained from eyes that received 2 consecutive daily intraocular injections of insulin or vehicle (control). Vertical sections of the retina were labeled with antibodies to transitin (red; a, b, f-h, j and k), Sox9 (green; e, g and h), p38 MAPK (green; i and k), and LMG (l-o). Photomicrographs were obtained using wide-field epifluorescence (a, b and l-o) or confocal microscopy (e-k). Confocal images are maximum intensity projections of 7 optical sections (0.9 μm in thickness), or rendered 3D shadow projection (h) reconstructed using Zen software (Zeiss). Arrows indicate microglia-like cells in the IPL or GCL, and arrow-heads indicate the nuclei of Müller glia. The calibration bar (50 μm) in panel g applies to e-g, the bar in h applies to a, b and h, the bar in k applies to i-k, and the bar in m applies to l and m. Histograms in panels c, d, p and q illustrate densitometric measurements from micrographs. Images were obtained using identical camera exposures and microscope illumination settings. As described in the Methods, ImagePro 6.2 was used to measure total area for pixel intensities >90 for transitin and >72 for LMG (0 = black, 255 = saturated red or green), and the density sum. The small green numbers and yellow outlines in panels n and o indicate the areas designed by ImagePro 6.2 to each object that met the threshold criteria. Means and standard deviations are displayed in histograms for total area (c and p), and density sum (d and q) for areas with pixels above threshold. Significance of difference (p-values) was determined by using a two-tailed, unpaired Student's t-test. Abbreviations: LMG – lysosomal membrane glycoprotein, ONL – outer nuclear layer, INL – inner nuclear layer, IPL – inner plexiform layer, GCL – ganglion cell layer.
Figure 5.
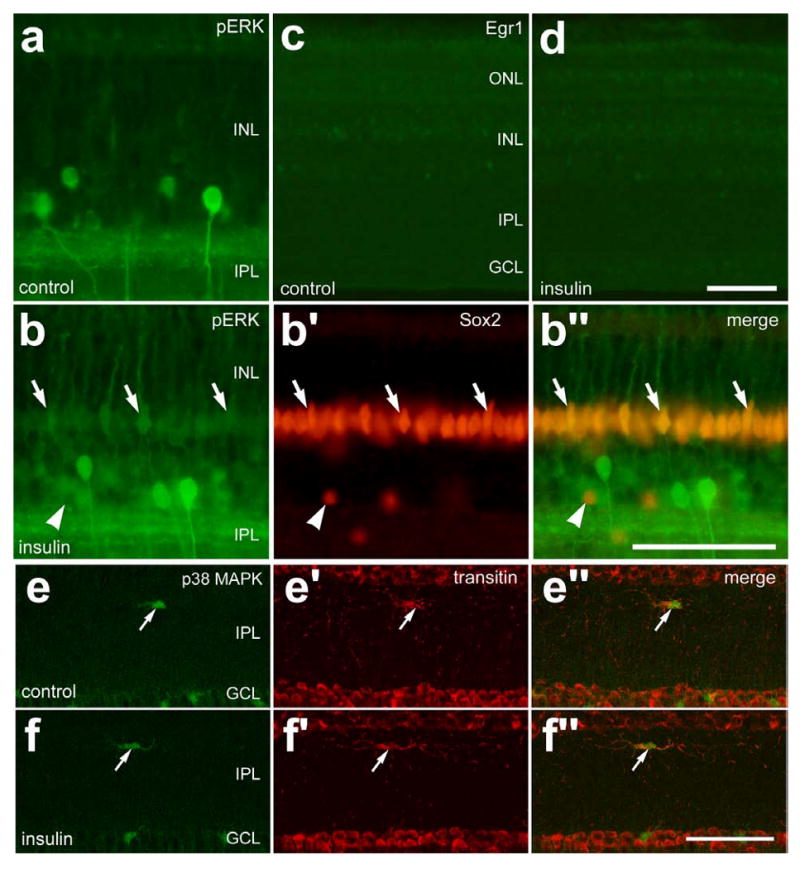
Short-term exposure to insulin stimulates the accumulation of pERK, but not Egr1 or p38, in retinal Müller glia, and microglia-like cells appear unaffected. One μg of insulin was injected into the vitreous chamber of P7 eyes and retinas were harvested 3 hrs later. Vertical sections of the retina were labeled with antibodies to pERK (green; a and b), Egr1 (c and d), Sox2 (red: b), p38 MAPK (green; e and f) and transitin (red; e and f). Images were obtained by using wide-field epifluorescence (a-d) and confocal microscopy (e and f). Arrows indicate Müller glia nuclei labeled for pERK and Sox2 (b) or microglia-like cells labeled for p38 MAPK and transitin (e and f). Arrow-heads indicate Sox2-positive nuclei of amacrine cells that are negative for pERK. The calibration bar (50 μm) in panel b″ applies to b-b″, the bar in d applies to c and d, and the bar in f applies to e and f. Abbreviations: ONL – outer nuclear layer, INL – inner nuclear layer, IPL – inner plexiform layer, GCL – ganglion cell layer.
We next tested whether two consecutive daily intraocular injections of FGF2 stimulated the accumulation of Egr1, cFos, pCREB and p38 MAPK in retinal cells (Fig. 3a). Twenty-four hours after the last injection of FGF2 we observed Egr1-immunoreactivity in fusiform nuclei in the mid-INL in peripheral, but not central, regions of the retina (Figs. 3b-d). In addition, we found that FGF2-treatment stimulated the accumulation of cFos and pCREB in fusiform nuclei located near the middle of the INL (Figs. 3e-j). Immunolabeling for cFos and pCREB was prevalent in fusiform nuclei in peripheral regions of the retina, whereas central regions of the retina contained fusiform nuclei with lower levels of immunolabeling. By comparison, we found p38-immunoreactivity in the fusiform nuclei in central and peripheral regions of the retina, whereas control retinas contained little immunoreactivity for p38 in the INL (Figs. 3l-n). The fusiform nuclei that were labeled for Egr1, cFos, pCREB and p38 were those of Müller glia that were co-labeled for Sox2, Sox9 or 2M6 (data not shown). Intraocular injections of FGF2 stimulated accumulations of Egr1, cFos, pCREB and p38 in Müller glia in peripheral regions of the retina even when injected at P21 (data not shown).
Figure 3.
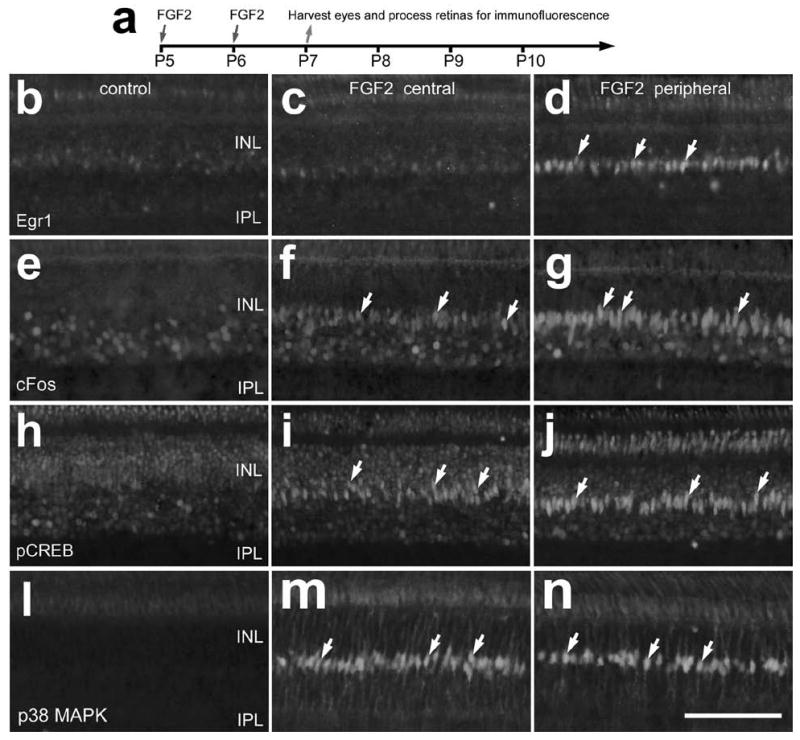
Consecutive daily injections of FGF2 stimulate the accumulation of Egr1, cFos, pCREB and p38 MAPK in the nuclei of Müller glia. Intraocular injections of vehicle or 300 ng of FGF2 were made at P5 and P6, and retinas were harvested at P7 (a). Vertical sections of central and peripheral retina were labeled with antibodies to Egr1 (b-d), cFos (e-g), pCREB (h-j), and p38 MAPK (l-n). Arrows indicate the nuclei of Müller glia that are immunoreactive for Egr1, cFos, pCREB or p38 MAPK. The calibration bar (50 μm) in panel n applies to panels b-n. Abbreviations: INL – inner nuclear layer, IPL – inner plexiform layer.
When retinal neurons were damaged by an excitotoxic dose of NMDA following 2 consecutive daily injections of FGF2 (Fig. 4a), we found that levels of cell death were significantly reduced. We used the TUNEL method to assay for fragmented DNA and identify the nuclei of dying cells in situ. FGF2 pre-treatment significantly reduced numbers of TUNEL-positive cells in both the proximal INL, in presumptive amacrine cells, and the distal INL, in presumptive bipolar cells (Figs. 4b-g). Numbers of dying cells were decreased by FGF2-pretreatment in both central and peripheral regions of the retina (Figs. 4b-g). There was a 63.9% decrease in cell death in central retina compared to 86.3% less death in peripheral regions of the retina. To determine whether FGF2-treatment somehow accelerated or delayed cell death we assayed for dying cells at different times after NMDA-treatment. We found that intraocular injections of FGF2 prior to NMDA-treatment significantly reduced numbers of TUNEL-positive cells in the INL and 4 and 72 hrs after treatment (data not shown). These findings suggest that FGF2-treatment prior to NMDA neither accelerated nor delayed cell death.
Figure 4.
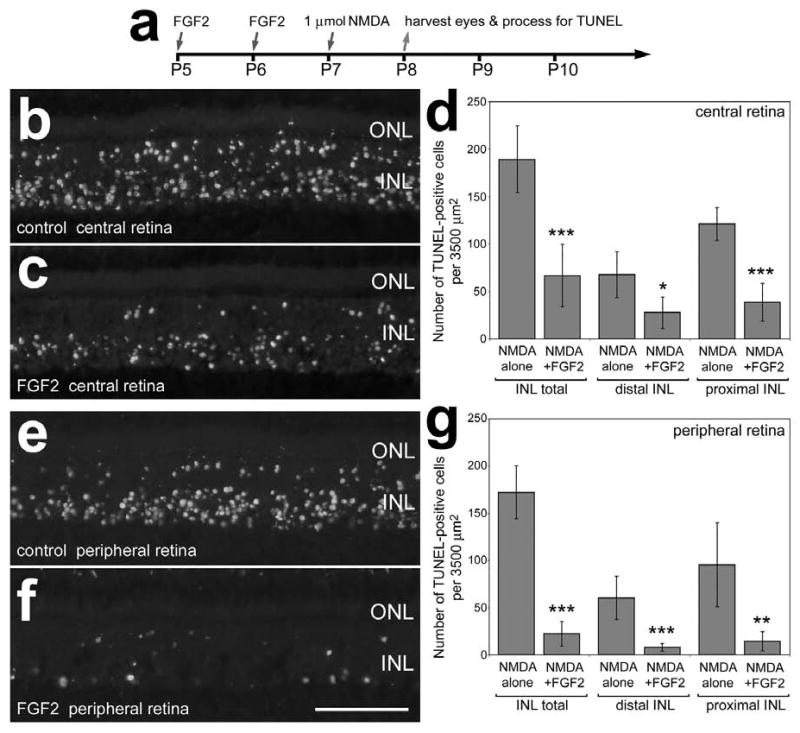
Intraocular injections of FGF2 prior to NMDA-induced retinal damage results in less cell death. Retinas were obtained from eyes that were injected with 300 ng FGF2 at P5 and P6, 1 μmol of NMDA at P7, and harvested 24 hours later at P8 (a). Vertical sections of central (b and c) and peripheral (e and f) regions of the retina were labeled using the TUNEL method. Panels d and g are histograms illustrating the means and standard deviations for numbers of TUNEL-positive cells in distal (presumptive bipolar and horizontal cells) and proximal (presumptive amacrine cells) in central (d) and peripheral (g) regions of the retina. Significance (*p<0.01, **p<.001, ***p<0.0001) of difference was determined by used a two-tailed student's t-test. The calibration bar (50 μm) in panel f applies to panels b, c, e and f. Abbreviations: ONL – outer nuclear layer, INL – inner nuclear layer.
Effects of insulin on MAPK-signaling in the retina
We next tested whether insulin influenced MAPK signaling in retinal cells. Three hours after a single intraocular injection of insulin, we observed few changes within the retina. Insulin-treatment resulted in modest increases in pERK1/2-immunoreactivity in Müller glia (Figs. 5a and 5b). We found that all (n=298) Sox2-expressing Müller glia contained detectable levels of immunoreactivity for pERK1/2 in retinas treated with insulin (Figs. 5a and 5b). In insulin-treated retinas, however, there were no detectable increases in Egr1 (Figs. 5c and 5d), cFos or pCREB (data not shown). Acute exposure to insulin did not stimulate Müller glia (not shown) or microglia-like cells to up-regulate p38 or transitin (Figs. 5e and 5f). Under normal conditions, microglia-like cells that reside within the IPL are immunoreactive for p38 MAPK (see Figs. 7f and 7g for examples).
Figure 7.
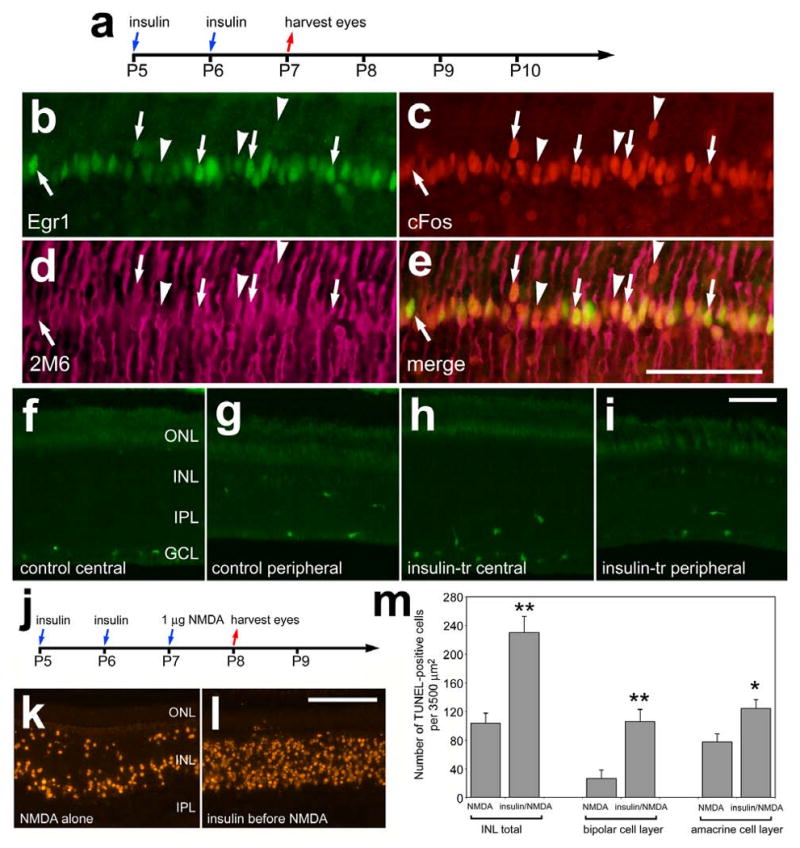
Consecutive daily injections of insulin stimulate the expression of cFos and Egr1, whereas p38 MAPK appear unaffected, in Müller glia and decreases neuronal survival following an excitotoxic insult. Retinas were obtained from eyes that received intraocular injections of 1 μg insulin at P5 and P6, and were harvested at P7 (a-i) or injected with 1 nmol NMDA at P7 and harvested at P8 (j-m). Vertical sections of the retina were labeled with antibodies to Egr1 (green; b and e), cFos (red; c and e), the glial marker 2M6 (magenta; d and e), and p38 MAPK (f-i). Arrows indicate Müller glia nuclei that are immunoreactive for Egr1 and cFos, and arrow-heads indicate Müller glia nuclei that are immunoreactive for cFos alone. Nuclei of cells that contained fragmented DNA were detected by using the TUNEL method (k and l). The histogram in panel m illustrates the mean and standard deviation of TUNEL-positive cells in the distal INL (presumptive horizontal and bipolar cells), proximal INL (presumptive amacrine cells), and total cells in the INL. Significance of difference (*p<0.01, **p<0.0001) was determined by using a two-tailed, unpaired Student's t-test. Abbreviations: ONL – outer nuclear layer, INL – inner nuclear layer, IPL – inner plexiform layer, GCL – ganglion cell layer.
Unlike the microglia-like cells in FGF2-treated retinas (data not shown), we found that insulin stimulated the cells that are scattered throughout the inner layers of the retina. Two consecutive daily injections of insulin resulted in an increase in filamentous processes that were scattered throughout the IPL; these processes were immunoreactive for transitin (Figs. 6a and 6b). Quantitative immunofluorescence indicated a significant increase in the area and intensity sum of transitin-labeling in the IPL of retinas treated with insulin compared to those treated with saline (Figs. 6c and 6d). The transitin-positive cells in the IPL expressed the transcription factors Sox9 (Figs. 6e-h), Sox2 (not shown), and p38 MAPK (Figs. 6i-k). The microglia-like cells in insulin-treated retinas appeared to be activated with increased immunoreactivity for lysosomal membrane glycoprotein (LMG) in the IPL (Figs. 6l and 6m). Measurements of area and pixel intensity indicate a significant increase in LMG-immunofluorescence in the IPL of insulin-treated retinas compared to saline-treated controls (Figs. 6n-q). LMG is known to be up-regulated by microglia in damaged retinas (Fischer et al., 1998). However, there was no evidence that insulin-treatment damaged the retina; we failed to find cells that were labeled for cleaved caspase 3 or TUNEL (not shown). There was not a significant increase in the number of microglia-like cells in insulin-treated retinas (data not shown).
We next tested whether two consecutive daily intraocular injections of insulin stimulated the accumulation of Egr1, cFos, pCREB or p38 MAPK in retinal cells. Twenty-four hours after the last injection of insulin (Fig. 7a), we detected cFos and Egr1 in the nuclei of 2M6-positive Müller glia (Figs. 7b-e). Unlike FGF2-treatment, cFos and Egr1 were expressed by Müller glia across central and peripheral regions of the retina in insulin-treated eyes. We failed to find significant increases in p38 MAPK- (Figs. 7f-i) or pCREB-immunoreactivity (data not shown) in retinas treated with insulin.
Interestingly, insulin-treatment before NMDA resulted in more than a 2-fold increase in cell death (Figs. 7j-m). In insulin-treated retinas, NMDA-induced cell death was increased nearly 3-fold (295.6%) in the distal INL, in presumptive bipolar and/or horizontal cells (Fig. 7m). By comparison, numbers of dying cells were increased by 60.8% in the proximal INL, in presumptive amacrine cells (Fig. 7m). Insulin-induced increases in cell death were similar in central and peripheral regions of the retina (data not shown).
Since insulin is soluble only at acidic pH, it is possible that the effects of insulin upon Müller and microglia-like cells and NMDA-induced cell death were mediated by transient shifts in pH. Thus, we assessed whether intraocular injections pH-neutral insulin or acidic vehicle influenced glial expression of Egr1, cFos, pCREB or transitin, and whether levels of cell death in NMDA-damaged retinas were influenced. We found that pH-neutral insulin and acidic vehicle failed to stimulate the accumulation of Egr1, cFos, pCREB or transitin in glia (data not shown). In addition, we found that pH-neutral insulin had no effect upon NMDA-induced cell death. Unlike insulin-treatment, which increased levels of NMDA-induced cell death, injections of acidic vehicle for 2 consecutive days prior to NMDA-treatment resulted in modest, but significant, decreases in numbers of dying cells (data not shown).
Effects of the combination insulin and FGF2
In undamaged retinas, the combination of insulin and FGF2 is known to stimulate the proliferation of Müller glia (Fischer et al. 2002b). Thus, we sought to determine how the combination of insulin and FGF2 influences MAPK-signaling in the retina. Different from the Müller glia-specific effects of treatment with FGF2 alone, insulin and FGF2 stimulated the accumulation of pCREB in numerous cells across all nuclear layers of the retina (compare Figs. 8b and 8c). Similar to treatments with insulin or FGF2 alone, we found that the combination of insulin and FGF2 stimulated the expression of cFos in Müller glia in central and peripheral regions of the retina (Figs. 8d-f). Müller glia in peripheral regions of retinas treated with insulin and FGF2 expressed both Egr1 and cFos (Figs. 8g-j). Retinal neurons did not have noticeable increases in immunoreactivity for cFos or Egr1 when treated with the combination of insulin and FGF2 (Figs. 8g and 8h). Similar to the affects of FGF2 alone, insulin and FGF2 stimulated the accumulation of p38 MAPK in Müller glia across central and peripheral regions of the retina (data not shown).
Figure 8.
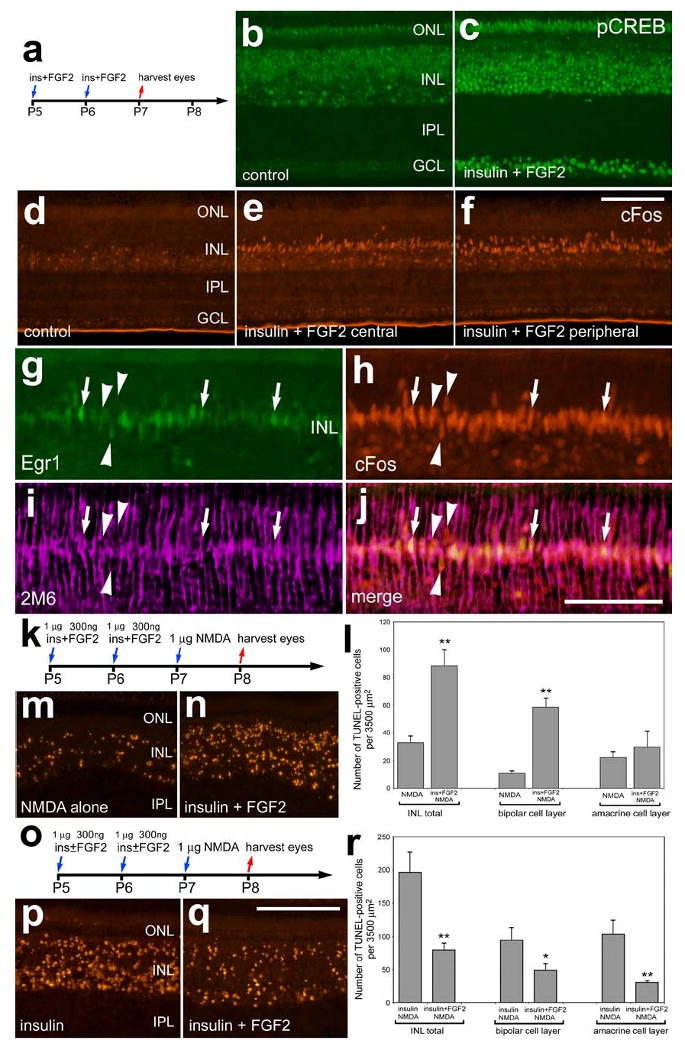
Insulin and FGF2 stimulate glial accumulation of cFos, Egr1 and pCREB and decrease neuronal survival in response to NMDA-treatment. Retinas were obtained from eyes that were injected at P5 and P6 with the combination of insulin and FGF2 or saline and harvested at P7 (a-j), or from eyes that were injected at P5 and P6 with the saline, insulin alone, or the combination of insulin and FGF2, 1 μmol NMDA at P7 and harvested at P8 (k-r). Vertical sections of the retina were labeled with antibodies to pCREB (b and c), cFos (red; d-f and h), Egr1 (green; g) or 2M6 (magenta; i). Arrows indicate the nuclei of 2M6-positive Müller glia that were immunoreactive for Egr1 and cFos, and arrow-head indicate the nuclei of Müller glia that were immunoreactive for cFos alone. The TUNEL method was used to label dying cells (m,n,p and q). The histograms in panels l and r illustrate numbers of dying cells that were increased in retinas treated with the combination of insulin and FGF2 before NMDA, whereas FGF2 counteracts the death-inducing affects of insulin-treatment prior to NMDA. Significance of difference (*p<0.004, **p<0.0001) was determined used a student's t-test. The calibration bar (50 μm) in panel c applies to panels b and c, the bar in j applies to d-j, and the bar in q applies to m, n, p and q. Abbreviations: ONL – outer nuclear layer, INL – inner nuclear layer, IPL – inner plexiform layer, GCL – ganglion cell layer.
Since insulin and FGF2 had opposite effects upon the protection of inner retinal neurons, we tested whether the combination of insulin and FGF2 influenced NMDA-induced cell death. We found a significant increase in the number of TUNEL-positive cells in the INL of retinas treated with insulin and FGF2 prior to NMDA compared to numbers of TUNEL-positive cells observed in contra-lateral retinas treated with vehicle prior to NMDA (Figs. 8k-n). Increased numbers of dying cells were found primarily in the distal layers of the INL, among the bipolar cells (Fig. 8n). By comparison, there was a significant decrease in cell death in retinas treated with insulin and FGF2 before NMDA compared to contra-lateral retinas treated with insulin alone (Figs. 8o-r). Addition of exogenous FGF2 significantly counteracted some of the death-promoting actions of insulin in NMDA-treated retinas, reducing numbers of dying cells in both the distal (bipolar) and proximal (amacrine) cell layers of the INL (Fig. 8r).
Unlike insulin or FGF2, EGF failed to induce the accumulation of pERK1/2, pCREB, p38 MAPK, cFos or Egr1 in Müller glia or neurons in the retina (data not shown). Not surprisingly, EGF had no effect upon the levels of cell death resulting from NMDA-treatment (data not shown). This may have resulted because retinal damage is required for Müller glia to up-regulate the EGF receptor, allowing for responses to exogenous EGF (Close et al. 2006).
Injections of insulin or FGF2 before NMDA (Fig. 9a) stimulated the accumulation of microglia-like cells in proximal retinal layers, including the IPL, GCL and NFL. All of the Sox2-positive microglia-like cells in proximal layers of the retina were immunoreactive for p38 MAPK (Fig. 9b). There were approximately twice as many Sox2/p38-positive cells in the proximal layers of retinas treated with insulin or FGF2 before NMDA compared to controls (Figs. 9c-f). To test whether the accumulation of microglia-like cells resulted from increased rates of proliferation, we injected BrdU into eyes 4 hrs before harvesting tissues (Fig. 9a). In retinas treated with NMDA alone, we found many BrdU-labeled microglia-like cells in the IPL (Fig. 9g). There were significant increases in the number of BrdU-labeled cells in the IPL of retinas treated with insulin or FGF2 prior to NMDA (Figs. 9h-j).
Figure 9.
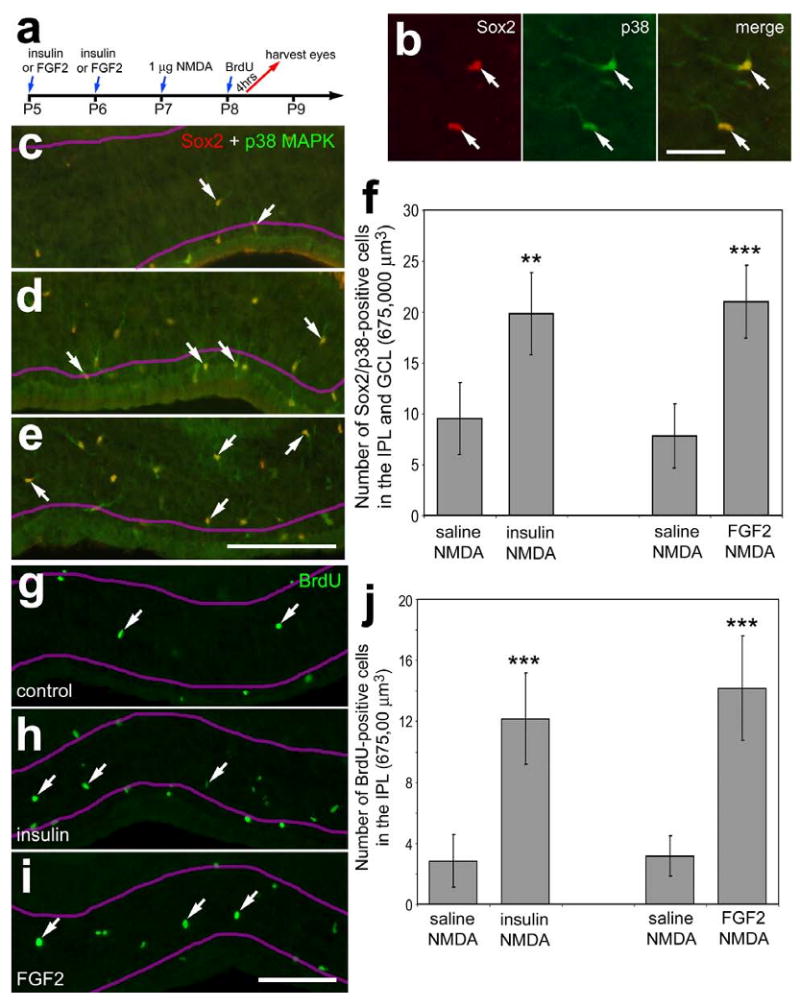
Intraocular injections of FGF2 or insulin before retinal damage stimulate the proliferation of cells in inner retinal layers. (a) Retinas were obtained from eyes that received 2 consecutive daily injections of saline (c and g), insulin (d and h), or FGF2 (b, e and i) at P5 and P6, 1 μmol of NMDA at P7, BrdU at P8, and tissues were harvested 4 hours after the final injection. Vertical sections of the retina were labeled with antibodies to Sox2 (red; b) and p38 MAPK (green; b-e), or BrdU (g-i). Arrows indicate microglia-like cells in the IPL, GCL or NFL. The magenta lines indicate the distal and proximal borders of the IPL. The histogram in panel f illustrates the mean number (±standard deviation) of Sox2/p38 MAPK-positive cells in the IPL, GCL or NFL. The histogram in panel j illustrates the mean number (±standard deviation) of BrdU-positive cells in the IPL. Significance of difference (**p<0.001, ***p<0.0001) was determined by using a two-tailed, unpaired Student's t-test. The calibration bar (50 μm) in panel b applies to panel b alone, and the bar in i applies to panels c-e and g-i. Abbreviations: ONL – outer nuclear layer, INL – inner nuclear layer, IPL – inner plexiform layer, GCL – ganglion cell layer.
FGF2 stimulates Müller glia to proliferate in response to acute damage
In response to 2 μmol of NMDA, Müller glia re-enter S-phase in synchrony 2 days after treatment, whereas 1 μmol of NMDA fails to elicit a significant proliferative and regenerative response (Fischer 2005; Fischer and Reh 2001; Fischer and Reh 2003). Consistent with previous reports, one day after treatment with 1 μmol of NMDA there was no evidence for Müller glial proliferation in central or peripheral regions of the retina (Figs. 10a-c). Müller glia did not proliferate in central regions of retina with FGF2-treatment before NMDA (Fig. 10d). By contrast, FGF2-treatment before NMDA resulted in glial proliferation in peripheral regions of the retina (Figs. 10e and 10f). Numbers of proliferating cells were increased in peripheral regions of the retina and decreased in abundance with increasing distance from the peripheral edge of the retina (Fig. 10f). We confirmed that the proliferating cells were Müller glia by combining labeling for Sox2, BrdU and PCNA (Figs. 10g-j). Consistent with previous reports (Fischer et al. 2002b; Fischer and Reh 2001), the proliferating Müller glia undergo interkinetic nuclear migration. Thus, the nuclei are no longer aligned in the middle of the INL. We found no evidence for glial proliferation in retinas treated with insulin before NMDA (Figs. 10k and 10l). By contrast, the combination of insulin and FGF2 stimulated the proliferation of Müller glia in peripheral regions of the retina at 1 day after NMDA-treatment (Figs. 10m and 10n). In response to the combination of insulin and FGF2, the proliferating Müller glia were concentrated in peripheral regions of the retina (Figs. 10m and 10n), similar to treatments of FGF2 alone before NMDA.
Figure 10.
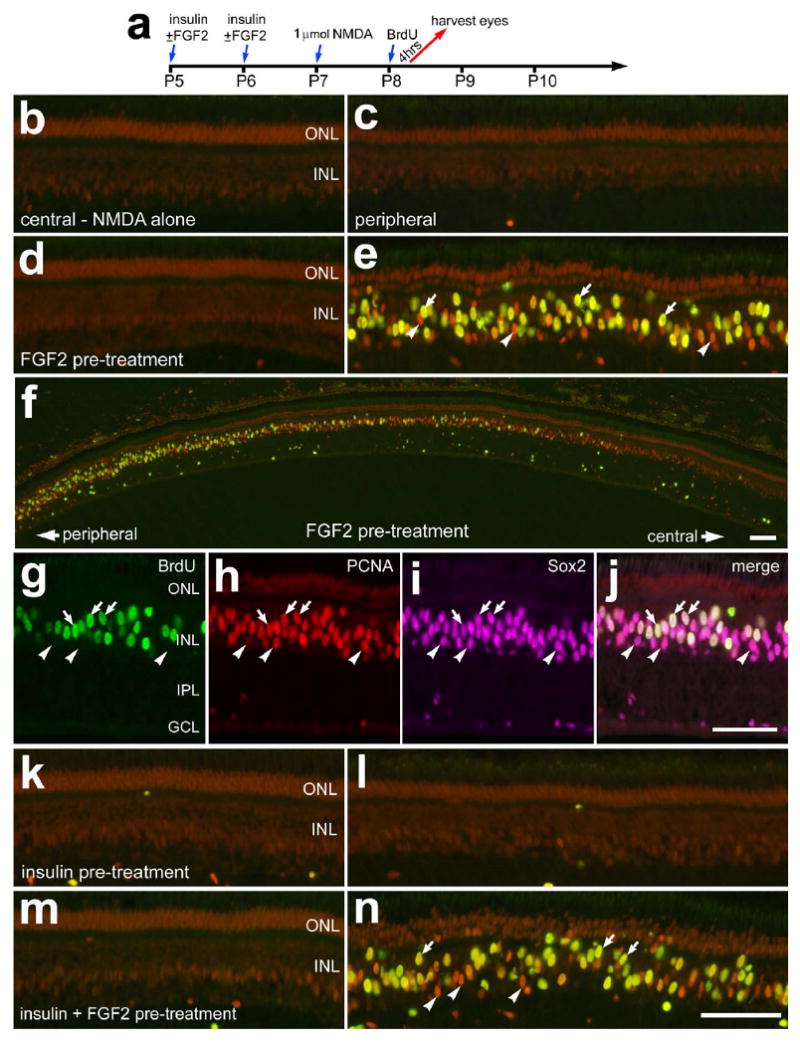
The proliferation of Müller glia in damaged retinas is potentiated by FGF2, but not insulin, prior to acute damage. Retinas were obtained from eyes that received 2 consecutive daily injections of vehicle or growth factor at P5 and P6, 1 μmol of NMDA at P7, 2 μg of BrdU at P8 and harvested 4hrs after the final injection (a). Eyes were injected with vehicle (b and c), FGF2 alone (d-j), insulin alone (k and l), or the combination of insulin and FGF2 (m and n). Vertical sections of the retina were labeled with antibodies to PCNA (red), BrdU (green), and Sox2 (magenta). Arrows indicate the nuclei of Müller glia that were immunoreactive for BrdU and PCNA (e and f) or BrdU, PCNA and Sox2 (g-j). Arrow-heads indicate the nuclei of Müller glia that are labeled for PCNA alone (e and f) or PCNA and Sox2 (g-j). The calibration bar (50 μm) in panel f applies to panel f alone, the bar in j applies to g-j, and the bar in n applies to a-e and k-n. Abbreviations: ONL – outer nuclear layer, INL – inner nuclear layer, IPL – inner plexiform layer, GCL – ganglion cell layer.
Discussion
We report here that intraocular injections of FGF2 activate pERK1/2, pCREB, p38 MAPK, cFos and Egr1 selectively in Müller glia. We find that NMDA-induced retinal damage was significantly decreased when the Müller glia were stimulated by FGF2. In other words, FGF2-mediated changes in the activity of Müller glia render inner retinal neurons resistant to an excitoxic insult. Furthermore, the proliferation of Müller glia in peripheral regions of the retina was potentiated by FGF2 when applied before NMDA. By comparison, intraocular injections of insulin actived microglia-like cells, as indicated by the up-regulation of transitin and LMG, and exacerbated the damage caused by NMDA. Similar to FGF2, insulin stimulated Müller glia to accumulate pERK1/2, cFos and Egr1, but not p38 MAPK or pCREB. Since indicators of active MAPK-signaling were not up-regulated in retinal neurons in response to treatments with insulin or FGF2, we propose that the neuro-protective effects of FGF2 are elicited through changes in the activity of Müller glia, and the “death-promoting” effects of insulin are elicited through combined changes in the activity of Müller glia and microglia-like cells.
Similar to findings reported here, other survival-promoting factors may act through the Müller glia in the retina. For example, intraocular injections of CNTF, up to 5 days prior to NMDA-treatment, are potently neuroprotective and greatly reduce the death of bipolar and amacrine cells (Fischer et al. 2004b). Consistent with these findings, a number of studies have indicated the CNTF delays or prevents the loss of retinal neurons in different paradigms of retinal degeneration (Chong et al. 1999; Liang et al. 2001; Watanabe and Fukuda 2002). Although CNTF is known to protect photoreceptors, activated STAT3 is found predominantly in the nuclei of Müller glia, not photoreceptors (Peterson et al. 2000). Similarly, the neuroprotective effects of nerve growth factor (NGF), brain-derived neurotrophic factor (BDNF) and GDNF are thought to be elicited through changes in the activity of Müller glia (Harada et al. 2003; Harada et al. 2002). The protective effects of GDNF in the retina are thought to increase the production of FGF2 by Müller glia (Harada et al. 2002). However, we report here that the cell signaling pathways (pERK1/2 and p38 MAPK) activated by FGF2 in the retina are found only in the Müller glia, not retinal neurons. Thus, the neuroprotective effects of FGF2 endogenous to the retina may be elicited, in part, via an autocrine feed-forward loop.
Signaling through ERK1/2 in Müller glia promotes neuroprotection in the retina. A recent report from Nakazawa and colleagues indicates that pERK1/2 and cFos accumulate in Müller glia in NMDA-damaged murine retina (Nakazawa et al. 2008). Furthermore, numbers of dying cells were increased more than 2-fold in NMDA-treated retinas from ERK1-/- animals compared to numbers of dying amacrine and ganglion cells in wild-type controls (Nakazawa et al. 2008). These findings suggest that the activation of the ERK1 pathway in Müller glia some how protects inner retinal neurons following an excitotoxic insult. Consistent with these findings, we have recently reported that NMDA-treatment in the chick retina stimulates Müller glia to accumulate pERK1/2, pCREB, cFos and Egr1, and inhibitors of MEK and the FGF receptor suppress the transdifferentiation of the Müller glia that otherwise results from NMDA-treatment (Fischer et al. 2009). Consistent with these findings, we report here that FGF2 selectively stimulates MAPK-signaling in Müller glia and, consequently, potentiates the ability of the glia to proliferate in response to damage and protect retinal neurons.
The combination of insulin and FGF2, but not either factor alone, is known to stimulate the transdifferentiation of Müller glia in the absence of neuronal damage (Fischer et al. 2002b). We propose that the transdifferentiation of Müller glia that results from the combination of insulin and FGF2 results from both direct and indirect stimulation of the Müller glia. Here we show that FGF2 and insulin have different affects upon Müller glia and microglia. Shortly after a single injection of FGF2, we found that the Müller glia responded by accumulating different components of active MAPK-signaling, whereas insulin did not influence the Müller glia in a similar manner. Although the affects of acute insulin-treatment upon microglia and Müller glia were not prevalent, 2 consecutive daily injections of insulin activated the microglia, and this may have secondarily stimulated Müller glia to up-regulate cFos and Egr1. Insulin-induced signaling from microglia to Müller glia remains uncertain, but could involve factors such as NGF, BDNF or GDNF (Harada et al. 2000). Taken together, these findings suggest that FGF2 may act at receptors expressed by the Müller glia, whereas insulin may activate microglia which in turn stimulates the Müller glia.
FGF2-treatment “primes” the Müller glia to proliferate and transdifferentiate in response the acute retinal damage. In response to sufficient acute neuronal damage, numerous Müller glia de-differentiate, re-enter the cell-cycle, and express genes normally found in embryonic retinal progenitors. These genes include Cash1 (ascl1a), Pax6, Chx10, PCNA (Fischer and Reh 2001), Six3 (Fischer 2004; Fischer 2005), Notch1, Sox2 (Hayes et al. 2007) and the nestin-related intermediate filament transitin (Fischer and Omar 2005). The proliferation of the Müller glia is an integral step in becoming progenitor-like cells and differentiating into neuronal cells (Fischer 2005; Fischer and Reh 2003; Reh and Fischer 2001). In response to 2 μmol of NMDA, but not 1 μmol, numerous Müller glia re-enter S-phase of the cell cycle 2 days after treatment, and go through M-phase at 3 days after treatment in synchrony (Fischer and Reh 2001). By comparison, we report here that significant numbers of Müller glia transdifferentiate in peripheral regions of retinas 1 day after treatment with 1 μmol NMDA when FGF2 was applied in the days preceding the damage. Consistent with these findings, 3 consecutive daily intraocular injections of insulin and FGF2 stimulate Müller glia to proliferate and become progenitor-like cells (Fischer et al. 2002b). The transdifferentiation of Müller glia does not occur with 2 consecutive daily injections of insulin and FGF2, consecutive daily injections of either factor alone, or by one large dose of insulin and FGF2 (Fischer et al. 2002b; Fischer et al. 2004a). Consistent with these findings, a recent report in the mouse has demonstrated that intraocular injections of FGF2 alone or in combination with insulin greatly stimulate the proliferation of Müller glia in NMDA-damaged retinas (Karl et al. 2008). Taken together these findings suggest that sustained MAPK-signaling promotes the proliferation and transdifferentiation of the Müller glia, but additional damage- or microglial-derived signals may be required.
We found that insulin activates microglia-like cells without damaging retinal neurons. In retinas treated with insulin, there were significant increases in the expression of transitin and LMG in cells that inhabit inner retinal layers. However, it remains uncertain whether the increased immunolabeling for transitin in the peripheral processes of microglia-like cells represented an increase in expression, elongation of processes, or combination of these possibilities. In addition, we provide evidence that the insulin receptor is not normally expressed by retinal cells. It is possible that insulin may be acting though IGF1 receptors, which are expressed by retinal cells (unpublished observation). Insulin is known to act at IGF1 receptors, but the affinity of insulin for the IGF1 receptor is about 100-fold less than that of IGF1 (Steele-Perkins et al. 1988; Waldbillig et al. 1991). The affects of IGF1 on Müller glia, microglia and retinal neuroprotection remain unknown. It is worth noting that the injections of insulin and FGF2, that we applied, transiently elevated levels well above normal physiological concentrations. In the chicken, normal levels of insulin and IGF1 are relatively low, with serum levels of approximately 0.7 ng/ml and 13 ng/ml, respectively (Lu et al. 2007). However, elevated levels of insulin, related factors, and FGF's are known to could occur under pathological conditions. Levels of IGF1, IGF2 and FGF's are increased in the retina in response to damage (Cao et al. 2001; Fischer et al. 2004a). Although pro-insulin mRNA is readily detected in the retina, the identity of the cell types that express insulin and related factors remain uncertain. By comparison, there is evidence that FGF's are expressed by Müller glia and the pigmented epithelium in the mature eye (Joly et al. 2007; Layton et al. 2006).
The responses of Müller glia to growth factors are not uniform across all regions of the post-hatch chicken retina. The Müller glia in peripheral regions of the retina transdifferentiate more readily compared to those in central regions of the retina. As the animal ages the region in which proliferating glia are found becomes increasingly confined to peripheral regions of the retina, at least through to P30 (Fischer and Reh 2003). For example, toxin treatment within the first week after hatching results in proliferating Müller glia in central regions of the retina, while toxin-treatment after the first post-hatch week results in proliferating Müller glia in more peripheral regions of the retina. Similarly, the Müller glia that proliferate or transiently up-regulate neuronal filamentous proteins in response to intraocular injections of insulin and FGF2 are found in far peripheral regions of the retinas, whereas the glia in central regions of the retina do not response similarly to insulin and FGF2 (Fischer et al. 2002b; Fischer et al. 2004a). These findings indicate that Müller glia continue to mature in a functioning retina and become resistant to re-entering the cell cycle in response to damage. Consistent with this notion, Müller glia in peripheral regions of the chicken retina have an “immature” morphology compared to those found in more central regions of the retina (Anezary et al. 2001). In addition, Müller glia in the zebrafish retina appear to undergo distinct stages of differentiation and maturation as indicated by the expression of different biomarkers (Peterson et al. 2001). Furthermore, the maturation of neurons, including photoreceptors, in far peripheral regions of the retina is greatly slowed in far peripheral regions of the post-hatch chick (Ghai et al. 2008). The factors and signaling pathways that promote the maturation of Müller glia in the retina remain uncertain. We propose that the maturation of Müller glia may involve a progressive decrease in the ability to respond to FGF's which spreads from central to peripheral regions of the retina. Similarly, Müller glia in the rodent retina are known to loose the capacity to respond to EGF during postnatal maturation (Close et al. 2006).
Conclusions
We conclude that FGF2 selectively activates components of the MAPK signaling pathway in Müller glia; these components include pERK1/2, p38 MAPK, pCREB, cFos and Egr1. With FGF2-mediated stimulation of Müller glia, retinal neurons are protected against NMDA-mediated excitotoxicity. By comparison, insulin activates microglia-like cells, as indicated by the up-regulation of p38 MAPK, transitin and LMG, and the Müller glia are stimulated to express cFos and Egr1. With insulin-mediated stimulation of microglia-like cells and Müller glia retinal neurons are more susceptible to an excitotoxic insult. We propose that FGF2 modifies the activity and function of Müller glia to protect retinal neurons against excitotoxic cell death. By contrast, insulin modifies the activity and function of microglia-like cells and Müller glia so that retinal neurons are more susceptible to excitotoxic cell death
Acknowledgments
We thank Dr. H.M. El-Hodiri for comments that contributed to the final form of this paper. We thank Drs. P. Linser and P. Henion for providing antibodies to 2M6 and transitin, respectively. Confocal microscopy was performed at the Hunt-Curtis Microscopy Facility at The Ohio State University. The LMG and BrdU antibodies developed by Drs L. Reichardt and A. Kawakami, respectively, were obtained from the Developmental Studies Hybridoma Bank developed under auspices of the NICHD and maintained by the University of Iowa, Department of Biological Sciences, Iowa City, IA 52242. This work was supported by a grant (EY016043) from the National Eye Institute.
References
- Anezary L, Medina JI, Sanchez-Nogueiro J, Lopez-Gallardo M, Prada C. Shape diversity among chick retina Muller cells and their postnatal differentiation. J Comp Neurol. 2001;438(1):32–49. doi: 10.1002/cne.1300. [DOI] [PubMed] [Google Scholar]
- Cahill MA, Janknecht R, Nordheim A. Signalling pathways: jack of all cascades. Curr Biol. 1996;6(1):16–9. doi: 10.1016/s0960-9822(02)00410-4. [DOI] [PubMed] [Google Scholar]
- Cao W, Li F, Steinberg RH, Lavail MM. Development of normal and injury-induced gene expression of aFGF, bFGF, CNTF, BDNF, GFAP and IGF-I in the rat retina. Exp Eye Res. 2001;72(5):591–604. doi: 10.1006/exer.2001.0990. [DOI] [PubMed] [Google Scholar]
- Chaum E. Retinal neuroprotection by growth factors: a mechanistic perspective. J Cell Biochem. 2003;88(1):57–75. doi: 10.1002/jcb.10354. [DOI] [PubMed] [Google Scholar]
- Chong NH, Alexander RA, Waters L, Barnett KC, Bird AC, Luthert PJ. Repeated injections of a ciliary neurotrophic factor analogue leading to long-term photoreceptor survival in hereditary retinal degeneration. Invest Ophthalmol Vis Sci. 1999;40(6):1298–305. [PubMed] [Google Scholar]
- Close JL, Liu J, Gumuscu B, Reh TA. Epidermal growth factor receptor expression regulates proliferation in the postnatal rat retina. Glia. 2006;54(2):94–104. doi: 10.1002/glia.20361. [DOI] [PubMed] [Google Scholar]
- Fischer AJ. Neural regeneration in the chicken retina. Progress in Retinal and Eye Research. 2004 doi: 10.1016/j.preteyeres.2004.07.003. in press. [DOI] [PubMed] [Google Scholar]
- Fischer AJ. Neural regeneration in the chick retina. Prog Retin Eye Res. 2005;24(2):161–82. doi: 10.1016/j.preteyeres.2004.07.003. [DOI] [PubMed] [Google Scholar]
- Fischer AJ, Dierks BD, Reh TA. Exogenous growth factors induce the production of ganglion cells at the retinal margin. Development. 2002a;129(9):2283–91. doi: 10.1242/dev.129.9.2283. [DOI] [PubMed] [Google Scholar]
- Fischer AJ, McGuire CR, Dierks BD, Reh TA. Insulin and fibroblast growth factor 2 activate a neurogenic program in Muller glia of the chicken retina. J Neurosci. 2002b;22(21):9387–98. doi: 10.1523/JNEUROSCI.22-21-09387.2002. [DOI] [PMC free article] [PubMed] [Google Scholar]
- Fischer AJ, Omar G. Transitin, a nestin-related intermediate filament, is expressed by neural progenitors and can be induced in Muller glia in the chicken retina. J Comp Neurol. 2005;484(1):1–14. doi: 10.1002/cne.20406. [DOI] [PubMed] [Google Scholar]
- Fischer AJ, Omar G, Eubanks J, McGuire CR, Dierks BD, Reh TA. Different aspects of gliosis in retinal Muller glia can be induced by CNTF, insulin and FGF2 in the absence of damage. Molecular Vision. 2004a;10:973–986. [PubMed] [Google Scholar]
- Fischer AJ, Reh TA. Muller glia are a potential source of neural regeneration in the postnatal chicken retina. Nat Neurosci. 2001;4(3):247–52. doi: 10.1038/85090. [DOI] [PubMed] [Google Scholar]
- Fischer AJ, Reh TA. Potential of Muller glia to become neurogenic retinal progenitor cells. Glia. 2003;43(1):70–6. doi: 10.1002/glia.10218. [DOI] [PubMed] [Google Scholar]
- Fischer AJ, Schmidt M, Omar G, Reh TA. BMP4 and CNTF are neuroprotective and suppress damage-induced proliferation of Muller glia in the retina. Mol Cell Neurosci. 2004b;27(4):531–42. doi: 10.1016/j.mcn.2004.08.007. [DOI] [PubMed] [Google Scholar]
- Fischer AJ, Scott MA, Tuten W. Mitogen-activated protein kinase-signaling stimulates Muller glia to proliferate in acutely damaged chicken retina. Glia. 2009;57(2):166–81. doi: 10.1002/glia.20743. [DOI] [PMC free article] [PubMed] [Google Scholar]
- Frank DA, Greenberg ME. Signal transduction pathways activated by ciliary neurotrophic factor and related cytokines. Perspect Dev Neurobiol. 1996;4(1):3–18. [PubMed] [Google Scholar]
- Ghai K, Stanke JJ, Fischer AJ. Patterning of the circumferential marginal zone of progenitors in the chicken retina. Brain Res. 2008;1192:76–89. doi: 10.1016/j.brainres.2007.01.105. [DOI] [PMC free article] [PubMed] [Google Scholar]
- Harada C, Harada T, Quah HM, Maekawa F, Yoshida K, Ohno S, Wada K, Parada LF, Tanaka K. Potential role of glial cell line-derived neurotrophic factor receptors in Muller glial cells during light-induced retinal degeneration. Neuroscience. 2003;122(1):229–35. doi: 10.1016/s0306-4522(03)00599-2. [DOI] [PubMed] [Google Scholar]
- Harada T, Harada C, Kohsaka S, Wada E, Yoshida K, Ohno S, Mamada H, Tanaka K, Parada LF, Wada K. Microglia-Muller glia cell interactions control neurotrophic factor production during light-induced retinal degeneration. J Neurosci. 2002;22(21):9228–36. doi: 10.1523/JNEUROSCI.22-21-09228.2002. [DOI] [PMC free article] [PubMed] [Google Scholar]
- Harada T, Harada C, Nakayama N, Okuyama S, Yoshida K, Kohsaka S, Matsuda H, Wada K. Modification of glial-neuronal cell interactions prevents photoreceptor apoptosis during light-induced retinal degeneration. Neuron. 2000;26(2):533–41. doi: 10.1016/s0896-6273(00)81185-x. [DOI] [PubMed] [Google Scholar]
- Hayes S, Nelson BR, Buckingham B, Reh TA. Notch signaling regulates regeneration in the avian retina. Dev Biol. 2007;312(1):300–11. doi: 10.1016/j.ydbio.2007.09.046. [DOI] [PMC free article] [PubMed] [Google Scholar]
- Joly S, Pernet V, Chemtob S, Di Polo A, Lachapelle P. Neuroprotection in the juvenile rat model of light-induced retinopathy: evidence suggesting a role for FGF-2 and CNTF. Invest Ophthalmol Vis Sci. 2007;48(5):2311–20. doi: 10.1167/iovs.06-1205. [DOI] [PubMed] [Google Scholar]
- Karl MO, Hayes S, Nelson BR, Tan K, Buckingham B, Reh TA. Stimulation of neural regeneration in the mouse retina. Proc Natl Acad Sci U S A. 2008;105(49):19508–13. doi: 10.1073/pnas.0807453105. [DOI] [PMC free article] [PubMed] [Google Scholar]
- Lamba D, Karl M, Reh T. Neural regeneration and cell replacement: a view from the eye. Cell Stem Cell. 2008;2(6):538–49. doi: 10.1016/j.stem.2008.05.002. [DOI] [PMC free article] [PubMed] [Google Scholar]
- Layton CJ, Becker S, Osborne NN. The effect of insulin and glucose levels on retinal glial cell activation and pigment epithelium-derived fibroblast growth factor-2. Mol Vis. 2006;12:43–54. [PubMed] [Google Scholar]
- Liang FQ, Dejneka NS, Cohen DR, Krasnoperova NV, Lem J, Maguire AM, Dudus L, Fisher KJ, Bennett J. AAV-mediated delivery of ciliary neurotrophic factor prolongs photoreceptor survival in the rhodopsin knockout mouse. Mol Ther. 2001;3(2):241–8. doi: 10.1006/mthe.2000.0252. [DOI] [PubMed] [Google Scholar]
- Lu JW, McMurtry JP, Coon CN. Developmental changes of plasma insulin, glucagon, insulin-like growth factors, thyroid hormones, and glucose concentrations in chick embryos and hatched chicks. Poult Sci. 2007;86(4):673–83. doi: 10.1093/ps/86.4.673. [DOI] [PubMed] [Google Scholar]
- Nakazawa T, Shimura M, Ryu M, Nishida K, Pages G, Pouyssegur J, Endo S. ERK1 plays a critical protective role against N-methyl-D-aspartate-induced retinal injury. J Neurosci Res. 2008;86(1):136–44. doi: 10.1002/jnr.21472. [DOI] [PubMed] [Google Scholar]
- Ohta K, Ito A, Tanaka H. Neuronal stem/progenitor cells in the vertebrate eye. Dev Growth Differ. 2008;50(4):253–9. doi: 10.1111/j.1440-169X.2008.01006.x. [DOI] [PubMed] [Google Scholar]
- Osakada F, Ooto S, Akagi T, Mandai M, Akaike A, Takahashi M. Wnt signaling promotes regeneration in the retina of adult mammals. J Neurosci. 2007;27(15):4210–9. doi: 10.1523/JNEUROSCI.4193-06.2007. [DOI] [PMC free article] [PubMed] [Google Scholar]
- Peterson RE, Fadool JM, McClintock J, Linser PJ. Muller cell differentiation in the zebrafish neural retina: evidence of distinct early and late stages in cell maturation. J Comp Neurol. 2001;429(4):530–40. doi: 10.1002/1096-9861(20010122)429:4<530::aid-cne2>3.0.co;2-c. [DOI] [PubMed] [Google Scholar]
- Peterson WM, Wang Q, Tzekova R, Wiegand SJ. Ciliary neurotrophic factor and stress stimuli activate the Jak-STAT pathway in retinal neurons and glia. J Neurosci. 2000;20(11):4081–90. doi: 10.1523/JNEUROSCI.20-11-04081.2000. [DOI] [PMC free article] [PubMed] [Google Scholar]
- Reh TA, Fischer AJ. Stem cells in the vertebrate retina. Brain Behav Evol. 2001;58(5):296–305. doi: 10.1159/000057571. [DOI] [PubMed] [Google Scholar]
- Russell C. The roles of Hedgehogs and Fibroblast Growth Factors in eye development and retinal cell rescue. Vision Res. 2003;43(8):899–912. doi: 10.1016/s0042-6989(02)00416-9. [DOI] [PubMed] [Google Scholar]
- Steele-Perkins G, Turner J, Edman JC, Hari J, Pierce SB, Stover C, Rutter WJ, Roth RA. Expression and characterization of a functional human insulin-like growth factor I receptor. J Biol Chem. 1988;263(23):11486–92. [PubMed] [Google Scholar]
- Waldbillig RJ, Arnold DR, Fletcher RT, Chader GJ. Insulin and IGF-I binding in developing chick neural retina and pigment epithelium: a characterization of binding and structural differences. Exp Eye Res. 1991;53(1):13–22. doi: 10.1016/0014-4835(91)90139-6. [DOI] [PubMed] [Google Scholar]
- Watanabe M, Fukuda Y. Survival and axonal regeneration of retinal ganglion cells in adult cats. Prog Retin Eye Res. 2002;21(6):529–53. doi: 10.1016/s1350-9462(02)00037-x. [DOI] [PubMed] [Google Scholar]