

Abstract
Four experiments measured pigeons' pecking at a small touch-screen image (the CS) that moved toward or away from a source of food (the US). The image's effectiveness as a CS was dependent on its motion, direction, and distance relative to the US. Pecking to the CS increased with proximity to the US when the CS moved toward the US (Experiment 1). This held true even when a departing CS signalled a US of greater magnitude (Experiment 2). Response rates to stationary stimuli were greater the closer they were to the hopper; but rate was less than when the same spot was part of a motion toward food, and greater than when it was part of a motion away (Experiment 3). The rate of responding in all three cases (motion toward, stationary, motion away) decreased exponentially with distance from the hopper. The distance and motion effects observed under these Pavlovian contingencies were different when pecking to the spot was required for reinforcement (Experiment 4).
Keywords: Causal Learning, Classical Conditioning, Motion, Pigeons, Spatial Contiguity, Touch-screen
1. Introduction
It has long been a truism that the laws of conditioning closely parallel the laws of causality: “By conditioning selectively … laboratory rats succeed in attributing the occurrence of reinforcers to their most probable causes” (Mackintosh, 1975, p. 246). Reams of research show that regularity of conjunction, temporal precedence and contiguity between a stimulus and a biologically important event (Denniston, Miller, and Matute, 1996) such as an unconditioned stimulus (US), is fundamentally important in conditioning that stimulus. Even slight gaps between the conditioned stimulus (CS) and the US (i.e., trace conditioning) undermine both the association, and attributions of causality. This has received closest scrutiny in the study of sign-tracking (e.g., Akins, 1996; Brown, 1993; Hearst and Jenkins, 1974; Kaplan and Hearst, 1982; Rescorla, 1982), but also in the direct attribution of causal status, both by pigeons (e.g., Killeen, 1981), and humans (Allan and Tangen, 2005; De Houwer and Beckers, 2002). Events that intervene between a possible cause and effect, or are favored by priors, are attributed primary causal status; in like manner events that come between a stimulus and reinforcer, and those with prior conditioning strength, usurp the conditioning from other stimuli—the classic blocking and overshadowing effects (Arcediano and Matute, 1997; Khallad and Moore, 1996; Rodrigo, Chamizo, McLaren, and Mackintosh, 1997; B. A. Williams, 1975; D. A. Williams and Lolordo, 1995). Spatial contiguity between the stimulus and reinforcer (Ellins and von Kluge, 1990; Kushnir and Gopnik, 2007; Silva, Silva, and Pear, 1992), and between the stimulus and response in operant conditioning (Rumbaugh, Richardson, Washburn, Savage-Rumbaugh, and Hopkins, 1989), are also important both for conditioning, and for our inferences concerning causality. Even the classic associationist principle of similarity plays a role in conditioning (e.g., Rescorla and Gillan, 1980; Steinhauer, 1982). There are numerous fine summaries of these important parallels (e.g., Dickinson, 2001; Lovibond, 2003; Miller and Matute, 1996a; Shanks, Medin, and Holyoak, 1996). Recent research has used these associative hypotheses as default explanations for causal reasoning in non-human animals (Blaisdell, Sawa, Leising, and Waldmann, 2006).
The most seminal work on the perception of causality, after those of Hume (1888) himself, and Mill's (1904) application of causal logic, is that of Michotte (1954, 1963). In one set of many experiments and investigations, Michotte presented images of one object moving up to a second, and, upon touching it, stopping and the second moving off (Scholl and Tremoulet, 2000; Young, Rogers, and Beckmann, 2005). In its most basic form this looked like the action of one billiard ball impinging on another and causing it to move—a classic Victorian illustration of an efficient cause—and was called a launching effect. The impression of causal action is indeed cogent. The launching effect added a spatio-temporal dimension to stimuli which support the standard Humean cues to causality. Videos of this effect, and its modulation by temporal and spatial gaps, are visible at http://www.yale.edu/perception/Brian/demos/causality-Basics.html.
Do animals make a distinction between classic launching effects and those devalued by temporal or spatial asynchronies—delays in reaction of the second object, or actions at a distance? Human animals do, but there has been no convincing demonstration with non-human animals. Young, Beckmann, and Wasserman (2006) were able to differentially condition direct launching vs. delayed or discontiguous launching as stimuli, but control was weak or absent in some of the animals, and others mastered the discrimination based on non-causal features (e.g., the starting location of the stimuli). The authors concluded that their results provided no evidence that the pigeons made a natural distinction between (what humans would call) causal and non-causal sequences. This conclusion was consistent with Lea's failure to demonstrate such control (Lea, 1998, as cited and discussed in Young, Beckmann, and Wasserman, 2006).
In the present series of investigations we take advantage of animals' natural tendency to approach and contact stimuli that predict reinforcement. We first ask whether the motion of a stimulus toward a food hopper, ending with the hopper's activation, elicits more orientation and contact than does motion away from the hopper.
2. Experiment 1: The Direct Launching Effect
2.1 Materials and methods
2.1.1 Subjects
Four male White Carneau pigeons (43, 84, 85, and 86; Palmetto Pigeon Plant, Sumter, SC) with previous experimental histories were individually housed in 380 × 380 × 230 mm cages. They were maintained at 80% of their free-feed body weight.
2.1.2 Apparatus
The apparatus was an operant-chamber (370 × 400 × 390 mm) with a 250 × 190 mm pressure-activated LCD touch-screen (600 × 800 pixels, resolution of .315 mm/pixel; Elo TouchSystems 1246L, Rochester, NY) mounted in the front wall of the chamber. All stimuli presented on the screen and the measurement of the contacts with the screen were controlled with software written in Visual Basic.net®. The food-hopper (550 × 650 mm) and house-light were controlled by the computer via optically isolated relay switches. A 55-mm deep wooden sill at the bottom of the screen prevented the pigeons from operating the screen by touching it with their chest, as depicted in Figure 1. The experimental chamber was mounted inside a sound attenuating cubicle.
Figure 1.
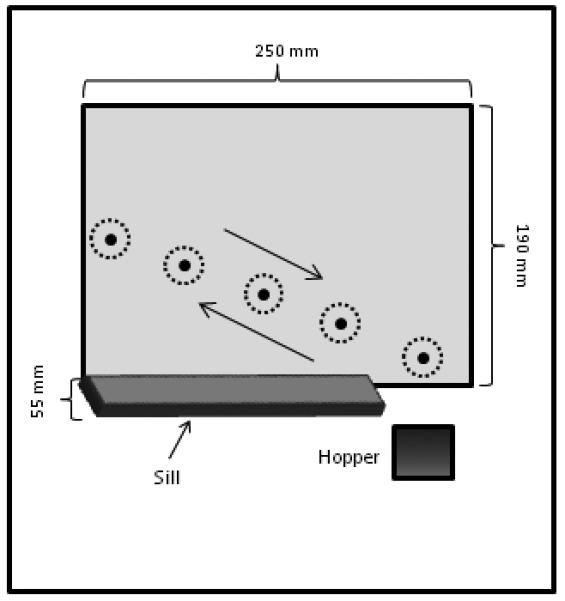
Front panel of the box, showing the touch screen with the moving disc (large black dots). The disc is shown at 5 positions within the motion trajectory. Arrows indicate possible trajectory directions. The small dots draw the circumference of circles having 25.2 mm (40 pixels) in diameter centered on the moving disc. These circles were not visible to pigeons, but served data-analytic purposes.
2.1.3 Procedure
Birds were trained to peck on the screen with an autoshaping procedure that randomly placed a white 4.4-mm diameter disc on the screen, and followed it with food. Pecking on the disc during autoshaping had no programmed consequences. The houselight was illuminated throughout every autoshaping session and during all experimental sessions. After the birds learned to peck the disc, the experiment started. During Phase 1, the same disc served as conditioned stimulus (CS); it smoothly moved along a diagonal trajectory in the screen, either from the left edge halfway up the screen (230 mm from the floor of the chamber) to the bottom of the screen near its right edge, centered exactly above the food hopper, or in the opposite direction, from above the food hopper to the left edge of the screen. During each session the CS moved 30 times towards the hopper (Towards motion) and 30 times away from the hopper (Away motion). Both trajectories were randomly chosen on each trial and lasted for 8 s. After the completion of a trajectory, the hopper was activated for 3.5 s with grain serving as unconditional stimulus (US), followed by an inter-trial interval (ITI) of 40 s. Phase 1 was in effect for 17 sessions
In Phase 2, we aimed at enhancing the discriminability between the stimulus moving towards and the stimulus moving away from the hopper. For two birds (43 and 84) the CS was colored green when moving towards the hopper, and red when moving away from the hopper; two other birds (85 and 86) had the complementary pairing of color and direction. Phase 2 was in effect for 15 sessions.
2.1.4 Data analysis
The last 5 sessions of each condition were used for data analysis. An ANOVA was conducted on each phase, using CS motion direction and its distance to the hopper as within-subject factors, and number of pecks emitted within the CS and in the surrounding area as dependent measure. In order to facilitate the analysis, the CS's trajectory was divided in five equal discrete extents across the length of the x-axis of the touch-screen. For the number of pecks to the moving CS, three levels of analysis were conducted: One included only the pecks inside the 4.4-mm disc (a filter of 7 pixels, the size of a pencil eraser), another included the pecks inside a 25.2-mm circle surrounding disc's center (a filter of 40 pixels), and the last one included all the pecks emitted anywhere on the screen.
2.2 Results
Phase 1
Figure 2 shows the pecks near or in the CS (Filter 40) when it was moving away (open circles) or towards (filled circles) the hopper, as a function of the distance to the hopper during Phase 1. This pattern is mostly due to two pigeons that responded vigorously on the screen; the other two pigeons seldom responded in any of the conditions of this experiment (see Table 1). Although the average number of pecks increased faster when the CS approached to the hopper than when it moved away, no statistically significant direction X distance effect was observed [F(4,30) = 0.52, p = .73]; main effects were also non-significant. Similar results were obtained with more or less stringent filtering: The number of pecks showed similar tendencies as those in Figure 2, but no statistically significant effect could be established.
Figure 2.

Mean number of pecks near or in the CS (Filter 40) when the CS moved towards the hopper (filled circles) or when it moved away (open circles) as a function of the distance to the hopper. The bars are standard errors of the mean.
Table 1.
Mean number of pecks per trial in each experiment.
| Experiment 1 | Experiment 2 | Experiment 3 | Experiment 4 | ||||||||
|---|---|---|---|---|---|---|---|---|---|---|---|
| Phase 1 | Phase 2 | ||||||||||
| Bird | Towards | Away | Towards | Away | Bird | Towards | Away | Green | Red | Towards | Away |
| 43 | 7.53 | 2.97 | 7.15 | 2.99 | 2 | 2.14 | 2.13 | 1.92 | 1.79 | 20.38 | 6.15 |
| 84 | 0.19 | 0.22 | 0.15 | 0.17 | 10 | 1.96 | 0.23 | 0.17 | 0.28 | 27.55 | 17.46 |
| 85 | 0.42 | 0.55 | 0.36 | 0.61 | 67 | 1.85 | 0.04 | 0.47 | 0.74 | 31.81 | 39.17 |
| 86 | 3.45 | 0.60 | 2.48 | 0.03 | 118 | 0.51 | 0.04 | 0.70 | 0.45 | 18.02 | 21.50 |
The sensitivity of our statistical analysis might have been diminished by a generalization between the vigorous responding to the Towards stimulus and the weaker responding to the Away stimulus. To test this possibility, the color of the CS was varied as a function of the direction of their motion.
Phase 2
When the CS was differentially colored in the Towards and Away motions, the birds that responded more consistently during Phase 1 continued to emit more pecks when the CS moved towards the hopper (filled circles of Figure 3) than when it moved away (open circles). This difference was most considerable when the CS was near the hopper, despite a decrease at the closest location to the hopper. The two birds that showed weak pecking in Phase 1 did not peck more in Phase 2 (Table 1). The statistical analysis, which combined performance of all birds, failed to detect any significant effects.
Figure 3.

Mean number of pecks (Filter 40) when the CS moved towards the hopper (filled circles) and when it moved away (open circles) as a function of the distance to the hopper. Comparable data from Phase 1 are shown as dotted lines. The bars are standard errors of the mean.
2.3 Discussion
Results from Experiment 1 suggest that the positive correlation between spatial and temporal proximity in the Towards condition led to a much higher level of responding than in the Away condition, where spatial and temporal proximity were negatively correlated. This effect, however, was only observed in two pigeons; the other two pigeons made very few responses, which might have precluded the motion direction effect in these pigeons, and undermined the detection of the effect by ANOVA.
Direct observation of the pigeon's screen-pecking behavior suggested that sign-tracking was learned, even by the pigeons with low response rates, but that in those pigeons the conditioned response fell short of contacting the screen consistently. Experiment 2 was designed to avoid this problem by recruiting pigeons that would peck the screen. In the new experiment we also precluded the possibility that sign-tracking of the Away stimulus was discouraged because at its termination the pigeon's head was distant from the hopper, which might have reduced the amount of time available for eating.
3. Experiment 2: Differential Hopper Access
3.1 Materials and methods
3.1.1 Subjects
Four new male White Carneau pigeons (2, 10, 67, and 118; Palmetto Pigeon Plant, Sumter, SC) with previous experimental history participated as subjects. These pigeons were explicitly selected because of their vigorous pecking during the autoshaping procedure. They were individually housed and were kept at 80% of their free-feed body weight.
3.1.2 Apparatus
The same apparatus used in Experiment 1 was employed.
3.1.3 Procedure
Keypecking was autoshaped as in Experiment 1. The experimental procedure was similar to that in Phase 2 of Experiment 1: The CSs were colored green or red depending on motion direction; color-motion assignment was counterbalanced. The only difference was that the hopper duration was increased to 5 s for trials in which the CS moved away from the hopper; hopper duration following a Towards stimulus remained at 3.5 s. This asymmetry in hopper duration was introduced to ensure the pigeons received equal or more time in the hopper in the Away condition. This experiment was in effect during 29 sessions.
3.2 Results
Figure 4 shows that, once again, pigeons emitted more responses to a stimulus that moved toward food (filled circles) than one that moved away (open circles). In both cases, the number of pecks increased with spatial proximity. The interaction between motion direction and distance to the hopper had a statistically significant effect on response rate [F(4,30) = 4.16, p < .01].
Figure 4.

Mean number of pecks when the disc moved towards the hopper (filled circles) and when it moved away (open circles) as a function of the distance to the hopper.
4. Experiment 3: Proximity or Motion?
4.1 Materials and methods
4.1.1 Subjects
The same subjects that participated in Experiments 2 (birds 2, 10, 67, and 118) were employed.
4.1.2 Apparatus
The same apparatus described in Experiment 1 was used.
4.1.3 Procedure
In this experiment, the CS was stationary at one of five evenly spaced fixed locations. In each session 6 red discs and 6 green discs appeared in each of the 5 locations. The particular color and location was chosen randomly (without replacement) and kept illuminated for 8 s, until food was delivered. The x-y coordinates of the fixed CSs from left to right were 80-338, 200-394, 320-450, 440-506, and 560-563 pixels (these locations on the screen were as are shown in Figure 1). Differential hopper access, as in Experiment 2, was continued. This experiment lasted for 26 sessions.
4.2 Results
The triangles in Figure 5 show the familiar pattern of more responses when the stimuli were closer to the hopper than when they were distant from it [F(4,30) = 5.28, p < .01]. A comparison with results from Experiment 2 (circles in Figure 5) indicate that response rates to stationary CSs were intermediate between those of CSs moving towards and away from the hopper.
Figure 5.

Mean number of pecks in the Filter 40 loci from the last 5 sessions of Experiments 2 (circles) and 3 (triangles). Closed/open circles are response rates on stimuli moving towards/away from the hopper. Filled triangles denote red CS and open triangles green CS. The continuous curves are traces of the Motion-Dependent Single-Decay model, described in the text.
Stimulus color did not have a noticeable effect on response rate, as shown by the overlapping triangles in Figure 5. Moreover, when color was classified according to its role as Towards or Away CS in Experiment 2, no substantial effect was found [F(4,30) = 0.043, p = .84].
4.3 Discussion: Modeling the Effect
Figure 5 demonstrates the effect of proximity of the response and CS to the source of reinforcement. Although such proximity is enshrined in the laws of conditioning, there has been little study of it compared to the analysis of temporal contiguity; the increasing availability of touch-screens may facilitate such research (Cook, Geller, Zhang, and Gowda, 2004). Figure 5 also demonstrates that motion towards and away from the locus does not simply reduce to location; when the CS-US distance was short, response rates were highest when the CS moved towards vs. away from the hopper (circles), and stationary CSs (triangles) maintained intermediate rates; as the CS-US distance increased, the direction-of-motion advantage vanished.
To verify this model of motion-distance interaction in CS efficacy, we considered 4 hypotheses. A common assumption to all hypotheses was that response rates in each of 4 experimental conditions (Towards and Away from Experiment 2, green and red disc colors from Experiment 3) declined exponentially with CS-US distance:
| (1) |
where B is the predicted response rate, d is the distance between CS and US, λ is the rate of decay of response rate with distance, and x0 is the maximum rate, which is expected when d = 0. The hypotheses considered here specified which free parameters (λ, x0) varied across which experimental conditions. The Multiple Processes hypothesis assumed that different model parameters controlled performance in each experimental condition. In contrast, the Single Process hypothesis assumed that a single set of parameters (i.e., one value of λ and one value of x0) controlled performance across all experimental conditions; variability in response rates shown in Figure 5 would be, under this hypothesis, due to sampling error. The Motion-Dependent hypothesis assumed that different model parameters controlled performance only when direction of CS motion varied, i.e., a single set of parameters would control performance in both stationary conditions. Finally, the Motion-Dependent Single-Decay hypothesis also assumed a single set of parameters for both stationary conditions, and additionally it assumed a single value of λ when the CS moved, and another value of λ when the CS was stationary.
The competing hypotheses considered here were evaluated using Akaike weights (w(AIC); see Wagenmakers and Farrell, 2004). Akaike weights indicate the weight of evidence favoring each hypothesis as the best description of the data, where the best description is a balance between high likelihood of the model and low number of free parameters (Burnham and Anderson, 2002). The method of computation of Akaike weights is described in the Appendix.
Akaike weights are indicated for each hypothesis in Table 2. This criterion substantially favors the Motion-Dependent Single-Decay hypothesis as the best description of the data. Under the constraints of this hypothesis, the best estimates of the free parameters of Equation 1 (shown in Table 3) provide a good fit to the data (curves in Figure 6). These estimates indicate that the maximum response rate was highest when the CS moved toward the hopper, intermediate when it did not move, and lowest when it moved away from the hopper. They also indicate that response rates declined faster with distance from hopper when the CS moved than when it did not.
Table 2.
Analysis of competing hypotheses of motion-distance interaction in CS efficacy.
| Hypothesis | Description | k | RSS | ΔAIC | w(AIC) |
|---|---|---|---|---|---|
| 1. Multiple Processes | Different λ and x0 for each condition |
9 | 47.0 | 15.2 | .00 |
| 2. Single Process | Same λ and x0 for all conditions |
3 | 2352.2 | 65.0 | .00 |
| 3. Motion-Dependent | Same λ and x0 for both stationary conditions |
7 | 52.5 | 4.8 | .08 |
| 4. Motion-Dependent Single-Decay | Same λ and x0 for both stationary conditions and a single λ for both motion conditions |
6 | 52.8 | 0.0 | .92 |
Note. k indicates the number of free parameters in each hypothesis. RSS is the residual sum of squares after fitting predictions to data. ΔAIC indicates the relative likelihood of the data given each hypothesis, corrected by the number of free parameters. w(AIC) is the weight of evidence favoring each hypothesis. The Appendix shows how to compute ΔAIC and w(AIC) on the basis of k and RSS.
Table 3.
Parameters estimates of the Motion-Dependent Single-Decay hypothesis, fitted to data in Figure 6.
| Parameters |
||
|---|---|---|
| λ | x0 | |
| Experiment 2 | ||
| Towards | 0.76 | 158 |
| Away | 0.76 | 33 |
| Experiment 3 | ||
| Both CSs | 0.52 | 57 |
Figure 6.

Mean number of pecks emitted within the moving disc in Experiment 4 (Filter 7), when the disc moved towards the hopper (filled circles) and when it moved away (open circles) as a function of the distance to the hopper.
So far, we have elucidated the interaction between motion and distance of the CS relative to the US on classically-conditioned pecking, where responding is maintained only by the CS-US correlation. In the next experiment we tested whether this interaction was still effective in an operant paradigm, where the CS-US correlation is reduced and the response-US correlation is increased.
5. Experiment 4: Operant Contingency
5.1 Materials and methods
5.1.1 Subjects
The same subjects that participated in Experiments 2 and 3 (birds 2, 10, 67, and 118) were employed.
5.1.2 Apparatus
The same apparatus described in Experiment 1 was used.
5.1.3 Procedure
In this experiment the CS was white and moved back and forth continuously; food was delivered only when pecks occurred within the CS according to a random-interval (RI) 40 s schedule. The hopper durations were 3.5 s for the Towards motion and 5 s for the Away motion. This experiment lasted for 22 sessions.
5.2 Results
The operant contingency increased the accuracy of responding: In this experiment 17% of the responses fell within the CS, whereas the same birds emitted only an average of 4% of their responses within this (admittedly small and moving) stimulus in previous experiments. Figure 6 shows the number of pecks within the disc (Filter 7) at the various proximities and directions. Pigeons generally responded more when the CS moved toward the hopper than when it moved away, except at the closest location. Pecks to the CS in the Away motion decreased with distance from the hopper. Pecks to the Towards CS had an inverted U shape: Responding increased as the disc approached the hopper, except at the closest location. None of these effects, however, reached statistical significance.
5.3 Discussion
The operant contingency increased rates of responding in both directions, with motion toward the hopper eliciting somewhat higher rates of responding than motion away from the hopper—except in the location just above the hopper. This might have happened because the pecks moved off-“key” toward the hopper when the hopper was nearby. Motion of the CS towards the hopper might have primed consummatory responses that were conditioned to the CS in previous experiments. These speculations aside, a comparison between Figures 5 and 6 indicates that the processes operating in classically-conditioned pecking with a moving CS, described by Equation 1, cannot completely account for operant performance. It is likely that other processes, such as competition between sign- and goal-tracking, are critical in describing operant responding on a moving target. We hope that the relevance of these processes and the factors that modulate them are systematically investigated in future research.
6. General Discussion
This study shows that the effectiveness of a Pavlovian CS is enhanced if it is close to the US, and especially so if it moves toward the US. This effect was observed whether the direction of motion was differentially cued by the color of the stimulus (Experiment 1, Phase 2, and Experiment 2) or not (Experiment 1, Phase 1). The interaction between motion direction and distance to the US were well described by a simple model (Equation 1).
A possible exception to the effect of CS motion and CS-US distance is observed when the CS was very close to the US, where response rates were lower than expected in some experimental conditions (Figures 2 and 3) but not in others (Figures 4 and 5). We have speculated here that a CS that is very close to the US may engender goal-tracking, which would reduce responsiveness to the CS. Although it is not yet certain what factors would enhance goal-tracking relative to sign-tracking at short CS-US distances, it appears that Pavlovian CS-US contingencies facilitate sign-tracking, whereas operant response-US contingencies may favor goal–tracking (compare Figures 5 and 6). In both cases, inspection of, or aborted movements toward, the hopper as the time for reinforcement draws near would cause the observed decrease in rates.
Domjan (2005) has argued for a functional approach to Pavlovian conditioning that embeds such conditioning more deeply in the evolutionary context of the subjects, an approach that resonates with Timberlake's behavioral systems theory (Silva, Timberlake, and Koehler, 1996; Timberlake, 1995, 1999). In these contexts, movement of an object toward a biologically significant event such as food is a better predictor of its occurrence than movement away, and better also than static stimuli at similar distances to food. The importance of the phylogenetic relevance of the stimuli, noted by many authors (e.g., Miller and Matute, 1996a, 1996b), plays out here; discrimination of launching effects (Lea, 1998; Young et al., 2006), and dynamic perception by birds in general (Dittrich, Lea, Barrett, and Gurr, 1998; Loidolt, Aust, Steurer, Troje, and Huber, 2006), is often less easy to demonstrate than it seems that it should be. In the present experiments, such motion was closely associated with the delivery of a biologically significant stimulus: lunch; in this context, differential control came out for free.
When the moving stimulus touched the hopper aperture, the hopper operated; it did not move away from the impinging stimulus. In this sense, the experiments do not replicate the operations of the classic launching effect. They do, however, replicate it at a deeper level. Motion toward an object is a more plausible efficient cause of its change of state than motion away. Michotte never studied attribution of causality when the effect was a change of, say, color, rather than a transfer of momentum. If he had, we suspect he would have found results like ours. Insofar as conditioning is an implicit version of the explicit attribution of causality, the demonstration of differential control by motion of stimuli toward or away from food replicates, in a more natural situation for pigeons, the differential attribution of causality that humans make in similar situations.
Acknowledgments
This work was supported by NIMH R01MH066860 and NSF IBN 0236821. Felipe Cabrera is at the Universidad de Guadalajara and was supported by PROMEP UDGPTC-316 and PREA-08 (Universidad de Guadalajara).
Appendix
The corrected Akaike Information Criterion (AICc) was computed for each hypothesis i as:
| (A1) |
where k is the number of free parameters, n is the number of observations, and RSS is the residual sum of squares, which is minimized when fitting the hypothesized model to data.
The number of free parameters for each hypothesis in our study, k, was the number of values that λ and x0 could take across experimental conditions, plus one parameter that served as estimate of error variance. In the Single Process hypothesis, for instance, λ and x0 could take each only one value, so k = 1 + 1 + 1 = 3; in the Multiple Processes hypothesis, λ and x0 could take each 4 values (one for each experimental condition), so k = 4 + 4 + 1 = 9. The total number of observations, n, was the number of response rate measures taken in each condition (5) multiplied by the number of experimental conditions (4) = 20.
Akaike criteria are logarithmic; to convert them to relative values, exponentiate each and divide by the scores for all 4 competing hypotheses:
| (A2) |
An Akaike weight may be interpreted as the relative strength of a model, in an information-theoretical sense, among those compared, given the data (Burnham & Anderson, 2002).
Footnotes
Publisher's Disclaimer: This is a PDF file of an unedited manuscript that has been accepted for publication. As a service to our customers we are providing this early version of the manuscript. The manuscript will undergo copyediting, typesetting, and review of the resulting proof before it is published in its final citable form. Please note that during the production process errors may be discovered which could affect the content, and all legal disclaimers that apply to the journal pertain.
References
- Akins CK. The Topography of Sexually Conditioned Behaviour: Effects of a Trace Interval. The Quarterly Journal of Experimental Psychology Section B. 1996;49:346–356. doi: 10.1080/713932638. [DOI] [PubMed] [Google Scholar]
- Allan LG, Tangen JM. Judging relationships between events: How do we do it. Canadian Journal of Experimental Psychology. 2005;59:22–27. doi: 10.1037/h0087456. [DOI] [PubMed] [Google Scholar]
- Arcediano F, Matute H. Blocking of Pavlovian conditioning in humans. Learning and Motivation. 1997;28:188–199. [Google Scholar]
- Blaisdell AP, Sawa K, Leising KJ, Waldmann MR. Causal reasoning in rats. Science. 2006;311:1020–1022. doi: 10.1126/science.1121872. [DOI] [PubMed] [Google Scholar]
- Brown BL. Sign and goal tracking during delay and trace autoshaping in pigeons. Animal Learning & Behavior. 1993;21:360–368. [Google Scholar]
- Burnham K,P, Anderson DR. Model selection and multimodel inference: A practical information-theoretic approach. Springer-Verlag; New York: 2002. [Google Scholar]
- Cook RG, Geller AI, Zhang G, Gowda RAM. Touchscreen-enhanced visual learning in rats. Behavior Research Methods, Instruments, & Computers. 2004;36:101–106. doi: 10.3758/bf03195555. [DOI] [PubMed] [Google Scholar]
- De Houwer J, Beckers T. A review of recent developments in research and theories on human contingency learning. The Quarterly Journal of Experimental Psychology B. 2002;55:289–310. doi: 10.1080/02724990244000034. [DOI] [PubMed] [Google Scholar]
- Denniston JC, Miller RR, Matute H. Biological significance as a determinant of cue competition. Psychological Science. 1996;7:325–331. [Google Scholar]
- Dickinson A. The 28th Bartlett Memorial Lecture Causal learning: An associative analysis. The Quarterly Journal of Experimental Psychology Section B. 2001;54:3–25. doi: 10.1080/02724990042000010. [DOI] [PubMed] [Google Scholar]
- Dittrich WH, Lea SEG, Barrett J, Gurr PR. Categorization of natural movements by pigeons: Visual concept discrimination and biological motion. Journal of the Experimental Analysis of Behavior. 1998;70:281–300. doi: 10.1901/jeab.1998.70-281. [DOI] [PMC free article] [PubMed] [Google Scholar]
- Domjan M. Pavlovian conditioning: A functional perspective. Annual Review of Psychology. 2005;56:179–206. doi: 10.1146/annurev.psych.55.090902.141409. [DOI] [PubMed] [Google Scholar]
- Ellins SR, von Kluge S. Auditory food cue conditioning: Effects of spatial contiguity and taste quality. The Quarterly Journal of Experimental Psychology Section B. 1990;42:73–86. [PubMed] [Google Scholar]
- Hearst E, Jenkins HM. Sign-tracking: The stimulus-reinforcer relation and directed action. The Psychonomic Society; Austin, TX: 1974. [Google Scholar]
- Hume D. A treatise on human nature. Oxford University Press; London: 1888. [Google Scholar]
- Kaplan PS, Hearst E. Bridging temporal gaps between CS and US in autoshaping: Insertion of other stimuli before, during, and after CS. Journal of Experimental Psychology: Animal Behavior Processes. 1982;8:187–203. [PubMed] [Google Scholar]
- Khallad Y, Moore J. Blocking, unblocking, and overexpectation in autoshaping with pigeons. Journal of the Experimental Analysis of Behavior. 1996;65:575–591. doi: 10.1901/jeab.1996.65-575. [DOI] [PMC free article] [PubMed] [Google Scholar]
- Killeen PR. Learning as causal inference. In: Commons M, Nevin JA, editors. Quantitative studies of behavior. Pergamon; New York: 1981. pp. 289–312. [Google Scholar]
- Kushnir T, Gopnik A. Conditional Probability versus Spatial Contiguity in Causal Learning: Preschoolers Use New Contingency Evidence to Overcome Prior Spatial Assumptions. Developmental Psychology. 2007;43:186–196. doi: 10.1037/0012-1649.43.1.186. [DOI] [PubMed] [Google Scholar]
- Lea SE. Pigeons and the Michotte launch effect: Discrimination, but not of causality. Experimental Psychology Society; York, UK: 1998. [Google Scholar]
- Loidolt M, Aust U, Steurer M, Troje NF, Huber L. Limits of dynamic object perception in pigeons: Dynamic stimulus presentation does not enhance perception and discrimination of complex shape. Learning & Behavior. 2006;34:71–85. doi: 10.3758/bf03192873. [DOI] [PubMed] [Google Scholar]
- Lovibond PF. Causal Beliefs and Conditioned Responses: Retrospective Revaluation Induced by Experience and by Instruction. Journal of Experimental Psychology: Learning, Memory, and Cognition. 2003;29:97–106. [PubMed] [Google Scholar]
- Mackintosh NJ. Conditioning as the perception of causal relations. In: Butts R, Hintikka J, editors. Foundational problems in the special sciences. Vol. 2. D. Reidel; Boston: 1975. pp. 241–250. [Google Scholar]
- Michotte A. La perception de la causalitl=e'. Publications universitaires de Louvain; 1954. [Google Scholar]
- Michotte A. In: The perception of causality. Miles TR, Miles E, editors. Basic Books; New York: 1963. Trans. [Google Scholar]
- Mill JS. A system of logic. 8th ed. London: 1904. [Google Scholar]
- Miller RR, Matute H. Animal analogues of causal judgement. In: Shanks DR, Medin DL, Holyoak KJ, editors. Causal Learning. Academic Press; New York: 1996a. pp. 133–166. [Google Scholar]
- Miller RR, Matute H. Biological significance in forward and backward conditioning: Resolution of a discrepancy between animal conditioning and human causal judgment. Journal of Experimental Psychology: General. 1996b;125:370–386. doi: 10.1037//0096-3445.125.4.370. [DOI] [PubMed] [Google Scholar]
- Rescorla RA. Effect of a stimulus intervening between CS and US in autoshaping. Journal of Experimental Psychology: Animal Behavior Processes. 1982;8:131–141. [PubMed] [Google Scholar]
- Rescorla RA, Gillan DJ. An analysis of the facilitative effect of similarity on second-order conditioning. Journal of Experimental Psychology: Animal Behavior Processes. 1980;6:339–351. [PubMed] [Google Scholar]
- Rodrigo T, Chamizo VD, McLaren IPL, Mackintosh NJ. Blocking in the spatial domain. Journal of Experimental Psychology: Animal Behavior Processes. 1997;23:110–118. doi: 10.1037//0097-7403.23.1.110. [DOI] [PubMed] [Google Scholar]
- Rumbaugh DM, Richardson WK, Washburn DA, Savage-Rumbaugh E, Hopkins WD. Rhesus monkeys (Macana mulatta), video tasks, and implications for stimulus-response spatial contiguity. Journal of Comparative Psychology. 1989;103:32–38. doi: 10.1037/0735-7036.103.1.32. [DOI] [PubMed] [Google Scholar]
- Scholl BJ, Tremoulet PD. Perceptual causality and animacy. Trends in Cognitive Sciences. 2000;4:299–309. doi: 10.1016/s1364-6613(00)01506-0. [DOI] [PubMed] [Google Scholar]
- Shanks DR, Medin DL, Holyoak KJ, editors. Causal Learning: Advances in Research and Theory. Academic Press; New York: 1996. [Google Scholar]
- Silva FJ, Silva KM, Pear JJ. Sign- versus goal-tracking: Effects of conditioned-stimulus-to unconditioned-stimulus distance. Journal of the Experimental Analysis of Behavior. 1992;57:17–31. doi: 10.1901/jeab.1992.57-17. [DOI] [PMC free article] [PubMed] [Google Scholar]
- Silva FJ, Timberlake W, Koehler TL. A Behavior Systems Approach to Bidirectional Excitatory Serial Conditioning. Learning and Motivation. 1996;27:130–150. [Google Scholar]
- Steinhauer GD. Acquisition and maintenance of autoshaped key pecking as a function of food stimulus and key stimulus similarity. Journal of the Experimental Analysis of Behavior. 1982;38:281–289. doi: 10.1901/jeab.1982.38-281. [DOI] [PMC free article] [PubMed] [Google Scholar]
- Timberlake W. Reconceptualizing reinforcement - a causal, system approach to reinforcement and behavior-change. In: Odonohue W, Krasner L, editors. Theories of Behavior Therapy. Amer. Psychological Assoc.; Washington, DC: 1995. pp. 59–96. [Google Scholar]
- Timberlake W. Biological behaviorism. In: O'Donahue W, Kitchener R, editors. Handbook of behaviorism. Academic Press; New York: 1999. pp. 243–284. [Google Scholar]
- Wagenmakers EJ, Farrel S. AIC model selection using Akaike weigths. Psychonomic Bulletin & Review. 2004;11:192–196. doi: 10.3758/bf03206482. [DOI] [PubMed] [Google Scholar]
- Williams BA. The blocking of reinforcement control. Journal of the Experimental Analysis of Behavior. 1975;24:215–226. doi: 10.1901/jeab.1975.24-215. [DOI] [PMC free article] [PubMed] [Google Scholar]
- Williams DA, Lolordo VM. Time cues Block the CS, but the CS does not block time cues. Quarterly Journal of Experimental Psychology Section B -Comparative and Physiological Psychology. 1995;48:97–116. [PubMed] [Google Scholar]
- Young ME, Beckmann JS, Wasserman EA. Pigeons' discrimination of Michotte's Launching Effect. Journal of the Experimental Analysis of Behavior. 2006;86:223–237. doi: 10.1901/jeab.2006.60-05. [DOI] [PMC free article] [PubMed] [Google Scholar]
- Young ME, Rogers ET, Beckmann JS. Causal impressions: Predicting when, not just whether. Memory and Cognition. 2005;33:320–331. doi: 10.3758/bf03195320. [DOI] [PubMed] [Google Scholar]